A candidate protostellar object in the L 1457 / MBM 12 cloud
Abstract
Aims. The association of young T Tauri stars, MBM 12A, indicates that L 1457 was forming stars not too long ago. With our study we want to find out whether there are still signs of ongoing star formation in that cloud.
Methods. Using the Max-Planck-Millimeter-Bolometer MAMBO at the IRAM 30m telescope, we obtained a map of about centered on L 1457 in the dust continuum emission at 230 GHz. Towards the most intense regions in our bolometer map, we obtained spectra at high angular resolution in the CS and the N2H+ lines using the IRAM 30m telescope.
Results. We find that the cold dust in L 1457 is concentrated in several small cores with high H2 column densities and solar masses. The density profiles of the cores are inconsistent with a sphere with constant density. These cores are closer to virial equilibrium than is the cloud as a whole. Data from the VLA and Spitzer archives reveal two point sources in the direction of one dust core. One of the sources is probably a distant quasar, whereas the other source is projected right on a local maximum of our dust map and shows characteristics of a protostellar object.
Key Words.:
ISM: clouds – ISM: abundances – ISM: molecules – stars: formation – Individual objects: L 1457, MBM121 Introduction
Class 0 objects are protostellar objects at the beginning of the accretion phase, where the bulk of the final stellar material has not been assembled yet (André et al. andre:etal93 (1993)). These objects have been detected towards various regions with known ongoing star formation (André et al. andre:etal93 (1993), andre:etal99 (1999); Kauffmann et al. kauffmann:etal05 (2005)). Molecular cirrus clouds at high Galactic latitudes so far show only very little star-formation activity, no embedded infrared sources had been found in the IRAS faint source catalog (Magnani et al. magnani:etal95 (1995)). Nevertheless, the existence of a gravitationally bound core in a cirrus clouds (Heithausen et al. heithausen:etal02 (2002), heithausen:etal08 (2008)), which shows evidence of inward motion (Heithausen heithausen99 (1999)), shows that these clouds harbor potential sites of star formation.
One candidate for possible star formation in such clouds is the dark cloud L 1457, located at southern Galactic latitudes below the Taurus region. This cloud is puzzling for two reasons:
-
•
Complete CO maps of L 1457 (Magnani et al. magnani:etal85 (1985); Zimmermann & Ungerechts zimmermann:etal90 (1990); Pound et al. pound:etal90 (1990)) indicate that the cloud as a whole is far from being gravitationally bound. Reach et al. (reach:etal95 (1995)) found extensive CS emission throughout the cloud, indicating dense molecular gas that is closer to virial equilibrium.
-
•
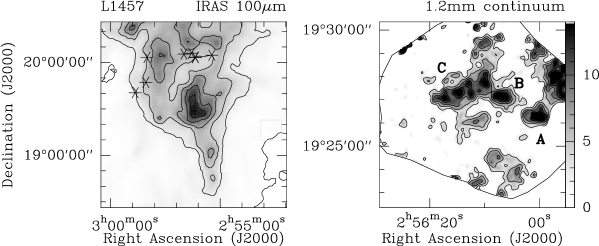
Several T Tauri stars have been detected in the direction of L 1457 (Hearty et al. hearty:etal00 (2000); Luhman luhman01 (2001)), forming the association MBM 12A (see Fig. 1). For this assocation, Luhman (luhman01 (2001)) determined an age of about 2 million years, indicating that, if the young stars are indeed associated with the cloud, L 1457 was forming stars not too long ago.
To shed light on its star-forming capability, we obtained a bolometer map of the densest part of the L 1457 / MBM 12 cloud at a wavelength of 1.2 mm with the IRAM 30 m telescope. The selected region was found to be the most intense portion in the high angular resolution data of the 12CO and 13CO , , and transitions obtained by Zimmermann (zimmermann93 (1993)). Supplementary information on the dynamical state of the core comes from CS observations obtained with the IRAM 30m telescope, too. We discuss a possible association of two continuum point sources detected with the VLA at a wavelength of 3.6cm and with Spitzer Space Telescope at 24m.
2 Observations
L 1457 was observed in 2000 and 2001 in the dust continuum at 1.2mm using the Max-Planck-Millimeter-Bolometer MAMBO at the IRAM 30m radio telescope on Pico Veleta, Spain. MAMBO is sensitive to emission between 210 and 290 GHz, with an effective frequency of 250 GHz for steep thermal spectra. The observations were taken in double-beam on-the-fly mode, i.e., chopping the secondary mirror in azimuth by 50′′ to 70′′ at 2Hz and scanning the sky in azimuth at a speed of 4′′ to 5, then moving in elevation by . The maps were taken under variable winter conditions with line-of-sight opacities between 0.2 and 0.7. The effective beam FWHM is 11′′.
The most intense dust positions in L 1457 were oberved in the CS transition in October 2002 and in the N2H transition in August 2004 with the IRAM 30m radiotelescope. Data were taken in single-position on-off-mode. We obtained small maps with 20′′ spacing between individual positions. We used the VESPA autocorrelation spectrometer with a velocity resolution set to 0.062 km s-1 at 93GHz and 0.060 km s-1 at 98GHz. The angular resolution of the 30m telescope at 93GHz and 98 GHz is 27′′ and 26′′, respectively. The main beam efficiency .
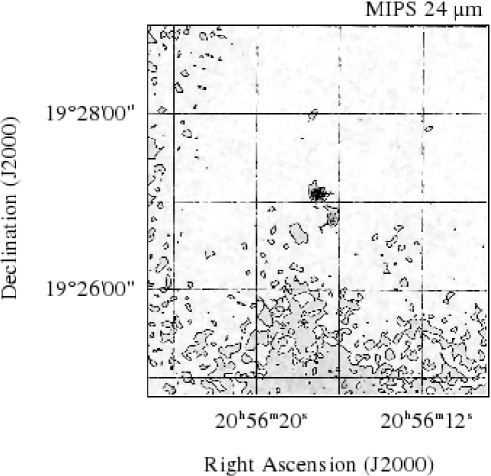
Additionally, we used public data from the VLA and Spitzer archives. In the VLA archive we found two thus far unpublished maps centered on about the same position as our bolometer map. The data were observed on March 6 and 25, 1991 at a wavelength of 3.55 cm with an angular resolution of . The primary beam of the VLA has a full width at half maximum of and covers all our bolometer sources (s. Fig. 3). The noise level in the VLA map is 0.03 mJy/beam. Part of the region was also observed with MIPS (Rieke et al. rieke:etal04 (2004)) onboard the Spitzer Space Telescope (Werner et al. werner:etal04 (2004)) at a wavelength of 24 m. The data were observed on September 23, 2007. The angular resolution of the MIPS instrument at that wavelength is about 6′′, map spacing is 2.5′′. The data taken from the Spitzer archive were already calibrated using the standard pipeline. The noise level in the MIPS map is 0.06 MJy/sr.
| Source | RA | Dec | size | Radius | Peak | Peak | Virial Mass | ||
|---|---|---|---|---|---|---|---|---|---|
| (J2000) | (J2000) | () | (pc) | (mJy/beam) | (cm-2) | (Jy) | (M⊙) | (M⊙) | |
| L 1457-A | 2:56:00.6 | 19:26:17 | 0.07 | 1.0 | |||||
| L 1457-B | 2:56:07.0 | 19:27:10 | 0.06 | 0.7 | |||||
| L 1457-C | 2:56:13.5 | 19:27:30 | 0.11 | 3.1 | |||||
| L 1457-C1 | 2:56:17.2 | 19:27:04 | 0.08 | 0.9 |

3 The distribution of cold dust
Our MAMBO 1.2mm dust map is presented in Fig. 1. Dust is concentrated in several small condensations. A possible extensive diffuse dust component is filtered out by our observing technique. We labeled the three most prominent structures as L 1457-A, B, and C. The part of the core where we detected a point source (see Sect. 4) is referred to as L1457-C1.
To calculate the molecular hydrogen column density from the peak flux density we use the formula provided by Kauffmann et al. (kauffmann:etal08 (2008)), who adopted a dust temperature of 10 K and a wavelength of 1200 m:
.
Ammonia observations reveal a gas temperature of about for the dense core (Gomez et al. gomez:etal00 (2000)). We derive molecular hydrogen column density of up to cm-2 (s. Table 1). Towards XY Ari, a star in the middle of our field, Littlefair et al. (littlefair:etal01 (2001)) derived a visual extinction of mag, confirming our estimate of the molecular hydrogen column density.
Kauffmann et al. (kauffmann:etal08 (2008)) also provide a formula for deriving the molecular hydrogen mass from the total bolometer flux at a wavelength of 1200m for an object with 10 K temperature which is applicable to our observations
where is the distance to the cloud. With a distance of pc, L 1457 has long been thought to be the nearest molecular cloud (Hobbs et al. hobbs:etal86 (1986)). Recent distance determinations suggest, however, a much higher distance. Andersson et al. (andersson:etal02 (2002)) estimate a distance of pc to L 1457; Luhman (luhman01 (2001)) finds 275 pc, and Straižys et al. (straizys:etal02 (2002)) find 325 pc. Adopting a distance of 300 pc to the cloud, we find masses in the range of (Table 1).
Similar to our approach for MCLD123.5+24.9 (Heithausen et al. heithausen:etal08 (2008)) we tried to determine the density profiles of L1457-A and B by obtaining circular averages of the intensity distributions centered on the cores. We find that both are inconsistent with spheres of constant volume densities. Better fits can be derived by Gaussian profiles or centrally peaked density profiles similar to those given by Johnstone et al. (johnstone:etal03 (2003), see also Heithausen et al. heithausen:etal08 (2008)).
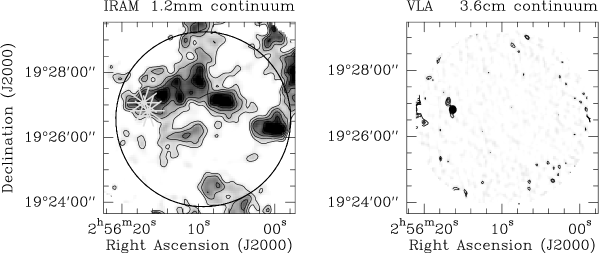
To analyze the stability of the cores we compare their masses with their virial masses , where is the one-dimensional gas velocity dispersion, the radius of the cloud, and the gravitational constant. Here we assume a density profile proportional to . Because towards the regions with significant dust emission no N2H+ was detected down to a rms of K in 0.06 km s-1 wide channels, we use CS data obtained at high angular resolution with the IRAM 30 m telescope (s. Fig. 2) to estimate the velocity dispersion. Parameters of a Gaussian analysis of the CS spectra are listed in Table 2. For L 1457-B and C, the CS spectra show multiple components. For our estimate of the virial mass we took the components closest to km s-1, which is the velocity of the main CS component. If we correct for the contribution of Helium, the ratio of cloud mass to virial mass is in the range of 0.2 to 0.6, indicating that the cores are close to virial equilibrium. This ratio is a lower limit because CS traces a larger volume in the core (e.g. Reach et al. reach:etal95 (1995)) than our bolometer sources Furthermore the CS line might be optically thick. We might therefore systematically overestimate the line width, hence also the virial mass.
| Source | rms | |||
|---|---|---|---|---|
| (K) | (K) | ( km s-1) | ( km s-1) | |
| L 1457-A | 0.69 | 0.09 | ||
| L 1457-B | 0.31 | 0.08 | ||
| 0.25 | 0.08 | |||
| L 1457-C | 0.37 | 0.02 | ||
| 0.31 | 0.02 | |||
| 0.30 | 0.02 | |||
| L 1457-C1 | 0.62 | 0.10 | ||
| 0.33 | 0.10 | |||
| 0.64 | 0.10 |
4 Radio and infrared sources towards the core of L 1457 / MBM 12
The VLA 3.6cm maps (Fig. 3) show two point sources. The brighter one has already been detected by Gomez et al. (gomez:etal00 (2000)) from other VLA archive data and they named it VLA B0253+192. About to the northeast we detected a further point source, which we name J025616+192703. Positions and fluxes are listed in Table 3.
For VLA B0253+192, Gomez et al. (gomez:etal00 (2000)) give a flux density of mJy at the observed wavelength. We determine a higher flux mJy, so the source might be variable. The source is also listed in the NVSS catalog by Condon et al. (condon:etal98 (1998)) at a frequency of 1.4 GHz. At that frequency Condon et al. give a flux density of . Using the flux density by Gomez et al. (gomez:etal00 (2000)) we find a spectral index of , while we find using our value. Both values indicate a steep radio spectrum typical for non-thermal emission. This confirms the proposal by Gomez et al. that the source might be an unrelated background source, possibly a distant quasar.
For J025616+192703 no counterpart can be found in the NVSS catalog. Due to the angular resolution of NVSS catalog of 45′′ (Condon et al. condon:etal98 (1998)), this source is at only half a beam distance from VLA B0253+192. To separate a possible contribution of J025616+192703, we subtracted the emission of VLA B0253+192 from the NVSS image adopting a circular beam size. This way we find an upper limit of 0.3 mJy for the flux of J025616+192703 at 1420 MHz. The spectral index derived with that value would close to or larger than zero, thus synchrotron radiation can be excluded. The spectrum is thus clearly different from that of VLA B0253+192, making a physical association between both sources unlikely.
| J025616+192703 | VLA B0253+192 | |
| VLA 21 cm1 | ||
| mJy | mJy | |
| VLA 3.6 cm | ||
| mJy | mJy | |
| MIPS 24 m | ||
| mJy | mJy | |
| Remarks: 1: Condon et al. (condon:etal98 (1998)) | ||
Both sources are also visible in the Spitzer 24 m map (see Fig. 4). Fluxes and positions are given in Table 3. The Spitzer maps at 70 m and 170 m are unfortunately disturbed and cannot be used to determine the infrared spectra of the sources. In the IRAS 100 m map and our bolometer map the emission is extensive, so we can only determine upper limits for the source fluxes at those wavelengths.
As can be seen in Fig. 3 the source J025616+192703 is projected precisely on a local emission maximum in our bolometer map of L 1457-C. A chance alignment of a background source is very low. It is therefore possible that this source is indeed associated with the dense core, possibly a protostellar condensation, as a Class 0 object, deeply embedded in the core.
The few points of the spectrum of J025616+192703 that we know so far are consistent with established Class 0 sources. For example, IRAM 04191+1522 (André et al. andre:etal99 (1999)) would have a similar infrared intensity at 24 m (Dunham et al. dunham:etal06 (2006)), if put at the same distance. This source is also seen at radio wavelength with a similar flux (André et al. andre:etal99 (1999)). Recently, Kauffmann et al. (kauffmann:etal05 (2005)) and Bourke et al. (bourke:etal06 (2006)) have detected protostellar objects with very low luminosities. These sources cannot be distinguished from the extensive dust emission at mm-wavelength, but are more easily detected at shorter wavelengths, similar to J025616+192703. Without further points in the spectrum it is, however, not possible to draw more conclusions about the evolutionary state about our source.
5 Summary and conclusions
We have presented a bolometer map at 1.2mm, which shows at least three dense dust condensations with peak H2 column densities of cm-2 and solar masses. These are closer to virial equilibrium than is the source as a whole.
Towards one of the condensations, we find two point sources seen in the radio regime at 3.6 cm and in the infrared at 24 m. The radio spectral index of one of the sources indicates nonthermal emission, thus the source is most likely a background object. For the other source the spectrum is only sparsely known. The exact location of the source at a local maximum in L 1457-C suggests a physical assocation with the cloud. We speculate that this source could be a protostellar condensation that is still deeply embedded in the core. Its low luminosity and the detection only at radio and infrared wavelengths could be caused by an object with a temperature similar to that of the surrounding material.
To support this hypothesis more observations of the spectrum of this object between radio and infrared wavelength or a search for an associated outflow are necessary. Possibly owing to the multiple velocity components in the CO data of L1457 (Zimmermann zimmermann93 (1993)) no such outflow has been detected so far. If the protostellar nature of the source is confirmed, the study of this source will significantly increase our knowledge of low-mass star formation outside of the Galactic plane.
Acknowledgements.
This work is based on observations carried out with the IRAM 30 m telescope and the VLA. IRAM is supported by INSU/CNRS (France), MPG (Germany), and IGN (Spain). The National Radio Astronomy Observatory is a facility of the National Science Foundation operated under cooperative agreement by Associated Universities, Inc. This work is also based in part on archival data obtained with the Spitzer Space Telescope, which is operated by the Jet Propulsion Laboratory, California Institute of Technology under a contract with NASA.References
- (1) Andersson, B.G., Idzi, R., Uomoto, A., Wannier, P.G., Chen, B., Jorgensen, A.M., 2002, AJ, 124, 2164
- (2) André, P., Ward-Thompson, D., Barsony, M., 1993, ApJ, 406, 122
- (3) André, P., Motte, F., Bacmann, A., 1999, ApJ, 513, L57
- (4) Bertoldi, F., McKee, C.F., 1992, ApJ, 395, 140
- (5) Bourke, T.L., Myers, P.C., Evans II, N.J., et al., 2006, ApJ, 649, L37
- (6) Condon, J.J., Cotton, W.D., Greisen, E.W., Yin, Q.F., Perley, R.A., Taylor, G.B., Broderick, J.J., 1998, AJ, 115, 1693
- (7) Dunham, M.L., Evans II, N.J., Bourke, T.L., et al., 2006, ApJ, 651, 945
- (8) Gomez, J.F., Trapero, J., Pascual, S., Patel, N., Morales, C., Torrelles, J.M., 2000, MNRAS, 314, 743
- (9) Hearty, T., Neuhäuser, R., Stelzer, B., Fernandez, M., Alcala, J.M., Covino, E., Hambaryan, V., 2000, A&A, 353, 1044
- (10) Heithausen, A. 1999, A&A, 345, L53
- (11) Heithausen, A., Bertoldi, F., & Bensch, F. 2002, A&A, 383, 591
- (12) Heithausen, A., Böttner, C., Walter, F., 2008, A&A, 488, 597
- (13) Hobbs, L.M., Blitz, L., Magnani, L., 1986, ApJ, 306, 109
- (14) Johnstone, D., Fiege, J.D., Redman, R.O., Feldman, P.A., Carey, S.J. 2003 ApJ, 588, L37
- (15) Kauffmann, J., Bertoldi, F., Evans II, N.J., et al., 2005, Astron. Nachr., 326, 878
- (16) Kauffmann, J., Bertoldi, F., Bourke, T.L., Evans II, N.J., Lee, C.W., 2008, A&A, 487, 993
- (17) Littlefair, S.P., Dhillon, V.S., Marsh, T.R., 2001, MNRAS, 327, 669
- (18) Luhman, K.L., 2001, ApJ, 560, 287
- (19) Magnani, L. Blitz, L., Mundy, L., 1985, ApJ, 295, 402
- (20) Magnani, L., Caillault, J.P., Buchalter, A., Beichman, C.A., 1995, ApJS, 96, 159
- (21) Pound, M.W., Bania, T.M., Wilson, R.W., 1990, ApJ, 351, 165
- (22) Reach, W.T., Pound, M.W., Wilner, D.J., Lee, Y., 1995, ApJ, 441, 244
- (23) Rieke, G., Young, E.T., Engelbracht, C.W., et al., 2004, ApJS, 154, 25
- (24) Straižys, V., Černis, K., Kazlauskas, A., Laugalys, V., 2002, Baltic Astronomy, 11, 231
- (25) Werner, M., Roellig, T., Low, F., et al., 2004, ApJS, 154, 1
- (26) Zimmermann, T., Ungerechts, H., 1990, A&A, 238, 337
- (27) Zimmermann, T., 1993, PhD thesis, University of Cologne