A closer view of the radio-FIR correlation: Disentangling the contributions of star formation and AGN activity
Abstract
We extend the Unified Radio Catalog, a catalog of sources detected by various (NVSS, FIRST, WENSS, GB6) radio surveys, and SDSS, to IR wavelengths by matching it to the IRAS Point and Faint Source catalogs. By fitting each NVSS-selected galaxy’s NUV-NIR spectral energy distribution (SED) with stellar population synthesis models we add to the catalog star formation rates, stellar masses, and attenuations. We further add information about optical emission line properties for NVSS-selected galaxies with available SDSS spectroscopy. Using an NVSS 20 cm ( mJy) selected sample, matched to the SDSS spectroscopic (“main” galaxy and quasar) catalogs and IRAS data () we perform an in depth analysis of the radio-FIR correlation for various types of galaxies, separated into i) quasars, ii) star forming, iii) composite, iv) Seyfert, v) LINER and vi) absorption line galaxies using the standard optical spectroscopic diagnostic tools. We utilize SED-based star formation rates to independently quantify the source of radio and FIR emission in our galaxies. Our results show that Seyfert galaxies have FIR/radio ratios lower than, but still within the scatter of, the canonical value due to an additional (likely AGN) contribution to their radio continuum emission. Furthermore, IR-detected absorption and LINER galaxies are on average strongly dominated by AGN activity in both their FIR and radio emission; however their average FIR/radio ratio is consistent with that expected for star forming galaxies. In summary, we find that most AGN-containing galaxies in our NVSS-IRAS-SDSS sample have FIR/radio flux ratios indistinguishable from those of the star-forming galaxies that define the radio-FIR correlation. Thus, attempts to separate AGNs from star-forming galaxies by their FIR/radio flux ratios alone can separate only a small fraction of the AGNs, such as the radio-loud quasars.
Subject headings:
galaxies: fundamental parameters – galaxies: active, evolution – cosmology: observations – radio continuum: galaxies1. Introduction
The radio-FIR correlation is one of the tightest correlations in observational astrophysics (e.g. Helou et al. 1985; Condon 1992; Mauch & Sadler 2007; Yun et al. 2001; Bell 2003; Sargent et al. 2010; Kovacs et al. 2006; Murphy et al. 2009; Appleton et al. 2004). The correspondence between the radiation in the (far-)infrared and that in the radio spans over nearly five orders of magnitude in various types of galaxies, ranging from dwarfs to ULIRGs. Given that the two observational windows, IR and radio, trace independent and different intrinsic physical mechanisms in galaxies – thermal vs. synchrotron radiation – the existence of such a tight correspondence is remarkable. It is generally believed that recent star formation in galaxies is the process that relates IR and radio emission.
The radio-FIR correlation has been extensively studied in the past both in the low (Helou et al., 1985; Condon, 1992; Garrett, 2002; Mauch & Sadler, 2007; Yun et al., 2001; Bell, 2003) and high redshift universe (Sargent et al., 2010; Kovacs et al., 2006; Sajina et al., 2008; Murphy et al., 2009; Appleton et al., 2004; Vlahakis et al., 2008; Ibar et al., 2008; Chapman et al., 2005). It has been shown that, out to redshifts of , the FIR/radio ratios of various types of galaxies are essentially the same as those in the local universe. At higher redshifts radio quiet QSOs have been demonstrated to have FIR/radio ratios consistent with the local value, while the FIR/radio ratios of SMGs are found to be lower by a few factors. This is somewhat contrary to expectations, as the the FIR/radio ratio is expected to be rising with redshift (especially at ) due to the increase of the cosmic microwave background (CMB) energy density () with redshift, , which surpresses the non-thermal component of a galaxy’s radio continuum via inverse-Compton (IC) scattering (see Murphy 2009 for details). An explanation for this discrepancy can be provided by additional processes that add to a galaxy’s radio continuum, such as increased magnetic field strengths or AGN contribution, that may compensate for the radio continuum emission losses due to IC scattering.
The AGN contribution to the radio-FIR correlation has been studied in the past to some extent. Typically a low FIR/radio ratio, significantly offsetting a galaxy from the correlation, is thought to indicate a radio-loud AGN (e.g. Yun et al., 2001; Condon, Cotton & Broderick, 2002). However, recent studies have shown that optically-selected AGN often follow the correlation, albeit with a slightly lower FIR/radio ratio. For example, based on SDSS-NVSS-IRAS data, Obrić et al. (2006) have demonstrated a tight correlation between radio and 60 m fluxes for low-luminosity AGN (predominantly Seyferts and LINERs), which varies by only relative to that of star forming galaxies. Utilizing 6dFGS-NVSS-IRAS data, Mauch & Sadler (2007) inferred a lower average FIR/radio ratio for AGN-bearing galaxies (Seyferts, LINERs, and quasars), but still within the scatter of the correlation for star forming galaxies. Furthermore, studies of the correlation at higher redshifts have yielded a handful of interesting objects for which it has clearly been shown that a significant AGN contribution to IR and/or radio exists, yet their FIR/radio ratio is consistent with the canonical value for star forming galaxies (Riechers et al. 2009, Murphy et al. 2009).
In order to understand in more detail the contribution of AGN activity to the radio-FIR correlation, we perform an in-depth study of the radio-FIR correlation, with a large sample, as a function of galaxy type, and comparison with star formation rates for those individual samples. The various types of star forming and AGN-bearing galaxies have been drawn from the NVSS (Condon et al., 1998), IRAS (Neugebauer et al., 1984), and SDSS (York et al., 2000) sky surveys. In Sec. 2 we present the data used in this paper. We present the correlation for various types of galaxies in Sec. 3. In Sec. 4 we link the FIR and radio emission from galaxies in our sample to independently derived star formation rates, and in Sec. 5 and Sec. 6 we discuss and summarize our results, respectively. We adopt , , , and define the radio synchrotron spectrum as , assuming . Throughout the text we will often use the term ’quasar’ referring to both quasi-stellar radio sources and quasi-stellar objects.
2. Data and galaxy samples: Expanding the Unified Radio Catalog
2.1. Unified Radio Catalog
Kimball & Ivezić (2008) have constructed a catalog of radio sources detected by the GB6 (6 cm), FIRST (Becker et al., 1995), NVSS (Condon et al. 1998; 20 cm), and WENSS (92 cm) radio surveys, as well as the SDSS (DR6) optical survey (York et al., 2000). This “Unified Radio Catalog” has been generated in such a way that it allows a broad range of 20 cm based sample selections and source analysis (see Kimball & Ivezić 2008 for details). The 2.7 million entries are comprised of the closest three FIRST to NVSS matches (within ) and vice-versa, as well as unmatched sources from each survey. All entries have been supplemented by data from the other radio and optical surveys, where available. Here we select from the Unified Radio Catalog (version 1.1) all 20 cm sources that have been detected by the NVSS radio survey (using and ; see Kimball & Ivezić 2008 for details). This selection yields a radio flux limited ( mJy) sample that contains 1,814,748 galaxies. In the following section we expand this catalog to IR wavelengths, and augment it with additional (spectroscopic and SED-based) information.
2.2. Expanding the Unified Radio Catalog
2.2.1 IRAS
For the purpose of this paper, we have expanded the Unified Radio Catalog to IR wavelengths by cross-correlating it with the IRAS point-source and faint-source catalogs (hereafter PSC and FSC, resp.). The IRAS PSC contains 245,889 confirmed point sources detected at 12, 25, 60 and 100 m, respectively Strauss et al. (1990). The completeness of the catalog at these wavelengths reaches down to 0.4, 0.5, 0.6 and 1.0 Jy, respectively. The FSC was tuned to fainter levels based on the same IR data by point-source filtering the individual detector data streams and then coadding those using a trimmed-average algorithm (see Moshir et al. 1992). The reliability of the FSC is slightly lower than that of the PSC ( compared to 99.997); however its sensitivity is higher by a factor of . The FSC contains 173,044 point sources with flux densities typically greater than 0.2 Jy at 12, 25 and 60 m and 0.5 Jy at 100 m.
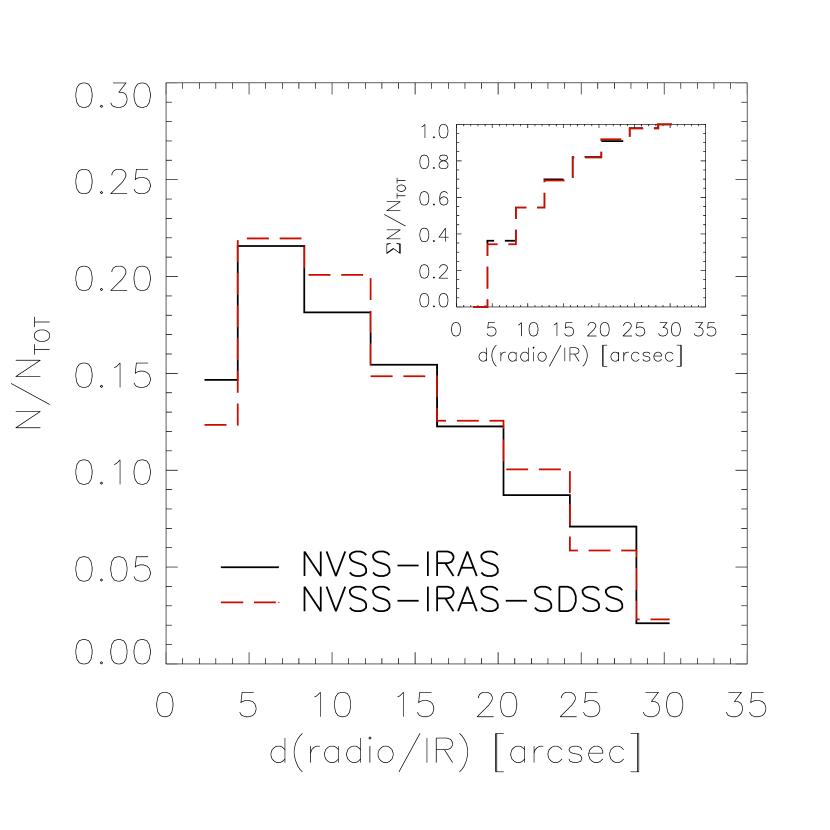
We used matching radius of , as optimized by Obrić et al. (2006), in cross-corelating the Unified Radio Catalog with the IR IRAS data. In Fig. 1 we show the distribution of the distances between the IR and radio detections. The cumulative distribution displayed in Fig. 1 shows that of the positional matches are within an angular distance of .
Our NVSS-selected radio sample contains 18,313 galaxies with high quality IR photometry111We take the IRAS quality indicator, reported in the FSC and PSC, to be at 60 and 100 m (the wavelength bands utilized here). (see Tab. 1). As the FSC and PSC have been generated based on the same data, most of the PSC sources are included in the FSC. In our entire NVSS-IRAS sample, 26% of the sources have a PSC detection but are not included in the FSC. This fraction, however, reduces to only 3% after an optical (SDSS) cross-match is performed.
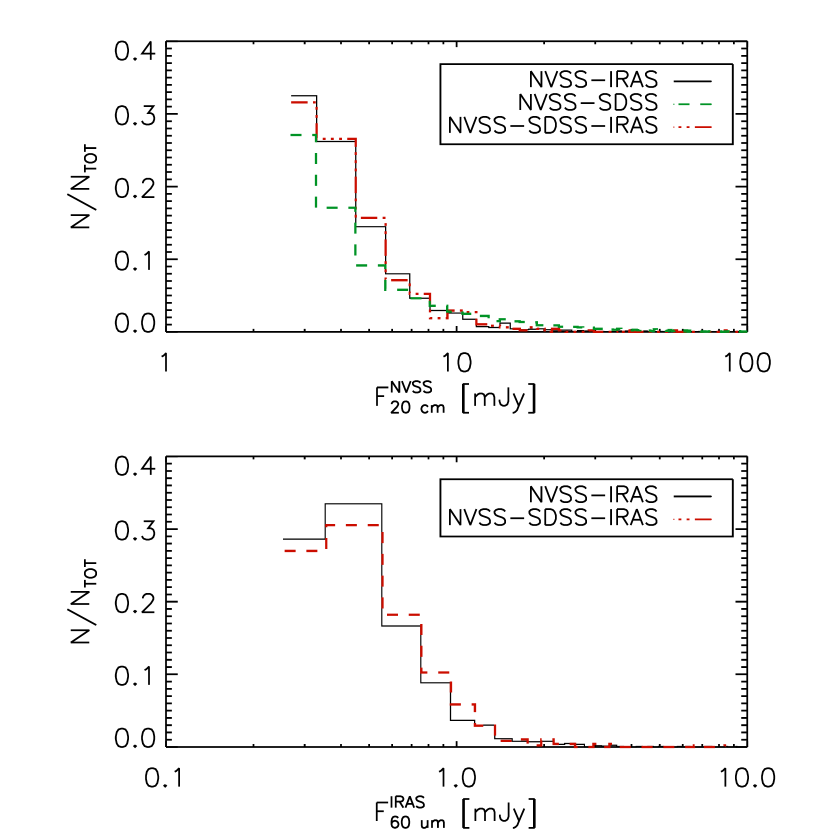
The 60 and 100 m magnitudes reported in the PSC and FSC are in agreement for the union of the two IR samples. The biweighted mean of the flux difference (for a subsample with SDSS detections) is 0.02 and 0.03 Jy at 60 and 100 , respectively. The root mean scatter of the 60 flux difference distribution is 0.06 Jy, while that of the 100 distribution is significantly larger, i.e. 0.16 Jy. Therefore, in order to access the highest quality IR photometry, hereafter we use the values reported in either the FSC or PSC catalog corresponding to the higher photometric quality flag quoted in the catalogs. The distribution of the 60 m and 20 cm flux densities are shown in Fig. 2.
2.2.2 SDSS quasar and main galaxy sample catalogs
We have further matched the NVSS-selected sample from the Unified Radio Catalog with data drawn from i) the SDSS DR5 quasar sample (Schneider et al., 2007), and ii) the DR4 “main” spectroscopic sample for which derivations of emission line fluxes from the SDSS spectra are available (see Smolčić 2009 and references therein; note that the DR5 quasar and DR4 main galaxy catalogs were the most up-to-date versions available at the time). The latter was complemented with stellar masses, star formation rates, dust attenuations, ages, metallicities, and a variety of other parameters based on spectral energy distribution (SED) fitting of the SDSS () photometry using the Bruzual et al. (2003) stellar population synthesis models. The SED fitting was performed as described in detail in Smolčić et al. (2008).
During the inspection of the validity of the final catalog, we have found about 1 of objects with different spectroscopic redshifts in various SDSS data releases (). We have excluded those from the sample. Furthermore, a small number () of duplicate objects was present in both the SDSS “main” galaxy sample and the SDSS Quasar Catalog. Visually inspecting their spectra yielded that most of these objects are better matched to the properties of the “main” galaxy sample (as no power-law continuum nor broad emission-lines were present in the spectrum), and we have excluded these from our quasar sample. A summary of the various radio-IR-optical samples is given in Tab. 1, and in Fig. 3 and Fig. 4 we show the radio (20 cm), optical ( band), and far-IR luminosities as a function of redshift for the final NVSS-SDSS and NVSS-SDSS-IRAS samples (see eqs. 3 and 4). Note that the shallow IRAS sensitivity (compared to the NVSS and SDSS data) significantly reduces the number of objects, and biases the sample toward lower redshifts.
2.3. Radio-optical-IR samples
2.3.1 Star forming and AGN galaxy subsamples
We have used the optical spectroscopic information added to the NVSS selected sample to spectroscopically separate the galaxies present in the SDSS (DR4) “main” galaxy sample as absorption line, AGN (LINER/Seyfert), star forming, or composite galaxies.
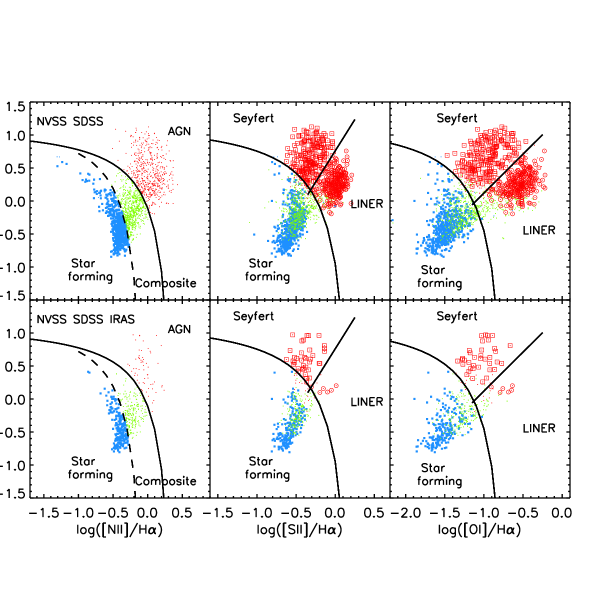
We define emission-line galaxies as those where the relevant emission lines (H, H, O[III,5007], N[II,6584], S[II,6717,6731]) have been detected at , and consider all galaxies with in any of these lines as absorption line systems (see e.g. Best et al. 2005; Kewley et al. 2006; Smolčić et al. 2009). As strong emission lines are not present in the spectra of the latter, yet they are luminous at 20 cm, they can be considered to be (low excitation) AGN (see e.g. Best et al. 2005; Smolčić et al. 2008 for a more detailed discussion). Further, as illustrated in Fig. 5, using standard optical spectroscopic diagnostics (Baldwin, Phillips & Terlevich, 1981; Kauffmann et al., 2003b; Kewley et al., 2001, 2006) we sort the emission-line galaxies into 1) star forming, 2) composite, 3) Seyfert, and 4) LINER galaxies. The last two classes have been selected ‘unambiguously’ by requiring combined criteria using three emission line flux ratios (see middle and right panels in Fig. 5). A summary of the number of objects in each class is given in Tab. 1. It is noteworthy that the IR detection fraction is a strong function of spectral class. It is the lowest for absorption line (0.6%) and LINER (6.5%) galaxies, intermediate for Seyferts (22%) and the highest for composite (40%) and star forming (46%) galaxies. These results suggest lower amounts of dust (and gas; Solomon & Vanden Bout 2005) in the former or alternatively dominantly very cold dust that peaks at longer wavelenghts.
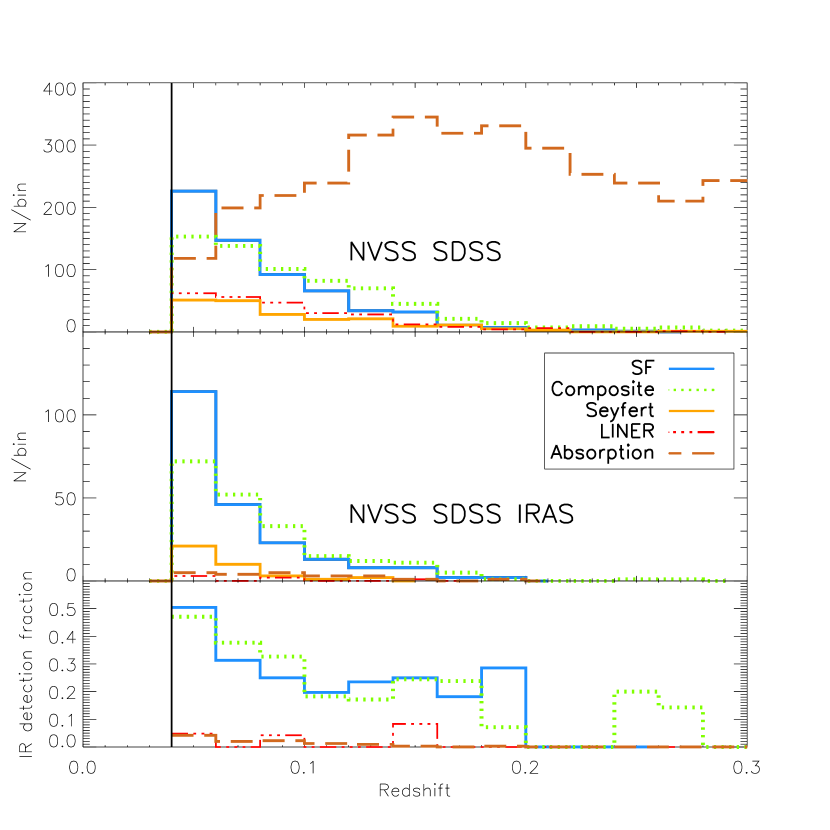
The redshift distribution of the various galaxy types with 20 cm NVSS and NVSS-IRAS detections is shown in the two top panels in Fig. 6. Note that the redshift distribution of 20 cm detected absorption line galaxies is biased toward higher-redshifts, compared to all other galaxy types (see top panel in Fig. 6). However, this is not the case when an IRAS IR detection is required, as illustrated in the middle panel in Fig. 6. The IR detection fraction of the different galaxy classes is shown as a function of redshift in the bottom panel in Fig. 6. Except for the overall trend that absorption and LINER galaxies are detected less efficiently in the IR, there is no substantial difference between the detection fractions as a function of redshift for different types of spectroscopically selected galaxies.
Hereafter, we apply redshift range limits of 0.04 z 0.3 to our sample. The lower redshift limit is adopted from Kewley et al. (2005). Kewley et al. explored effects of fixed-size aperture of the SDSS spectroscopic fibers on the spectral characteristics such as metallicity, star formation rate, and reddening. They concluded that a minimum aperture size covering of spectral light was required to properly approximate global values. The SDSS fiber aperture of diameter collects such a fraction of light for galaxies of average size, type, and luminosity at . The upper redshift limit of is equivalent to that of the SDSS “main” spectroscopic sample (note however that the majority of IR-detected galaxies are at , see Fig. 4). It is worth noting that, because of lower spectral signal-to-noise for fixed-luminosity galaxies at greater distances, galaxies with weak emission lines, such as LINERs, can get confused with absorption line galaxies at (Kewley et al., 2005). However, as LINER and absorption galaxies have similar physical properties, (e.g. Smolčić 2009) we simply combine these two types of galaxies, and treat them hereafter as a single class.
2.3.2 Quasar subsample
Matching the SDSS DR5 quasar catalog to the Unified radio catalog resulted in 4,490 matches (see Tab. 1). The redshift range of our radio luminous quasars is , with a median at . Requiring IRAS detections biases the sample toward low redshifts (), with a median redshift of , and selects only of the radio detected quasars. The radio ( W Hz-1) and FIR () luminosities (see eqs. 3 and 4) of our quasars are systematically higher than those of the SDSS “main” spectroscopic sample galaxies in our radio-optical-IR sample.
3. Quantifying the radio-FIR correlation for various source types
3.1. Parameterizing the radio-FIR correlation
The radio-FIR correlation is usually quantified by its slope via the q parameter (Helou et al., 1985), defined as the logarithmic ratio of the far-infrared flux to radio flux density:
| (1) |
where is the 1.4 GHz radio flux density in units of and is the far-infrared flux in units of . Following Sanders & Mirabel (1996), we define the latter as:
| (2) |
where and are observed flux densities at 60 and 100 (in Jy), respectively.
We compute the far-infrared luminosity as:
| (3) |
where is the luminosity distance (in units of m) and is a scale factor used to correct for the extrapolated flux longward of the IRAS 100 m filter. We use (see Tab. 1 in Sanders & Mirabel 1996). Note that this expression can also be utilized to compute the FIR luminosities for our IR-detected quasars, given their relatively low redshifts.
The radio luminosity density is computed as:
| (4) |
where is the redshift of the source, is its integrated flux density, and the radio spectral index (assuming ). To compute the radio luminosities, we assumed a spectral index of .
3.2. Radio-FIR correlation for all sources
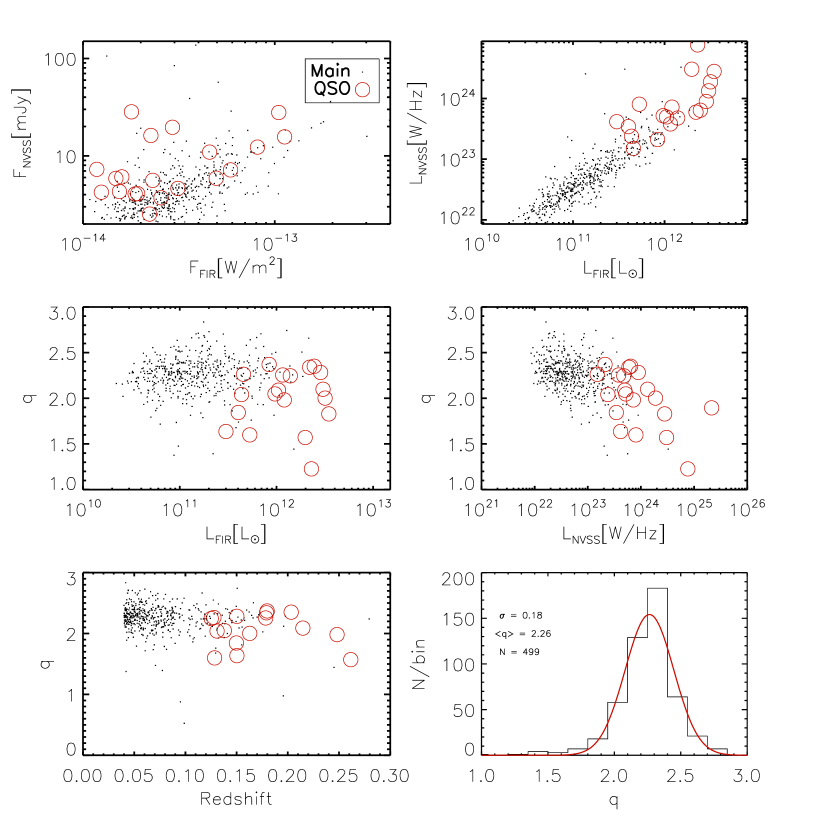
The radio-FIR correlation for the NVSS-SDSS-IRAS sample is summarized in Fig. 7. The radio and FIR flux densities (top left panel) and luminosities (top right panel) clearly show a tight correlation that holds over many orders of magnitude. In the middle panels we show the parameter, that characterizes the slope of the radio-FIR correlation (see eq. 1), as a function of FIR and radio luminosities. The average is constant as a function of FIR luminosity (middle left panel), and it is decreasing with increasing radio power (middle right panel; see also below). In the bottom panels of Fig. 7 we show the parameter as a function of redshift, as well as its distribution for all our NVSS-SDSS-IRAS sources (galaxies and quasars). We find that the average (biweighted mean) value for the entire NVSS-SDSS-IRAS sample is q=2.2730.008, with a root-mean-square scatter of . This is in very good agreement with previous findings (Condon, 1992; Yun et al., 2001; Condon, Cotton & Broderick, 2002; Bell, 2003; Mauch & Sadler, 2007), and will be discussed in more detail in Sec. 5.
The quasars in our sample comprise the high luminosity end at both IR and radio wavelengths (they are also located at higher redshifts, compared to the IR and radio detected “main” galaxy sample). It is also obvious that there is a larger fraction of quasars that do not lie on the radio-IR correlation, compared to that for the “main” sample galaxies.
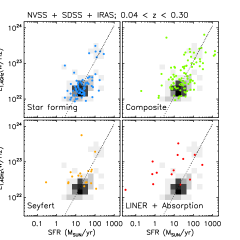
3.3. Radio-FIR correlation for different types of galaxies
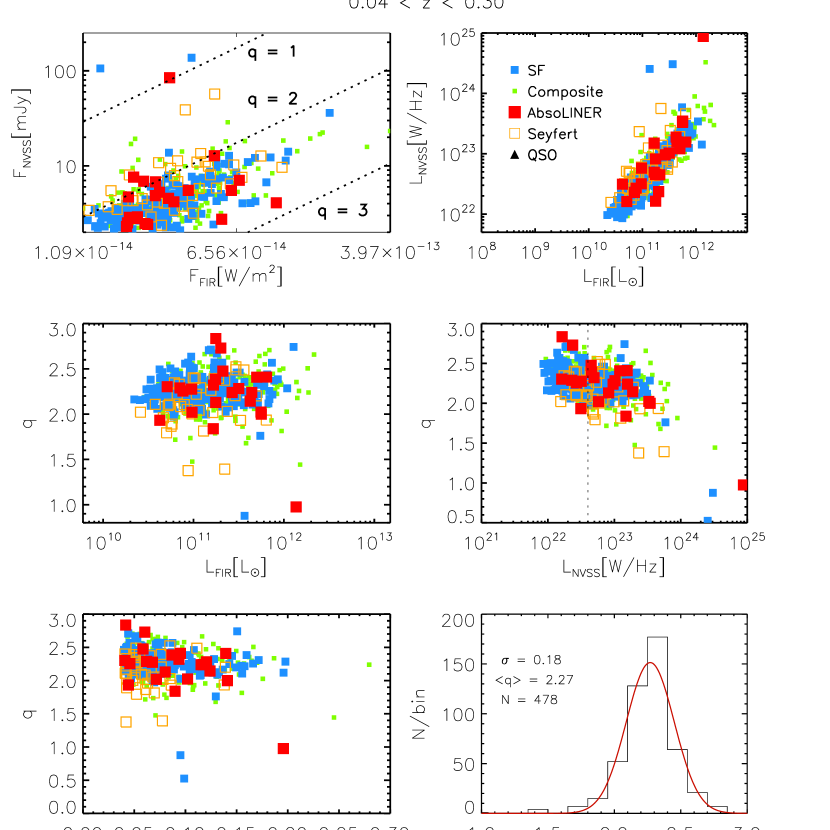
In Fig. 8 we present the radio-FIR correlation for the SDSS “main” galaxy sample subdivided into different, spectroscopically selected galaxy types (absorption, LINER, Seyfert, composite and star forming galaxies; see Sec. 2.3.1 and Fig. 5 for details on the selection). The decrease in with increasing radio power for all types of galaxies (middle right panel) is consistent with various other observations (e.g. Smolčić et al. 2008; Kartaltepe et al. 2010; Sargent et al. 2010, Ivison et al. 2010). Note that, given the definition of the FIR/radio ratio, for any sample in which does not vary with FIR luminosity, and has a non-zero dispersion, it is expected to decrease with increasing radio luminosity (see e.g. Condon 1984). To test whether the magnitude of the decrease is as expected from statistics or e.g. higher due to an additional effect (such as AGN contribution) we have computed the radio luminosity for each source based on its observed FIR luminosity and a FIR/radio ratio drawn from a Gaussian distribution with a dispersion of 0.18 and a mean of 2.27. We find that the decrease of with radio luminosity in the observed data is consitent with that in the simulated data, thus not requiring additional effects (such as increasing AGN contribution with increasing radio power) to explain this trend (at least in the radio luminosity range probed here).
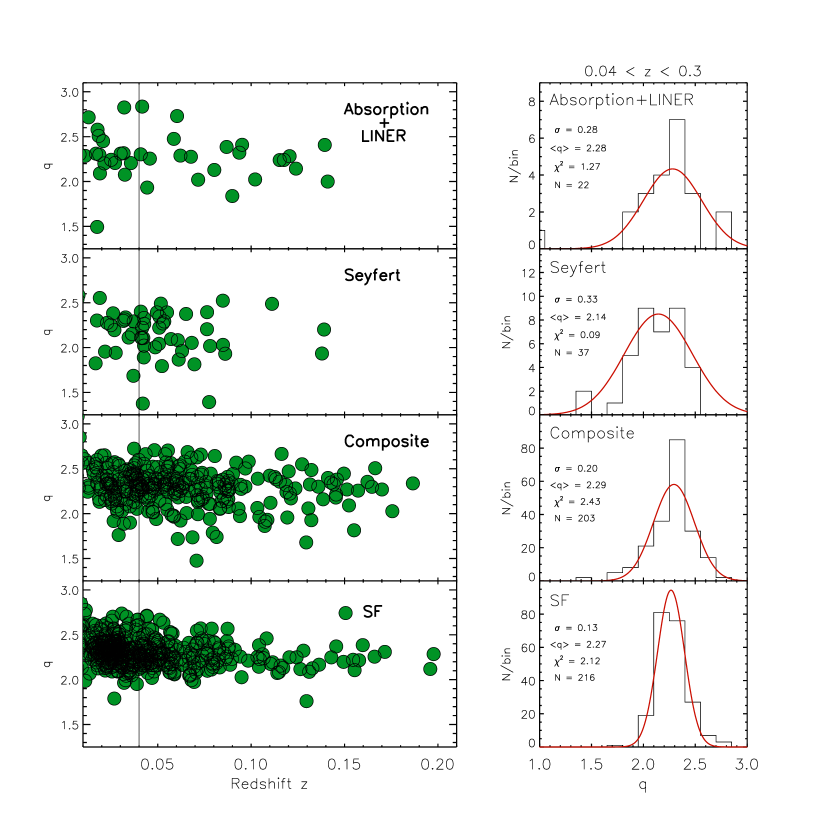
A quantitative analysis of the radio-FIR correlation for different galaxy types is presented in Fig 9. The spectroscopic selection of pure star forming galaxies allows us to quantify the radio-IR correlation in a rather unbiased manner. For our star forming galaxies we find an average value of , with a small root-mean-square scatter of . It is interesting to note that as the AGN contribution rises in galaxies (as inferred based on optical spectroscopic diagnostics) the scatter in increases by to . Interestingly, the scatter is the highest for Seyfert types of galaxies, for which we also find the lowest average value, . These differences will further be discussed in Sec. 5.
3.4. Radio-FIR correlation for quasars
In Fig. 10 we quantify the radio-FIR correlation for the 21 IR-detected quasars in our sample. The distribution of the FIR/radio ratio cannot be well fit with a Gaussian distribution. The median value of the sample is 2.04, comparable to the average value we have found for Seyfert galaxies (2.14), and lower than that for star forming galaxies (2.27; see Fig. 9). It is worth noting that the higher redshift quasars () appear to be biased toward more radio-loud AGN.
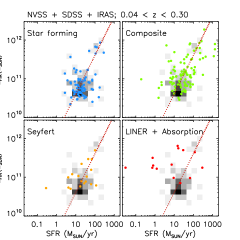
4. An independent view of the radio-FIR correlation: A link to star formation
It is generally taken that recent star formation drives both the radio and FIR emission of galaxies that lie on the radio-FIR correlation (Condon, 1992; Mauch & Sadler, 2007). Therefore, a correlation is expected to be present between the SFRs and radio/FIR luminosities obtained from the fluxes of galaxies dominated by recent star formation. To shed light on the source of radio/FIR emission in our galaxies, in this section we investigate the correlation between their radio/FIR luminosities and star formation rates, independently determined based on fitting stellar population synthesis models to the NUV-NIR SED).
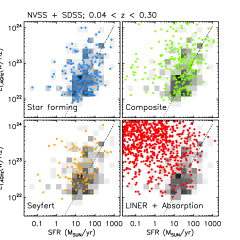
We have derived a star formation rate for every galaxy in our sample by fitting the Bruzual et al. (2003) library of stellar population synthesis models to the SDSS photometry (see Sec. 2). In Fig. 11 we show the radio and FIR luminosities of our sources as a function of our SED-based SFRs. As expected, a correlation is discernible between these two quantities. This is especially emphasized for star formation dominated galaxies (i.e. star forming and composite galaxies), the distribution of which agrees well with the commonly used radio/IR luminosity – SFR calibrations (Kennicutt, 1998; Yun et al., 2001). Note that this is quite remarkable as the SFRs have been derived completely independently from the FIR or radio emissions in the galaxies.
From Fig. 11 it is obvious that a large fraction of galaxies with significant AGN contribution (Seyfert, LINER and absorption galaxies) has an obvious excess of radio power and FIR luminosity compared to that expected from the galaxy’s SFR. The most obvious example of this are the LINER and absorption galaxies from both the NVSS-SDSS and NVSS-SDSS-IRAS samples.
To investigate whether star formation is the underlying source of radio/FIR emission in our galaxies, we further quantify the difference between the radio/FIR emission and that expected from star formation. We thus define an “excess” in radio/FIR emission relative to that expected from star formation ( and , resp.) as:
| (5) |
where is the logarithm of the 1.4 GHz or FIR luminosity derived based on NVSS or IRAS data (see Sec. 2), and is the luminosity (either at 1.4 GHz or FIR) expected based on the SED-derived SFR and the standard radio and FIR luminosity to SFR calibrations. To convert SFR to radio luminosity we use the calibration defined in Yun et al. (2001): [W/Hz]. To convert SFR to FIR luminosity we use the standard conversion defined by Kennicutt (1998): [W]. Prior to applying these conversions, derived using a Salpeter IMF, we have scaled our SED-based SFRs by -0.2 dex to convert from a Chabrier to a Salpeter IMF (we have additionally included a scaling factor of dex to account for the star formation histories used in our models; see Smolčić et al. 2008 and Walcher et al. 2008 for details).
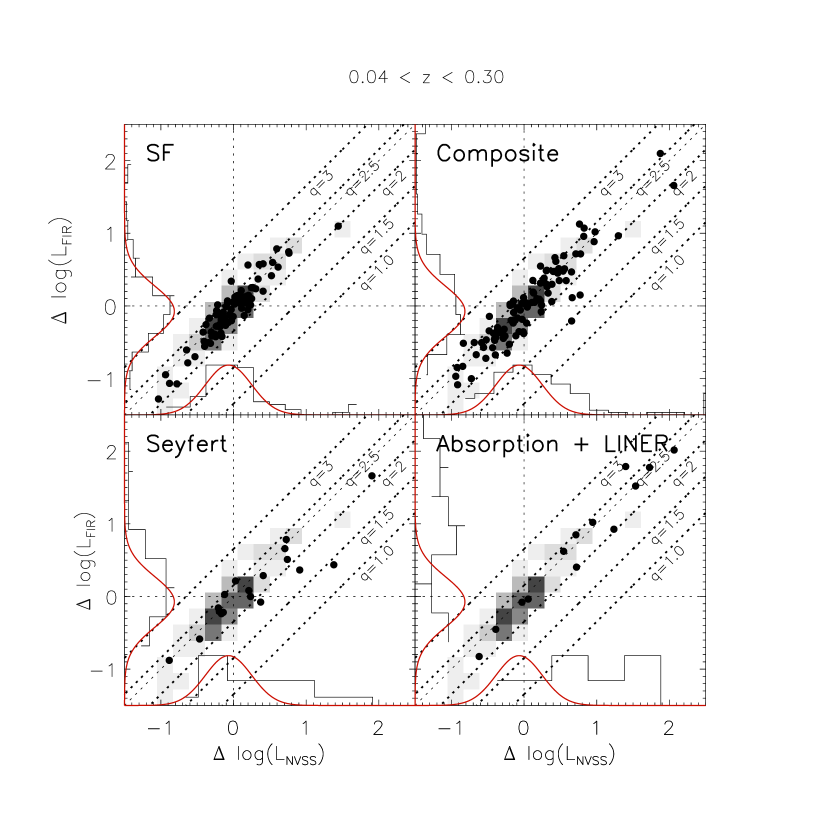
Fig. 12 shows the FIR () versus 1.4 GHz () luminosity excess for different types of galaxies in the NVSS-SDSS-IRAS sample. As expected, star forming galaxies follow a normal distribution in both the FIR and radio luminosity excess, with a mean value of about zero (, ). The root-mean-square scatter is , and for the FIR and radio distributions, respectively. Assuming the validity of the SFR to radio/FIR luminosity calibrations, such a (normal) distribution is expected if FIR and radio emissions arise from star formation processes in the galaxies. From Fig. 12 it is apparent that, as the AGN contribution (defined via optical spectroscopic emission line properties) rises in galaxies, the distribution of both the FIR and radio luminosity excess becomes highly skewed towards higher values. Although for a fraction of optically selected AGN it is possible that the AGN contribution to the radio/FIR may be weak (), and they may be overwhelmed by star formation (which results in the canonical FIR/radio ratio), the significant skewness of the distributions suggests an additional source of radio and FIR emission in AGN bearing galaxies (at least for ). Even more interesting is that galaxies with large luminosity excess in both FIR and radio emission () predominantly have FIR/radio ratios consistent with the mean value for star forming galaxies (see Fig. 12). This will be discussed in more detail in Sec. 5.
5. Discussion
5.1. Comparison with previous results
Extensive studies of the radio-FIR correlation (e.g. Helou et al., 1985; Condon, 1992; Yun et al., 2001; Condon, Cotton & Broderick, 2002; Obrić et al., 2006; Mauch & Sadler, 2007) have led to an average FIR/radio ratio in the local () universe of , and lower for AGN-bearing galaxies (see Tab. 2 in Sargent et al. 2010 for a summary). For example, using the IRAS 2 Jy galaxy sample ( Jy; 1809 sources with optical counterparts and well determined redshifts) combined with NVSS data, Yun et al. (2001) have found . A lower average value is generally inferred when using radio selected samples, and reaching fainter in the IR (see Sargent et al. 2010 for a detailed discussion of selection effects). Combining NVSS data with the optical Uppsala Galaxy Catalog (UGC) and the IRAS FSC and PSC, Condon, Cotton & Broderick (2002) have found and rms width . Furthermore, matching NVSS and 6dFGS survey data only with the IRAS FSC, Mauch & Sadler (2007) inferred a mean value of 2.28 with a root-mean-square scatter of 0.22 for their entire sample. For a subset of radio-loud AGN (that would correspond to our Seyfert, LINER, absorption, and quasar classes combined) they found an even lower average value, , and a sigificantly higher scatter in the FIR/radio ratio ().
In Fig. 9 we have presented the distribution of for various types of our spectroscopically selected NVSS-SDSS-IRAS (PSC+FSC) galaxies. Our results yield that the dispersion is the tightest for star forming galaxies (), and rises by a factor of 1.5, 2.5, and 2.2 for composite, Seyfert and absorption/LINER galaxies, respectively. We find that the average FIR/radio ratio for all objects in our radio-optical-IR sample is with a dispersion of . This is in very good agreement with the results from Mauch & Sadler (2007). Furthermore, if we limit the 60 µm fluxes of our full sample to Jy we obtain an average value of 2.34, consistent with that inferred by Yun et al. (2001).
Our results yield a lower FIR/radio ratio () for Seyfert galaxies, and a significantly higher root-mean-square-scatter (), compared to that found for SF galaxies. It is interesting that the mean value for our IR-detected LINER and absorption line galaxies is comparable to that for star forming galaxies. However, the spread in for the former is significantly larger than for the latter (0.28 compared to 0.13, respectively). The average FIR/radio ratio for the 21 quasars in our sample is , comparable to that inferred for Seyferts and lower than that for star forming galaxies. If we combine our AGN-bearing galaxies (quasars, Seyferts, LINERs, absorption galaxies) into one class in order to match the AGN sample of Mauch & Sadler (2007), we infer an average of (with a root-mean-square scatter of ). This is in relatively good agreement with their results. In the next sections we will discuss the variation of with radio luminosity and the AGN contribution to the radio-FIR correlation.
5.2. AGN contribution to the radio-FIR correlation
A low value is often used to discriminate between star forming galaxies and AGN. For example Condon, Cotton & Broderick (2002) have classified radio-loud AGN as those having q 1.8. Assuming that the FIR emission arises solely from star formation, this criterion selects galaxies with more than 3 times the radio emission from galaxies on the FIR-radio correlation. Yun et al. (2001) have used as a star formation/AGN separator, identifying galaxies that emit in radio more than 5 times than predicted by the correlation. It is important to point out that these discriminating values are tuned to select only the most radio-loud AGN. Having i) separated our NVSS-SDSS-IRAS sample into various classes of AGN, and ii) independently estimated SFRs in their host galaxies, we can now analyze the physical source of FIR and radio emission in galaxies both following and offset from the radio-FIR correlation.
Assuming that the additional source of FIR and radio emission (relative to that expected from star formation) observed in our composite, Seyfert, absorption and LINER galaxies (see Fig. 12 ) arises from the central supermassive black hole, the distribution of our luminosity excess, defined in eq. 5, allows us to constrain the average contribution of star formation and AGN activity to the total power output for a given galaxy population. Taking that star formation and AGN activity are the two dominant FIR/radio emission generators, i.e. , the average fractional contributions of these two sources (, and ) to the total power output can then be computed as , and , where denotes the average (median) of the distribution (see Fig. 12).
The median values, and the fractional star formation/AGN contributions are summarized in Tab. 3. As expected, for star forming galaxies we infer that the average contribution to FIR and radio emission due to star formation is . We find that composite objects are dominated by star formation at the level. Further, the FIR emission from Seyfert galaxies arises predominantly from star formation (), while the AGN contribution to radio luminosity in Seyfert galaxies is about a factor of two higher in the radio than in the FIR (see Tab. 3). The latter explains the lower average value (compared to the nominal value) for Seyfert galaxies inferred here, as well as in e.g. Obrić et al. (2006), Mauch & Sadler (2007). Lastly, based on the above calculation IR detected absorption and LINER galaxies are on average strongly dominated by AGN activity () in both their FIR and radio emission although their average FIR/radio ratio is consistent with that expected for star forming galaxies (see Fig. 12).
One of the main results of this work is that, for the large majority of galaxies with radio and/or IR emission excess, we infer values consistent with the average FIR/radio ratio found for star forming galaxies (see Fig. 12). Thus, although a significant AGN contribution is likely present in these galaxies (adding both to the FIR and radio emission), they would not be identified with a simple low-q discriminator value, as is commonly used to select radio-loud AGN. Our results indicate that the FIR/radio ratio is not particularly sensitive to AGN contribution and that the radio-FIR correlation is a poor discriminant of AGN activity, except for the most powerful AGN. This is consistent with observations of several AGN-bearing galaxies in the high-redshift universe.
Based on an SED analysis, Riechers et al. (2009) find that both the radio and FIR luminosity in the z=3.9 quasar APM08279+5255 are dominated by the central AGN, but that it has a value consistent with the local radio-FIR correlation. Furthermore, Murphy et al. (2009) have analyzed Spitzer-IRS spectra of a sample of 22 galaxies, composed of submillimeter galaxies, as well as X-ray and optically selected AGN in GOODS-N. Making use of their IRS spectra, they have performed a thorough starburst-AGN decomposition for each object which allowed them to estimate the fractional AGN contribution to the total IR luminosity output of each source. They demonstrate that the 4 galaxies having the largest mid-IR AGN fractions () in their sample have values consistent with the canonical value. Furthermore, they find that the FIR/radio ratio shows no trend with the fractional contribution of AGN activity in the galaxies in the IR, consistent with our results.
6. Summary and conclusions
Based on a new radio-optical-IR catalog we have separated our radio (NVSS) and IR (IRAS) detected SDSS galaxies () into star forming, composite, Seyfert, LINER, absorption line galaxies and quasars, and we have performed an in-depth analysis of the radio-FIR correlation for various types of star forming and AGN-bearing galaxies. Utilizing our NUV-NIR SED based star formation rates in combination with FIR and radio luminosity (expected to directly trace star formation), we have statistically quantified the source of radio and FIR emission in the galaxies in our sample. We find that Seyfert galaxies and quasars have FIR/radio ratios lower than the canonical value for star forming galaxies. This is due to an additional contribution to their radio continuum emission, which likely arises from their AGN. We further show that FIR-detected absorption and LINER galaxies are on average strongly dominated by AGN activity in both their FIR and radio emission; however their average FIR/radio ratio is consistent with that expected for star forming galaxies. In summary, our results imply that most AGN-containing galaxies in our sample have FIR/radio flux ratios indistinguishable from those of the star-forming galaxies. Thus, attempts to separate AGNs from star-forming galaxies by their FIR/radio flux ratios alone is a poor discriminant of AGN activity, except for the most powerful radio-loud AGN.
References
- Appleton et al. (2004) Appleton, P. N., 2004, ApJS, 154, 147
- Baldwin, Phillips & Terlevich (1981) Baldwin, J. A., Phillips, M. M., & Terlevich, R. 1981, PASP, 93, 5
- Becker et al. (1995) Becker, R. H., 1995, ApJ, 450, 559
- Bell (2003) Bell, E. F., 2003, ApJ, 586, 794
- Bell et al. (2004a) Bell, E. F., et al. 2004a, ApJ, 608, 752
- Bell et al. (2004b) Bell, E. F., et al. 2004b, ApJ, 600, L11
- Best et al. (2005) Best, P. N., Kauffmann, G., Heckman, T. M., & Ivezić, Ž. 2005, MNRAS, 362, 9
- Blain et al. (1999) Blain, A. W., Smail, I., Ivison, R. J., Kneib, J.-P., 1999, MNRAS, 302, 632
- Borch et al. (2006) Borch, A., et al. 2006, A&A, 453, 869
- Bower et al. (2006) Bower, R. G., Benson, A. J., Malbon, R., Helly, J. C., Frenk, C. S., Baugh, C. M., Cole, S., Lacey, C. G. 2006, MNRAS, 370, 645
- Bressan et al. (2002) Bressan, A., Silva L., Granato G. L., 2002, AA, 392, 377
- Brown et al. (2007) Brown, M. J. I., Dey, A., Jannuzi, B. T., Brand, K., Benson, A. J., Brodwin, M., Croton, D. J., Eisenhardt, P. R. 2007, ApJ, 654, 858
- Bruzual et al. (2003) Bruzual G., Charlot S., 2003, MNRAS, 344, 1000
- Buttiglione et al. (2009) Buttiglione, S., Capetti, A., Celotti, A., Axon, D. J., Chiaberge, M., Duccio Macchetto, F., & Sparks, W. B. 2009, arXiv:0901.1764
- Carilli & Yun (1999) Carilli, C. L. & Yun, M. S. 2000, ApJ, 513, L13
- Carilli & Yun (2000) Carilli, C. L. & Yun, M. S. 2000, ApJ, 530, 618
- Chapman et al. (2005) Chapman, S. C., Blain, A. W., Smail, I., Ivison, R. J. 2005, ApJ, 622, 772
- Condon et al. (1982) Condon, J. J., Condon, M. A., Gisler, G., Puschell, J. 1982, ApJ, 252, 102
- Condon (1992) Condon, J. J. 1992, ARA&A, 30, 575
- Condon et al. (1993) Condon J. J., Helou G., Sanders D. B., Soifer B. T. 1993, AJ, 105, 1730
- Condon et al. (1998) Condon J. J., Cotton W. D., Greisen E. W., Yin Q. F., Perley R. A., Taylor G. B., Broderick J. J. 1998, AJ, 115, 1693
- Condon, Cotton & Broderick (2002) Condon, J. J., Cotton, W. D., Broderick J. J. 2002, ApJ, 124, 675
- Condon, Helou & Jarrett (2002) Condon, J. J., Helou, G., Jarrett T. H. 2002, ApJ, 123, 1881
- Crutcher (1999) Crutcher, R. M. 1999, ApJ, 520, 706
- Dickey & Salpeter (1984) Dickey, J. M., Salpeter, E. E. 1984, ApJ, 284, 461
- de Cea del Pozo et al. (2009) de Cea del Pozo, E. et al. 2009, 2009arXiv0912.3497D
- de Jong et al. (1985) de Jong, T., Klein, U., Wielebinski, R., Wunderlich, E., 1985, A&A, 147, L6
- Donley et al. (2005) Donley J. L., Rieke G. H., Rigby J. R., Perez-Gonzalez P. G., 2005, ApJ, 634, 169
- Dorfi E. A. (2000) Dorfi, E. A., 2000, Ap&SS, 272, 227
- Drake et al. (2003) Drake C. L., McGregor P. J., Dopita M. A., van Breugel W. J. M., 2003, AJ, 126, 2237
- Dunne et al. (2000) Dunne, L., Clements, D. L., Eales, S. A., 2000, MNRAS, 319, 813
- Evans et al. (2006) Evans, D. A., Worrall, D. M., Hardcastle, M. J., Kraft, R. P., & Birkinshaw, M. 2006, ApJ, 642, 96
- Faber et al. (2007) Faber, S. M., et al. 2007, ApJ, 665, 265
- Garrett (2002) Garrett, M. A. 2002, AA, 384, L19
- Hardcastle et al. (2006) Hardcastle, M. J., Evans, D. A., & Croston, J. H. 2006, MNRAS, 370, 1893
- Hardcastle et al. (2007) Hardcastle, M. J., Evans, D. A., & Croston, J. H. 2007, MNRAS, 376, 1849
- Haarsma et al. (2000) Haarsma, D. B., Partridge, R. B., Windhorst, R. A., Richards, E. A. 2000, ApJ, 544, 641
- Hauser & Dwek (2001) Hauser, M. & Dwek, E. 2001, ARA&A, 39, 249
- Heckman et al. (2004) Heckman, T. M., Kauffmann, G., Brinchmann, J., Charlot, S., Tremonti, C., & White, S. D. M. 2004, ApJ, 613, 109
- Helou et al. (1985) Helou, G., Soifer, B. T., Rowan-Robinson, M. 1985, ApJ, 298, L7
- Ho (2005) Ho, L. C. 2005, Ap&SS, 300, 219
- Hopkins et al. (2006) Hopkins, P. F., et al. 2006, ApJS, 163, 1
- Hopkins et al. (2007) Hopkins, P. F., Bundy, K., Hernquist, L., Ellis, R. S. 2007, ApJ, 659, 976
- Ivison et al. (2010) Ivison, R. J., et al. 2010, MNRAS, 402, 245
- Kauffmann et al. (2003a) Kauffmann, G. et al., 2003, MNRAS, 341, 33
- Kauffmann et al. (2003b) Kauffmann, G. et al. 2003, MNRAS, 346, 1055
- Kauffmann et al. (2008) Kauffmann, G., Heckman, T. M., Best, P. N. 2008, MNRAS, 384, 953
- Kennicutt (1998) Kennicutt, R., 1998, ARA&A, 36, 189
- Kewley et al. (2001) Kewley, L. J., Dopita, M. A., Sutherland, R. S., Heisler, C. A., Trevena, J. 2001, ApJ, 556, 121
- Kewley et al. (2005) Kewley, L. J., Jansen, R. A., Geller, M. J., 2005, PASP, 117, 227
- Kewley et al. (2006) Kewley, L. J., Groves, B., Kauffmann, G., Heckman, T., 2006, MNRAS, 372, 961
- Kimball & Ivezić (2008) Kimball, A. E., & Ivezić, Ž. 2008, AJ, 136, 684
- Kovacs et al. (2006) Kovacs, S. C. et al., 2006, ApJ, 650, 592
- Ibar et al. (2008) Ibar, E. et al., 2008, MNRAS, 386, 953
- Ivison et al. (2010) Ivison, R. J. et al., 2010, MNRAS, 402, 245
- Lacki, Thomson & Quataert (2009) Lacki, B. C., Thompson, T. A., Quataert, E. 2009, arXiv:0907.4161
- Lacki, Thomson & Quataert (2009b) Lacki, B. C., Thompson, T. A., Quataert, E. 2009, arXiv:0910.0478L
- Lonsdale, Farrah & Smith (2006) Lonsdale, C. J., Farrah, D., Smith, H. E. 2006, Astrophysics Update 2, 285
- Mauch & Sadler (2007) Mauch, T. & Sadler, E. M. 1992, MNRAS, 375, 931
- Miller & Owen (2001) Miller, N. A., & Owen, F. N. 2001, ApJ, 121, 1903
- Moshir et al. (1992) Moshir et al., 1992, Explanatory Supplement to the IRAS Faint Source Survey, Version 2 (JPL D-10015; Pasadena: Jet Propulsion Laboratory) (FSC)
- Murphy et al. (2008) Murphy, E.J., Helou, G., Kenney, J.D.P., Armus, L., Braun, R., 2008, ApJ, 678, 828
- Murphy et al. (2009) Murphy, E. J. et al. 2009, ApJ, 706, 482
- Nardini et al. (2010) Nardini, E., Risaliti, G., Watabe, Y., Salvati, M., Sani, E. 2010, arXiv:1003.0858
- Neugebauer et al. (1984) Neugebauer, G., Habing, H. J., van Duinen, R., et al. 1984, ApJL 278, L1–L6, The Infrared Astronomical Satellite (IRAS) mission.
- Obrić et al. (2006) Obrić, M. et al. 2006, MNRAS, 370, 1677
- Park et al. (2008) Park, S. Q., Barmby, P., Fazio, G. G., Nandra, K., Laird, E. S., Georgakakis, A., Rosario, D., Willner, S. P., Rieke, G. H., Ashby, M. L. N., Ivison, R. J., Coil, A. L., Miyazaki, S., 2008, ApJ, 678, 744
- Price & Duric (1992) Price, R. & Duric, N. 1992, ApJ, 401, 81
- Riechers et al. (2009) Riechers, D. A., Walter, F., Carilli, C. L., & Lewis, G. F. 2009, ApJ, 690, 463
- Rieke & Low (1972) Rieke, G. H., & Low, F. J., 1972, ApJ, 177, 115
- Sajina et al. (2008) Sajina et al. 2008, ApJ, 683, 659
- Sanders & Mirabel (1985) Sanders, D. B., & Mirabel, I. F. 1985, ApJ, 298, L31
- Sanders & Mirabel (1996) Sanders, D. B., & Mirabel, I. F. 1996, ARA&A, 34, 749
- Sanders (1999) Sanders, D. B. 1999, IAUS 194, Activity in Galaxies and Related Phenomena, p25
- Sanders (2003) Sanders, D. B. 2003, Journal of Korean Astronomical Society, 36, 149
- Sargent et al. (2010) Sargent, M. T. 2010, ApJS, 186, 341
- Schneider et al. (2007) Schneider, D. P. 2007, AJ, 134, 102
- Seymour et al. (2009) Seymour, N., Huynh, M., Dwelly, T., Symeonidis, M., Hopkins, A., McHardy, I. M., Page, M. J., Rieke, G. 2009, MNRAS, 1077
- Sijacki & Springel (2006) Sijacki, D., & Springel, V. 2006, MNRAS, 366, 397
- Sijacki et al. (2007) Sijacki, D., Springel, V., di Matteo, T., & Hernquist, L. 2007, MNRAS, 380, 877
- Silva & Danese (1998) Silva, L., & Danese, L. 1998, ApJ, 509, 103
- Smolčić et al. (2008) Smolčić, V., et al. 2008, ApJS, 177, 14
- Smolčić et al. (2009) Smolcic, V., et al. 2009, arXiv:0901.3372
- Solomon & Vanden Bout (2005) Solomon P. M., Vanden Bout P. A., 2005, ARA&A, 43, 677
- Strauss et al. (1990) Strauss, M. A., Davis M., Yahil A., Huchra J. P., 1990, ApJ, 361, 49
- Thompson et al. (2006) Thompson T. A., Quataert E., Waxman E., Murray N., Martin C. L., 2006, ApJ, 645, 186
- Tran et al. (2001) Tran, Q. D., 2001, ApJ, 552, 527
- Tremaine et al. (2002) Tremaine, S., et al. 2002, ApJ, 574, 740
- van der Kruit, (1971) van der Kruit, P.C. 1971, A&AS, 15, 110
- Veilleux S., Kim D.C., Sanders D. B (1999) Veilleux S., Kim D.C., Sanders D. B 1999, ApJ, 522, 113
- Vlahakis et al. (2008) Vlahakis, C., Eales S. & Dunne, L. 2008, MNRAS, 379, 1042
- Volk, (1989) Volk, H. J., 1989, A&A, 218, 67
- Vlemmings, (2006) Vlemmings, W. H. T., Diamond P. J., van Langevelde H. J., Torrelles J. M., 2006, A&A, 448, 597
- Wunderlich et al. (1987) Wunderlich E., Klein U., Wielebinski R. 1987, AAS, 69, 487
- White & Rees (1978) White, S. D. M., & Rees, M. J. 1978, MNRAS, 183, 341
- White & Frenk (1991) White, S. D. M., & Frenk, C. S. 1991, ApJ, 379, 52
- York et al. (2000) York, D. G. et al., 2000, AJ, 120, 1579
- Yun et al. (2001) Yun, M. S., Reddy N. A. & Condon, J. J. 2001, ApJ, 554, 803
| IRAS (FSC + PSC) | SDSS (MAIN + QUASAR) | IRAS - SDSS | |
|---|---|---|---|
| total radio sample | 18313 | 9591 | 524 |
| Quasars | – | 4490 | 21 |
| Absorption | – | 3072 | 16 |
| Composite | – | 654 | 203 |
| SF unambiguous | – | 621 | 216 |
| SF ambiguous | – | 9 | 0 |
| AGN unambiguous | – | 454 | 43 |
| AGN ambiguous | – | 291 | 25 |
| Seyfert unambiguous | – | 200 | 37 |
| LINER unambiguous | – | 254 | 6 |
| RADIO | FIR | |||
|---|---|---|---|---|
| SF | AGN | SF | AGN | |
| SF | 100% | 0% | 100% | 0% |
| Composite | 81.3% | 18.7% | 90.7% | 9.3% |
| Seyfert | 56.8% | 43.2% | 76.1% | 23.9% |
| Abso+LINER | 11.3% | 88.7% | 12.8% | 87.2% |