The radiative characteristics of quantum-well active region of lasers with separate-confinement heterostructure (SCH)
Abstract
Computer simulations with Synopsys’ Sentaurus TCAD are used to study the effect of the molar concentration of aluminum in the active and waveguide regions on the energy spectrum of carriers in Quantum Well (QW) and the optical spectral characteristics of radiation of semiconductor lasers with double heterostructures and separate confinement (SCH). Wavelength of single-mode lasers is shown to be almost independent of the concentration of aluminum in the waveguide, in a wide range of aluminum content, but to depend mainly on Al concentrations in QW region.
Introduction
Currently, semiconductor lasers are used in CD/DVD readers/burners, telecommunication systems, precision measurement of displacement and high-resolution spectroscopy, for pumping solid state lasers, as well as in areas related to materials processing (cutting, microwelding) and medicine (laser surgery, dermatology). Since 1990, virtually all designs of lasers, in fact, are injection lasers with double heterostructure and separate confinement (SCH) [1], [2].
In SCH lasers electronic transitions and photons generation are localized in the most narrow-band part - a quantum well (QW), whose width can reach several tens of angstroms, and an optical waveguide is a region of width about 1 . This separate confinement of electronic and optical excitations can significantly lower the threshold current density of laser generation and increase the power of semiconductor lasers operating in at room temperature.
Due to the relative simplicity and perfection of technology of the most commonly now used SCH lasers, solid solutions of are used as wide-gap semiconductors. Reaching the threshold current density of these lasers less than at room temperature has opened up prospects for their practical application and served as a turning point in their production. However, further progress in this direction is associated with optimizing the design of laser diodes and, in particular, with the choice of the QW width and the values of the molar concentration of aluminum in the QW and waveguide regions.
In this paper, computer simulation of the influence of the molar concentration of aluminum in the QW and the waveguide region on the energy spectrum of charge carriers in the QW and on the spectral characteristics is performed. Wavelengths of a single-mode lasers are calculated. It is shown that these wavelengths are almost independent of concentration in the waveguide itself but are determined, primarily, by the concentration in the QW region.
The structure of SCH lasers we are studying consists of layer as an n-type emitter of thickness 1.5 , with doping concentration of , waveguide of of thickness with n-type doping concentration of , an active laser region of of thickness or with n-type doping concentration of , again waveguide of of thickness with n-type doping concentration of , and a layer of as a p-type emitter of thickness 1.5 , with p-type doping concentration of .
An important aspect of using solid solutions is that this compound has two conduction-band minima. At , a direct transition between conduction and valance bands dominates, while for higher concentrations, an indirect transitions for a , with electron wave-vector shifted in direction, , are energetically favorable. An approximation that is used in Sentaurus TCAD for concentration dependence of energy gap at has the form:
| (1) |
The energy spectrum of carriers in the QW SCH lasers
Emission of semiconductor SCH lasers is determined by interband transitions of electrons in the QW. Consequently, to determine the spectral characteristics of laser radiation it is important to know the energy spectrum of carriers in the QW.
Due to the specific structure of heterojunctions, this spectrum, as well as the wave functions describing the state of the carriers in the QW, can be found in the approximation of a rectangular potential well , on the basis of the stationary Schrödinger equation [3]:
| (2) |
where , is Planck’s constant, is effective mass (since the quantum well has different material properties than the waveguide, depends on the coordinate , the axis assumed here to be directed perpendicular to the QW layer), and is energy of carriers relative to the bottom of quantum well.
Eigenstates of (2) could be found analytically [3]. They are in the form of symmetric and anti-symmetric stationary wave functions. The number of states in QW is limited and depends on QW width and its potential depth, which we will call conduction band and valance band offsets, for electrons and holes, correspondingly, as well it depends on effective masses of charge carriers.
We choose to conduct simulation in a commercial software package Sentaurus TCAD of Synopsys [4], and to find energy of states from there. In practice, these energy levels are found in Sentaurus’ sdevice log files, which are plain text files and can be easy parsed by using custom written Perl222PERL is ”Practical Extraction and Report Language”, www.perl.org scripts.
We simulated operation of lasers with quantum well width equal to , , , and , and various contents of aluminum in the active region and in the waveguide. It was assumed that the effective masses of electrons () and heavy () and light () holes, expressed in units of the rest mass of electron, varies linearly with molar concentration of alumina in [4], and the temperature is . We have than, as a good approximation:
, , and .
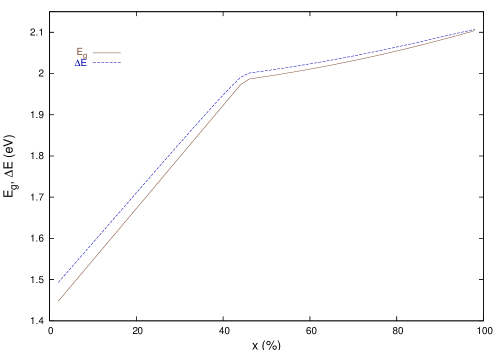
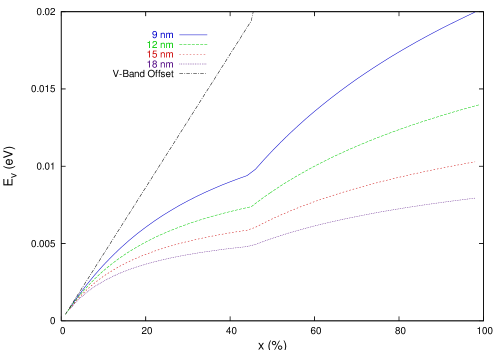
The results of the simulation are presented in Figure 1, which illustrates the difference between energy gap in QW, and which is given by , with being the first conduction band electron state energy in QW, and is the first (closest to the top of valance band) energy level for heavy holes. An abrupt change in and in , from a linear one to parabolic at is explained by Eq. (1); the main contribution to is from as well.
In next figures we show selected examples of more detailed results.
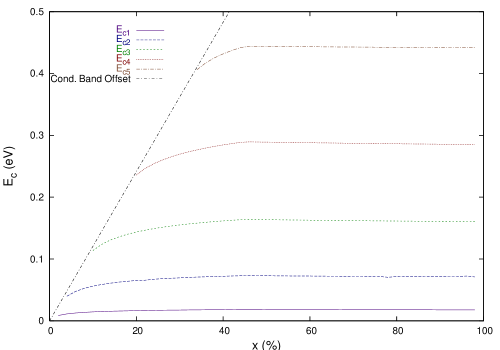
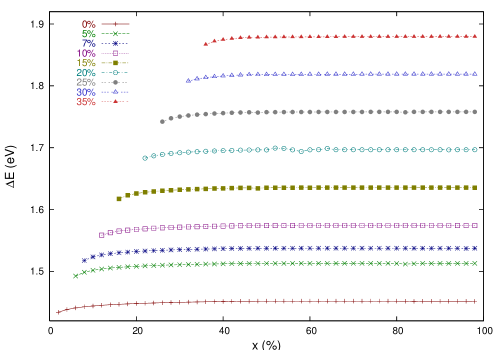
Hence, Figure 2 presents typical results for conduction band energy levels for a width of QW, as a function of concentration in waveguide, while Figure 3 compares dependencies of the first conduction band QW state energy on concentration, for various QW widths, , , and .
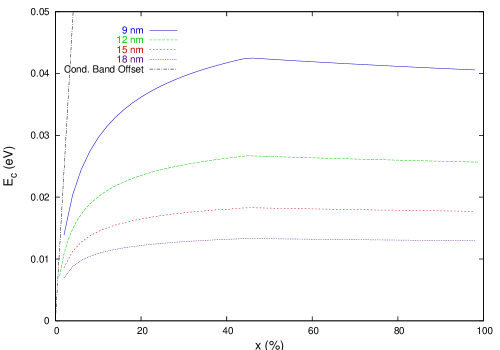
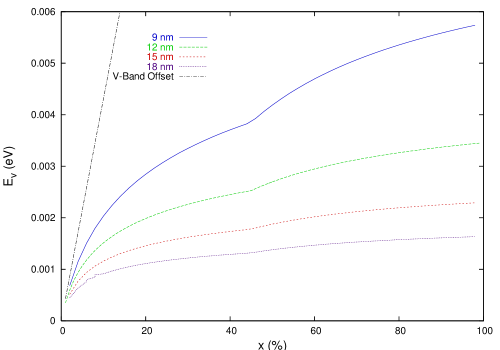
Figure 4 compares dependencies of the first valance band QW energy state of heavy holes, , on concentration, for various QW widths, , , and , while Figure 5 shows similar results for light holes.
We performed also calculations for dependence of QW energy levels on concentration in waveguide, for a broad range of initial concentrations in QW, for all studied QW widths. A typical example data, for width of QW, are shown in Figure 6.
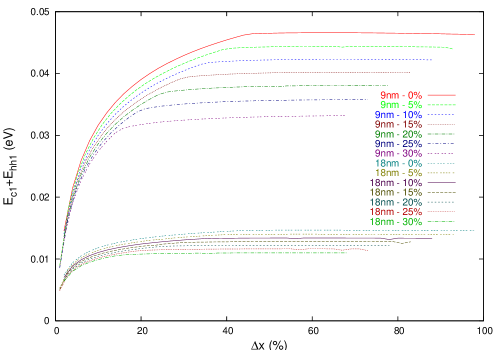
A question arises, to what an extend the contribution of energy of QW states depends on the difference of concentrations between waveguide and the active region. To analyze that, we draw Figure 7. There, is shown as a function of the difference between concentration in waveguide and in active region, , for the case of and QW width, and different concentrations in the active region. The most interesting region, from the engineering point of view, is below of around . We see that in that region, while at lower QW width of differences between curves reach energies of around , for QW width of they become less than about .
Radiation characteristics of -based SCH lasers
Spectral characteristics of laser radiation are determined by the energy difference between the quantization levels of electrons and holes in the QW, as well as the characteristics of the resonator, which is used to enhance radiation. The maximum wavelength of the radiation produced in the active region of the laser diode may be calculated by the formula:
| (3) |
where is Planck’s constant and - the speed of light.
As shown by simulation results, the energy states of electrons, , and holes, , change very slowly with the changes in concentration difference of aluminum in the active region and waveguide.
Moreover, for a broad range of concentrations, the energy contribution from QW states does nearly not depend on the concentration of aluminum itself in the waveguide but is determined rather by concentration diffrences between the active region (QW) and waveguide.
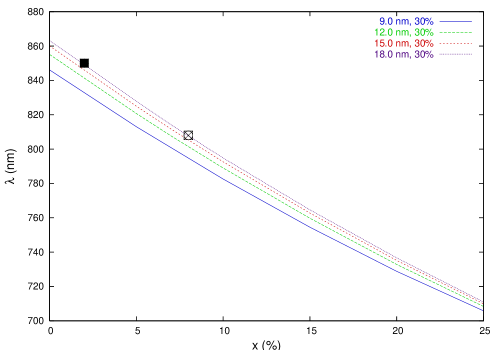
The results of calculations of the wavelength , for SCH lasers with QW width equal to , , , and , are presented in Figure 8. Markers in this figure correspond to wavelengths of high-power semiconductor lasers [5], and [6], produced in the Research Institute "Polyus" in Moscow.
We ought to emphasize that we do not expect the existence of lasing action when concentration exceeds , as electronic transitions would require then a change of wavevector , and these processes would require interaction with phonons. For that reason, however, studing physical processes around these concentrations is extremely interesting.
Conclusions
The depth of the QW, and the energy of the electrons and holes in the active region of lasers with a given QW width, vary with the difference of the molar concentration of aluminum in the active region and waveguide regions.
In this single-mode lasers the lasing maximum wavelength is determined by the semiconductor bandgap in the QW, as well as the lowest energy states of electrons and holes in the QW.
At low concentrations in waveguide, energy levels in QW for both electrons and holes increases monotonically with concentration of aluminum, while at higher concentrations in waveguide, of around and more, they become independent on concentration of aluminum.
The lasing wavelength does nearly not depend on the concentration of aluminum in the waveguide and is determined mainly by 1) the concentration in the active region of laser diodes and 2) by the difference between concentrations in waveguide and active regions.
With the increase of the concentration in active region, the lasing wavelength decreases, in agreement with results obtained at the Research Institute "Polyus" in Moscow.
These results are important from the point of production of SCH lasers based on solid solutions of and can be used to optimize the design of these lasers to improve the efficiency of converting electrical energy into coherent laser radiation.
The work was carried out under the Federal Program "Research and scientific-pedagogical cadres of Innovative Russia" (GC number P2514).
References
- [1] Alferov Zh.I. The double heterostructure concept and its applications in physics, electronics, and technology Rev. Mod. Phys. 2001. V.73. No.3. P.767-782.
- [2] P G Eliseev, Semiconductor lasers: from homojunctions to quantum dots, Quantum Electron, 2002, 32(12), 1085–1096.
- [3] Coldren L.A., Corzine S.W., Diode Lasers and Photonic Integrated Circuits, Wiley Series, 1995.
- [4] Sentaurus TCAD User Guide, Synopsys, 2005, www.synopsys.com
- [5] A.V. Andreev, A.Y. Leshko, A.V. Lyutetskiy,A.A. Marmalyuk, T.A. Nalyot, A.A. Padalitsa, N.A. Pikhtin, D.R. Sabitov, V.A. Simakov, S.O. Slipchenko, M.A. Khomylev, I.S. Tarasov, High power laser diodes ( = 808 – 850 nm) based on asymmetric separate confinement heterostructure, Semiconductors, 2006 40(5), 628-632.
- [6] A.Yu. Andreev, S.A. Zorina, A.Yu. Leshko, A.V. Lyutetskiy, A.A. Marmalyuk, A.V. Murashova, T.A. Nalet, A.A. Padalitsa, N.A. Pikhtin, D.R. Sabitov, V.A. Simakov, S.O. Slipchenko, K.Yu. Telegin, V.V. Shamakhov, I.S. Tarasov, High power lasers ( = 808 nm) based on separate confinement AlGaAs/GaAs heterostructures, Semiconductors, 2009, 43(4), 543-547.
Figure Captions