1RXS J180834.7+101041 is a new cataclysmic variable with non-uniform disc
Abstract
Results of photometric and spectroscopic investigations of the recently discovered disc cataclysmic variable star 1RXS J180834.7+101041 are presented. Emission spectra of the system show broad double peaked hydrogen and helium emission lines. Doppler maps for the hydrogen lines demonstrate strongly non-uniform emissivity distribution in the disc, similar to that found in IP Peg. It means that the system is a new cataclysmic variable with a spiral density wave in the disc. Masses of the components ( and ), and the orbit inclination () were estimated using the various well-known relations for cataclysmic variables.
Keywords:
binaries: eclipsing, binaries: spectroscopic, novae, cataclysmic variables, stars: individual: 1RXS J180834.7+101041:
97.10.Gz,97.80.Gm,97.80.Fk,97.80.Hn1 Introduction
1RXS J180834.7+101041 = USNO-B1 1001-0317189 (, ), later 1RXS J1808, is a ROSAT X-ray source, recently identified as an eclipsing cataclysmic variable (CV) (Denisenko et al., 2008; Bikmaev & Sakhibullin, 2008). Using the observed eclipses, Denisenko et al. (2008) found the orbital period of this close binary system (0.d070037(1)) from the photometric observations. They also found that the brightness of the object varies with an amplitude on a few weeks time scale and classified this CV as a polar. But a spectrum of this system (Bikmaev & Sakhibullin, 2008) shows the double peaked hydrogen and helium emission lines. Therefore, 1RXS J1808 contains an accretion disc around the white dwarf and, therefore, can not be a polar.
Here we present new spectroscopic observations of this CV and their preliminary analysis together with the analysis of avaliable photometric data.
2 Observations
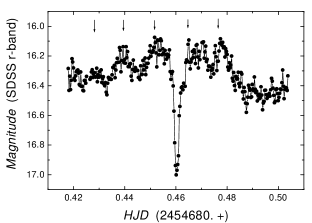
The photometric observations of 1RXS J1808 were performed on August 1-2 2008, with the 1.5–meter Russian-Turkish telescope RTT-150 at the TUBITAK National Observatory (Turkey). Observations were carried out in the SDSS r-band with an exposure time of 25 sec. The total observation time was about 2 hours and calibrated against SDSS standard stars. The obtained light curve is shown in Fig. 1 (left panel). Spectroscopic observations of 1RXS J1808 were carried out on August 9-10, 2008, by the 6–meter telescope BTA of the Special Astrophysical Observatory with the SCORPIO focal reducer (Afanasiev & Moiseev, 2005), which gives a = 5.0 Å resolution in the wavelength region 3900–5700 Å. 16 subsequent spectra with the same exposure time of 300 s and signal-to noise ratio 55 - 65 were obtained. Examples of the obtained spectra are shown in Fig. 1 (right panel). The orbital phases are counted from the photometric minimum.

3 Data analysis
The most prominent details in the observed spectra of 1RXS J1808 are the broad double peaked emission lines of hydrogen as well as neutral and ionized helium (Fig. 1 right panel). The line profiles are strongly changing with orbital phase, especially at the moment of the eclipse.
The radial velocity of the white dwarf was measured using the hydrogen emission lines by Shafter’s method (Shafter, 1983). Dependence of the radial velocity on the orbital phase for Hβ is shown in Fig. 3 (left panel). Surprisingly the radial velocity maximum is at the phase 0 (at the eclipse) instead of 0.75. This huge phase shift means that the radial velocity curve reflects the orbital motion of the bright spot rather than the motion of the white dwarf itself. By the way, the radial velocity curves were fitted by sine in the phase range 0.2 – 0.9, and a value = 70 10 km s-1 was obtained.
Doppler maps of the system for six spectral emission lines were created using Spruit’s code (Spruit, 1998). The trailed spectrogram for Hβ and corresponding Doppler map are shown in Fig. 2. It is clear from the Doppler map that there are two bright spots. The brighter spot corresponds to the meeting point of the accretion stream with the disc and the second is in the opposite place of the disc.
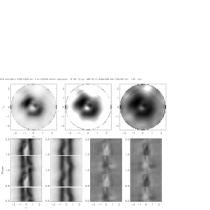

The obtained Doppler maps are very similar to those for IP Peg during quiescence (Neustroev et al., 2002), and the two bright spots were interpreted as a two-arm spiral wave, where one spot is brighter due to interaction of the disc with the stream. 3D hydrodynamical simulations (Bisikalo et al., 2001) predicted this picture and quasiperiodic brightness oscillations with period 0.15 - 0.2 , associated with the second arm rotation. We found the quasiperiodic brightness oscillations with a period 01331 ().
4 Estimation of system parameters
The mass of the secondary star can be evaluated from the orbital period using the mass-radius relation for main sequence stars: (Knigge, 2006; Howell et al., 2001).
The eclipse width ( 0.025) provides us the relation between the inclination and a mass ratio (Horne, 1985).
We assume that the half of the distance between spectral line peaks corresponds to the Kepler velocity at the outer disc radius and obtain an additional relation between , and . The outer disc radius is limited by the tidal interaction with the secondary star (Paczynski, 1977) and we assume it to be equal to 0.8 radii of an equivalent Roche lobe volume sphere (Eggleton, 1983).
We measured the distance between peaks for the Hβ line at phase 0.5 and obtain = 700 50 km s-1. Using this value we calculated the allowed region in the – plane, shown in Fig. 3 (right panel). The interception of the allowed region with the dependence –, found from the phase width of the eclipce, gives the allowed ranges of and . Finally, we have and for , = 700 50 km s-1 and .


5 Conclusions
We conclude that 1RXS J180834.7+101041 is a disc cataclysmic variable star with component masses and , the inclination angle to line of sight and with a spiral density wave in the disc. Most probably it is an SU UMa type star, but more extended photometric and spectroscopic investigations have to be performed to confirm this suggestion.
References
- Denisenko et al. (2008) D. V. Denisenko, T. V. Kryachko and B. L. Satovskiy, Astron. Tel. 1640 (2008).
- Bikmaev & Sakhibullin (2008) I. F. Bikmaev and N. A. Sakhibullin, Astron. Tel. 1648 (2008).
- Afanasiev & Moiseev (2005) V. L. Afanasiev and A. V. Moiseev, Astron. Lett. 31, 194-204 (2005).
- Shafter (1983) A. W. Shafter, Astrophys. Journal 267, 222-231 (1983).
- Spruit (1998) H. C. Spruit, astro-ph/9806141 (1998).
- Neustroev et al. (2002) V. V. Neustroev, N. V. Borisov, H. Barwig, A. Bobinger, K. H. Mantel et al., Astron. and Astrophys. 393, 239-250 (2002).
- Bisikalo et al. (2001) D. V. Bisikalo, A. A. Boyarchuk, A. A. Kilpio and O. A. Kuznetsov, Astr. Rep. 45, 676-685 (2001).
- Knigge (2006) C. Knigge, MNRAS 373, 484-502 (2006).
- Howell et al. (2001) S. B. Howell, L. A Nelson, and S. Rappaport, Astrophys. Journal 550, 897-918 (2001).
- Horne (1985) K. Horne, MNRAS 213, 129-141 (1985).
- Paczynski (1977) B. Paczynski, Astrophys. Journal 216, 822-826 (1977).
- Eggleton (1983) P. P. Eggleton, Astrophys. Journal 268, 368-369 (1983).