Crystallization in suspensions of hard spheres: A Monte Carlo and Molecular Dynamics simulation study
Abstract
The crystallization of a metastable melt is one of the most important non equilibrium phenomena in condensed matter physics, and hard sphere colloidal model systems have been used for several decades to investigate this process by experimental observation and computer simulation. Nevertheless, there is still an unexplained discrepancy between simulation data and experimental nucleation rate densities. In this paper we examine the nucleation process in hard spheres using molecular dynamics and Monte Carlo simulation. We show that the crystallization process is mediated by precursors of low orientational bon-order and that our simulation data fairly match the experimental data sets.
I Introduction
Hard spheres are often used as a model system to study the liquid to crystal transition. Already more than fifty years ago the existence of the freezing transition in hard spheres has been shown by computer simulation methods Alder and Wainwright (1957). As the interaction potential between two hard spheres is infinite when they overlap and zero otherwise, the phase behaviour is determined only by entropy rather than by a competition between enthalpy and entropy. The simple interaction potential makes hard spheres a particularly popular model system for computer simulation studies of crystallization and the competing glass transition (see e.g. Refs. Truskett et al. (1998); Auer and Frenkel (2001); Gruhn and Monson (2001); O’Malley and Snook (2003); Schilling et al. (2010); Zaccarelli et al. (2009); Kawasaki and Tanaka (2010); Charbonneau et al. (2010); Filion et al. (2010)).
Hard sphere–like systems can also be realized experimentally in colloidal suspensions since the 1980’s Pusey and van Megen (1986). Using scattering techniques as well as microscopy, the crystallization process and the competing glass transition have been studied in detail during the past decade (see e.g. Refs. Kegel and Dhont (2000); Gasser et al. (2001); Weeks and Weitz (2002); Cheng et al. (2002); Schöpe et al. (2006)).
The recent interest in studying the crystallization process of hard spheres using computer simulation has been triggered in particular by the following reasons:
Crystal nucleation from a supersaturated liquid is a typical “rare event”. It occurs (by definition) after an induction time that is much longer than the time-scale for thermalization of the microscopic degrees of freedom of the system, and it changes the properties of the system drastically. Computer simulation of rare events requires special techniques in order to avoid wasting large amounts of CPU time on irrelevant microscopic fluctuations. For the past decade crystal nucleation has been commonly used as an example problem to apply rare event sampling techniques. However, in the mean-time computers have become fast enough to sample crystal nucleation by “brute force” simulation in simple model systems, such as hard spheres. Hence hard spheres have recently been used to test the predictions of rare event sampling techniques (such as e.g. results obtained by Umbrella Sampling Auer and Frenkel (2001)) and to compare nucleation pathways directly to experiment Filion et al. (2010); Schilling et al. (2010).
New experiments as well as simulations show deviations from the classical picture of crystallization, indicating that crystallization in hard sphere systems starts with the formation of precursors (low symmetry clusters, medium range ordered crystals) before real crystal are formed Schöpe et al. (2006); Iacopini et al. (2009); Schilling et al. (2010); Kawasaki and Tanaka (2010). Similar observations have been made studying crystal nucleation in atomic systems using dynamical density functional theory Toth et al. (2010). Furthermore it was suggested that these precursors are linked with structural and dynamical heterogeneities of the meta-stable melt and that the formation of precursors might be linked with the glass transition Schöpe et al. (2007); Kawasaki and Tanaka (2010). Hence the topic of crystallization in hard spheres is currently being revisited within computer simulation sutdies.
We have recently published results on the crystallization mechanism in hard spheres that were obtained by a brute force MC simulation Schilling et al. (2010). Here we will add results on nucleation rates and a comparison of two types of microscopic dynamics with experimental data.
II Simulation Details
In order to test if the details of the short time dynamics affect the nucleation behaviour we have performed two types of simulation: event driven Molecular Dynamics (Newtonian free flight and collisions) and Monte Carlo simulations using only small translational moves (mimicking Brownian dynamics on longtime-scales Berthier and Kob (2007); Sanz and Marenduzzo (2010)).
In both cases we monitored crystallization by means of the q6q6-bond order parameter Steinhardt et al. (1983); ten Wolde et al. (1995), the definition of which we briefly recapitulate: For a particle with neighbours, the local orientational structure is characterized by
where are the spherical harmonics corresponding to the orientation of the vector between particle and its neighbour in a given coordinate frame. We are interested in local fcc-, hcp- or rcp-structures. Therefore we consider . A vector is asigned to each particle, the elements of which are defined as
| (1) |
We counted particles counted as neighoburs if their distance . Two neighbouring particles and were regarded as “bonded” within a crystalline region, if . We define as the number of “bonded” neighbours of the th particle. If a particle has (i.e. an almost perfectly hexagonally ordered surrounding), we call it “crystalline”. A cluster of particles with is named low symmetry cluster (LSC).
In the following we use the particle diameter as unit of length and as unit of energy. For the Monte Carlo simulations we use 1000 “sweeps” (1000 attempted MC moves per particle) as unit of time, for the MD one time unit (“step”) corresponds to 27 collisions per particle on average.
The system sizes we simulated were , , , and particles. We studied three densities (volume fraction ), () and (). These densities correspond to chemical potential differences between the metastable liquid and the stable, almost completely crystalline state of , and respectively. The interfacial tension is of the order of Davidchack and Laird (2000); Davidchack et al. (2006). Table 1 summarizes the simulation runs we have performed.
Overcompressed liquid configurations were prepared by a fast pressure quench from the equilibrated liquid. During the quench we monitored crystallinity to ensure that no crystal precursors were formed. (As prestructuring during the preparation procedure can have a significant impact on the nucleation behaviour, we cross-checked the quality of our starting configurations: The authors of ref. Filion et al. (2010) ran trajectories from our starting configurations using their simulation code. Within the errorbars we found no differences in the crystallization process observed.)
II.1 Monte Carlo Simulation
The Monte Carlo simulations were performed at fixed , and by small translational moves only. We let all systems evolve until they crystallized and sampled observables every 5,000 sweeps. Then we prepared movies of the crystalline clusters and played them backwards in time. The moment when the stable crystallite was reduced to a cluster of ca. 10 particles was recorded as “nucleation time” . (Apart from the systems of particles, no system showed more than one crystallization event. In the case of , we used the time when the first crystallite formed, as well as the relation “number of crystllite versus time” to extract the nucleation rate.) We also recorded the times when the last particle with vanished (“last” when playing the movies backwards) and the time when the cluster shrunk below 40 particles. For the observables we used to extract the the crystallization rates and to discuss the crystallisation mechanism, we found no difference between these criteria (apart from a slight shift of the time-scale, obviously). Where times are indicated in the following, each simulation run has been shifted by setting the time to zero at the nucleation event.
II.2 Molecular Dynamics
Molecular dynamics simulations were performed at constant , , and . The initial velocities were drawn from a Gaussian distribution and the initial mean kinetic energy per particle was set to . The total energy is constant over the time of the simulation since all interactions are elastic collisions following Newton’s equations of motion. In between collisions, particles advance ballistically since no force is present. We employed an event driven molecular dynamics algorithm Alder and Wainwright (1959); Marín and Cordero (1995); Krantz (1996); Lubachevsky (1991). The analysis was done in the same way as for the MC simulation.
III Results
| type | runs | rate[] | ||
| MC | 8000 | 1.0269 | 4 | 3.00e-6 |
| MC | 64000 | 1.0269 | 6 | 4.05e-6 |
| MC | 216000 | 1.0269 | 2 | 3.67e-6 |
| MC | 8000 | 1.03 | 8 | 2.10e-5 |
| MC | 14400 | 1.03 | 4 | 2.75e-5 |
| MC | 64000 | 1.03 | 4 | 1.82e-5 |
| MC | 216000 | 1.03 | 5 | 1.07e-5 |
| 216000 | 1.03 | 5 | 1.73e-5 | |
| MD | 64000 | 1.0238 | 5 | 7.2e-7 |
| MD | 8000 | 1.0269 | 29 | 1.93e-6 |
| MD | 8000 | 1.03 | 7 | 4.5e-6 |
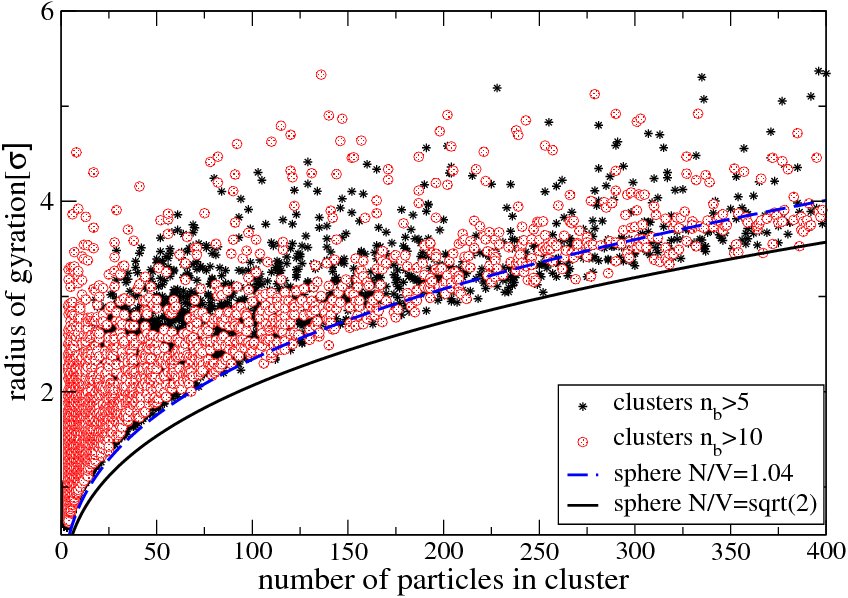
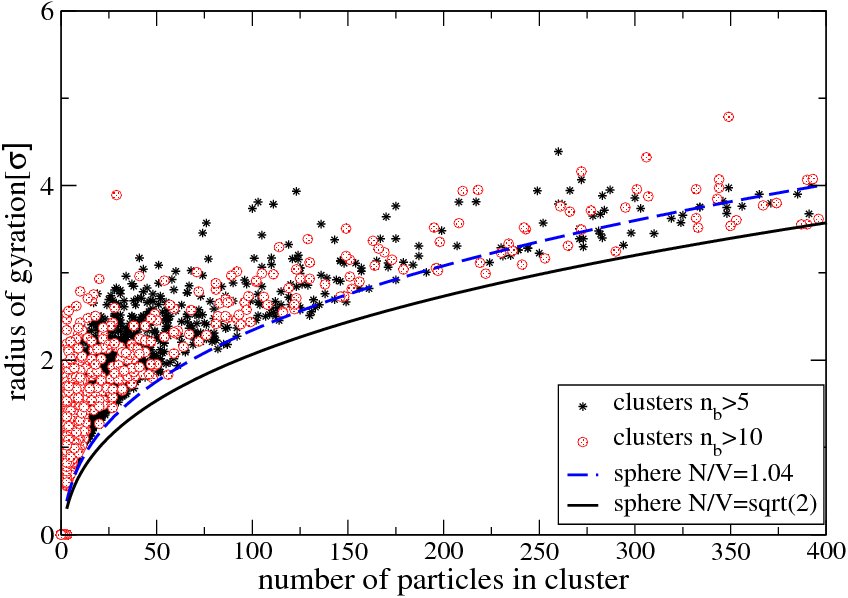
We first discuss the crystallite structures and then present results for the rates. Fig. 1 shows the radius of gyration versus the number of particles in a cluster for all clusters observed in the MC simulations (only up to 400 particles in a cluster to keep the graph readable). Stars indicate low symmetry clusters, circles crystalline clusters. In both, the data from MC and from MD, there is a wide spread in , structures ranging from an almost linear aggregates to very densely packed spheres occur. Even at large crystal sizes (i.e. in the crystal growth regime) there are ramified structures. Therefore, in the following discussion, we use the number of particles in a cluster rather than its radius to define a “cluster size”.
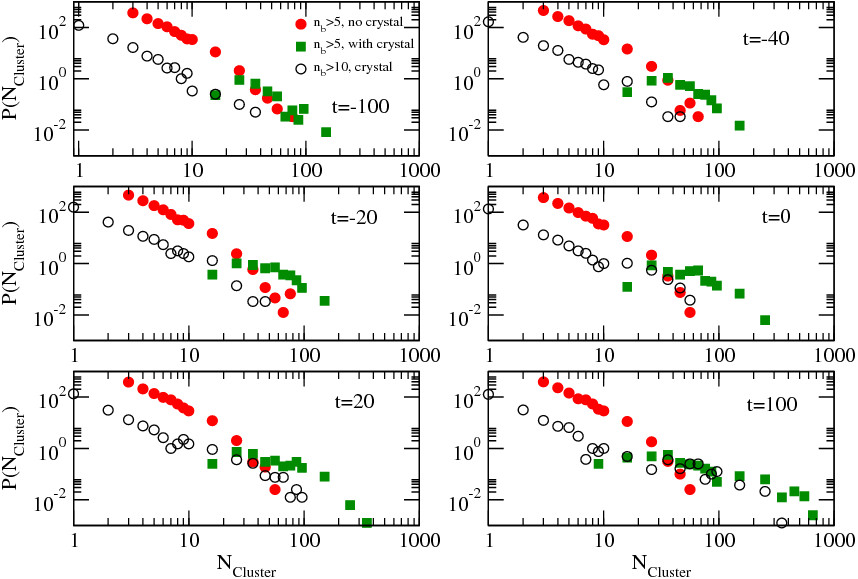
Fig. 2 shows the development of the cluster size distribution for the MC simulations. The data has been averaged over all simulation runs (shifted by the “nucleation time” as explained above). We distinguish between clusters of with less than 4 particles that have (i.e. ”empty” low symmetry clusters that do not contain crystallites, indicated by filled circles), clusters of with 4 or more crystalline particles (squares) and clusters of particles with (i.e. crystallites, open circles). The distribution of empty LSC does not vary with time. Just before crystallization sets in, at times to , large low symmetry clusters that contain up to several hundred particles are formed, while the crystallites (empty circles) are still relatively small. Then the crystallites “follow” until the two distributions coincide at . This confirms our previous observation of a precursor mediated process Schilling et al. (2010).
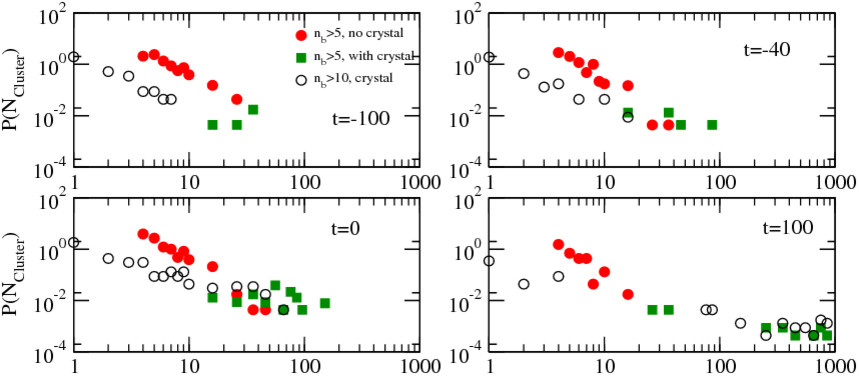
Fig. 3 shows the cluster size distributions for the MD simulation. As in the MC case, first low symmetry clusters form, then the crystallites appear. Hence the precursor-effect does not depend on the short time dynamics.
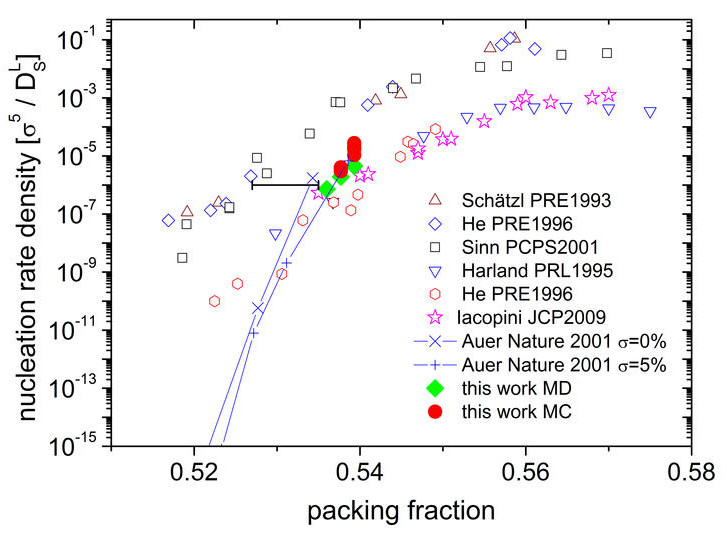
In fig. 4 we compare of the dimensionless nucleation rate density with experimental results and results from previous simulations. We scaled our data with the long-time self-diffusion coefficient extracted from our simulations. The typical error in our data is ca. To scale the experimental data we used the following expression of the long time self-diffusion coefficient provided by mode coupling theory using and as determined in experiments. Please note that the data of ref. Schätzel and Ackerson (1993); Harland et al. (1995); Sinn et al. (2001); He et al. (1996) are scaled to the freezing volume fraction of monodisperse spheres while the data of ref. Iacopini et al. (2009) is scaled to the freezing volume fraction of polydisperse spheres with polydispersity. The typical error determining the volume fraction in these experiments is about as indicated by the horizontal error bar while the error in the nucleation rate density is about one order of magnitude. Taking the experimental uncertainties into account the experimental data sets are not inconsistent. The simulation data of Auer and Frenkel Auer and Frenkel (2001) for samples with polydispersity have been scaled to the freezing point of monodisperse spheres allowing a direct comparison with the older experiments. The results obtained in our simulations (solid symbols, see also table 1) are in good agreement with the experimental data reproducing both their absolute values and their slope. They seem to lie below the simulation data from ref. Auer and Frenkel (2001), but this effect might still be within the error bars.
In summary, we have presented a simulation study of crystallization in hard spheres. Both, MD (Newtonian free flight and collisions) and MC (quasi-Brownian dynamics) show a precursor mediated crystallization process. First aggregates of low orientational bond-order form, then crystallites grow inside these. The shapes of the crystallites range from ramified structures to almost perfectly packed spheres. The crystallisation rates agree with the experimental data as well as between MC and MD within the errorbars.
Acknowledgements.
We thank Laura Filion for cross-checking start configurations and Martin Oettel for fruitful discussions. This project has been financially supported by the DFG (SFB Tr6 and SPP1296).References
- Alder and Wainwright (1957) B. J. Alder and T. E. Wainwright, J. Chem. Phys 27, 1208 (1957).
- Truskett et al. (1998) T. Truskett, S. Torquato, S. Sastry, P. Debenedetti, and F. Stillinger, Phys. Rev. E 58, 3083 (1998).
- Auer and Frenkel (2001) S. Auer and D. Frenkel, Nature 409, 1020 (2001).
- Gruhn and Monson (2001) T. Gruhn and P. Monson, Phys. Rev. E 64, 061703 (2001).
- O’Malley and Snook (2003) B. O’Malley and I. Snook, Phys. Rev. Lett. 90, 085702 (2003).
- Schilling et al. (2010) T. Schilling, H. J. Schoepe, M. Oettel, G. Opletal, and I. Snook, Phys. Rev. Lett. 105 (2010).
- Zaccarelli et al. (2009) E. Zaccarelli, C. Valeriani, E. Sanz, W. C. K. Poon, M. E. Cates, and P. N. Pusey, Phys. Rev. Lett. 103 (2009).
- Kawasaki and Tanaka (2010) T. Kawasaki and H. Tanaka, Proc. Natl. Acad. Sci. U. S. A. 107, 14036 (2010).
- Charbonneau et al. (2010) P. Charbonneau, A. Ikeda, J. A. van Meel, and K. Miyazaki, Phys. Rev. E 81 (2010).
- Filion et al. (2010) L. Filion, M. Hermes, R. Ni, and M. Dijkstra, Crystal nucleation of hard spheres using molecular dynamics, umbrella sampling and forward flux sampling: A comparison of simulation techniques, arXiv:1006.2925v1 [cond-mat.soft] (2010).
- Pusey and van Megen (1986) P. Pusey and W. van Megen, Nature 320, 340 (1986).
- Kegel and Dhont (2000) W. K. Kegel and J. K. G. Dhont, J. Chem. Phys. 112, 3431 (2000).
- Gasser et al. (2001) U. Gasser, E. R. Weeks, A. Schofield, P. N. Pusey, and D. A. Weitz, Science 292, 258 (2001).
- Weeks and Weitz (2002) E. Weeks and D. Weitz, Phys. Rev. Lett. 89 (2002).
- Cheng et al. (2002) Z. Cheng, P. Chaikin, J. Zhu, W. B. Russel, and W. Meyer, Phys. Rev. Lett. 88, 015501 (2002).
- Schöpe et al. (2006) H. Schöpe, G. Bryant, and W. van Megen, Phys. Rev. Lett. 96, 175701 (2006).
- Iacopini et al. (2009) S. Iacopini, T. Palberg, and H. Schöpe, J. Chem. Phys. 130, 084502 (2009).
- Toth et al. (2010) G. Toth, G. Tegze, T. Pusztai, G. Toth, and L. Granasy, J. Phys.-Condes. Matter 22 (2010).
- Schöpe et al. (2007) H. Schöpe, G. Bryant, and W. van Megen, J. Chem. Phys. 127, 084505 (2007).
- Kawasaki and Tanaka (2010) T. Kawasaki and H. Tanaka, J. Phys.-Condes. Matter 22 (2010).
- Berthier and Kob (2007) L. Berthier and W. Kob, J. Phys.-Condes. Matter 19 (2007).
- Sanz and Marenduzzo (2010) E. Sanz and D. Marenduzzo, J. Chem. Phys. 132 (2010).
- Steinhardt et al. (1983) P. J. Steinhardt, D. R. Nelson, and M. Ronchetti, Phys. Rev. B 28, 784 (1983).
- ten Wolde et al. (1995) P. R. ten Wolde, M. J. Ruiz-Montero, and D. Frenkel, Phys. Rev. Lett. 75, 2714 (1995).
- Davidchack and Laird (2000) R. L. Davidchack and B. B. Laird, Phys. Rev. Lett. 85, 4751 (2000).
- Davidchack et al. (2006) R. L. Davidchack, J. R. Morris, and B. B. Laird, J. Chem. Phys 125, 094710 (2006).
- Alder and Wainwright (1959) B. J. Alder and T. E. Wainwright, The Journal of Chemical Physics 31, 459 (1959).
- Marín and Cordero (1995) M. Marín and P. Cordero, Computer Physics Communications 92, 214 (1995).
- Krantz (1996) A. T. Krantz, ACM Trans. Model. Comput. Simul. 6, 185 (1996).
- Lubachevsky (1991) B. D. Lubachevsky, J. Comput. Phys. 94, 255 (1991).
- Schätzel and Ackerson (1993) K. Schätzel and B. Ackerson, Phys. Rev. E 48, 3766 (1993).
- Harland et al. (1995) J. L. Harland, S. I. Henderson, S. M. Underwood, and W. van Megen, Phys. Rev. Lett. 75, 3572 (1995).
- Sinn et al. (2001) C. Sinn, A. Heymann, A. Stipp, and T. Palberg, in TRENDS IN COLLOID AND INTERFACE SCIENCE XV, edited by Koutsoukos, PG, European Soc, Colloid & Interface Soc (SPRINGER-VERLAG BERLIN, 2001), vol. 118 of PROGRESS IN COLLOID AND POLYMER SCIENCE, pp. 266–275, ISBN 3-540-42241-2, 14th Conference of the European-Society-of-the-Colloid-and-Interface-Society, PATRAS, GREECE, SEP, 2000.
- He et al. (1996) Y. He, B. J. Ackerson, W. van Megen, S. M. Underwood, and K. Schätzel, Phys. Rev. E 54, 5286 (1996).