Observational evidence for matter propagation in accretion flows
Abstract
We study simultaneous X-ray and optical observations of three intermediate polars EX Hya, V1223 Sgr and TV Col with the aim to understand the propagation of matter in their accretion flows. We show that in all cases the power spectra of flux variability of binary systems in X-rays and in optical band are similar to each other and the majority of X-ray and optical fluxes are correlated with time lag sec. These findings support the idea that optical emission of accretion disks, in these binary systems, largely originates as reprocessing of X-ray luminosity of their white dwarfs. In the best obtained dataset of EX Hya we see that the optical lightcurve unambiguously contains some component, which leads the X-ray emission by sec. We interpret this in the framework of the model of propagating fluctuations and thus deduce the time of travel of the matter from the innermost part of the truncated accretion disk to the white dwarf surface. This value agrees very well with the time expected for matter threaded onto the magnetosphere of the white dwarf to fall to its surface. The datasets of V1223 Sgr and TV Col in general confirm these findings, but have poorer quality.
keywords:
Accretion, accretion disks – Instabilities – (Stars:)binaries: general – (Stars:)novae, cataclysmic variables – (Stars:) white dwarfs – Stars: variables: general1 Introduction
Accretion is the main source of energy for a wide variety of astrophysical objects, from pre-main sequence stars through white dwarf, neutron star and black hole binaries up to supermassive black holes in centers of galaxies. The matter in accretion disks in these systems gradually moves towards the compact object, extracts gravitational energy and produce broad band emission spectra. In spite of general understanding of formation of emission in accretion disks (see e.g Shakura & Sunyaev 1973; Done, Gierliński, & Kubota 2007) and temperature distributions over the disk (see e.g. Horne 1985), the very fact that the matter travels outside-in is not an easy thing to verify even though it is essential for the whole accretion process.
Virtually the only way to verify this movement of the matter in the accretion flow is to study the time variability of its emission at different parts of the flow (except for, may be, the radial velocity component of the emission lines). Indeed, matter travels from the outer parts of the accretion flow towards the central compact object and thus any time variations of the mass tranfer rate in the flow should be transported inwards (though with possible smearing due to influence of viscosity).
This idea together with the assumption that all accretion flow radii generate their own additional noise at characteristic frequencies, corresponding to their dynamical times is an essense of the model of propagating fluctuations (see e.g. Lyubarskii 1997; Churazov, Gilfanov, & Revnivtsev 2001; Uttley & McHardy 2001; Kotov, Churazov, & Gilfanov 2001; Arévalo & Uttley 2006; Revnivtsev et al. 2009, 2010). The shortest time scales in this model are introduced at the smallest radii, the largest time scales are introduced at outer parts of the accretion disks. The inner parts of the disk add their noise to the mass accretion rate coming from the outer parts in a multiplicative way, thus naturally producing the observed linear relation between the amplitude of the fluctuations and the time averaged flux (see e.g. Lyutyi & Oknyanskii 1987; Uttley & McHardy 2001) and log-normal distribution of instantaneous values of fluxes (see e.g. Uttley, McHardy, & Vaughan 2005; Revnivtsev 2008). The model implies that there should be a definite time lag between variabilities of emission of outer and inner parts of the accretion flow. Note than here we can compare only variabilities at long time scales, because short time scale fluctuations are absent at the outer parts of the disk.
This prediction is not easy to check because of different complications. For example, in the case of galactic neutron star and black holes binaries it is relatively easy to observe the variability of the mass accretion rate in the innermost parts of the flow – in the X-ray energy band. At the same time, the mass accretion rate variations at the outer parts of the accretion disk are almost invisible to us because the internal energy release of accreting matter at these radii is negligible in comparison with the energy absorbed by the disk from the illuminating X-ray flux (e.g. Dubus et al. 1999). Therefore, the optical emission of these systems is largely determined by the reprocessing of their X-ray luminosity (e.g. van Paradijs & McClintock 1994) and thus does not provide us information about internal mass accretion rate variations at these radii. In accretion disks around supermassive black holes the characteristic time scales can be as large as years and tens of years, therefore requiring large monitoring campaigns, rarely avaiable (see, however, Edelson et al. 1996; Desroches et al. 2006; Doroshenko et al. 2009; Arévalo et al. 2009).
One of the best available examples today of propagation of mass accretion rate fluctuations (flickering) in the accreting systems can be found among dwarf novae – accreting non magnetized white dwarfs. In the work of Pandel, Córdova, & Howell (2003) it was shown that the X-ray emission of accreting white dwarf VW Hyi in quiescence is delayed with respect to its UV emission with 100 sec. It is assumed that in this system the optically thick accretion disk, emitting UV radiation, ends at some distance from the white dwarf while the X-ray emission originates at the WD surface. The observed time lag was interpreted by authors as a time for the matter to travel from the inner parts of the optically thick accretion disk to the WD surface.
Due to rather uncertain issue about the disk truncation in case of dwarf novae in quiescence it is reasonable to look for better observational evidences of matter propagation in accretion flows. For this purpose we have selected luminous intermediate polars (IPs) – magnetized white dwarfs, in which the accretion disk is truncated very close to the WD surface (although some IPs maybe discless systems), but which, nevertheless, certainly have geometrically distinct regions generating the outgoing radiation. In intermediate polars X-rays originate close to the surface of WD, while the optical emission is mainly generated by the optically thick accretion disk or accretion curtains (see e.g. Hellier et al. 1987; Patterson 1994; Hellier 1995). The optical emission of the disk can be powered either by its internal dissipation or, by a reprocessing of the X-ray emission, coming from the central object (see e.g. Beuermann et al. 2004)
In cases of intermediate polars we have several advantges: 1) we know that the accretion disk is certainly truncated at some distance from WD because we see X-ray pulsations, 2) we can make an estimate of the innermost radius of this accretion disk judging from the shape of the power spectra of their time variability (see e.g. Revnivtsev et al. 2009, 2010). High mass accretion rates in these systems ensure that the white dwarf magnetosphere is not large and thus the internal energy release in the accretion disk is not completely negligible in comparison with the illuminating X-ray flux from the WD.
We have performed a set of simultaneous observations of EX Hya, V1223 Sgr and TV Col in X-ray and in optical spectral band with RXTE/PCA and the 1.9m telescope of the South African Astronomical Observatory. In this paper we present results of this campaign.
2 Observations and data reduction
2.1 RXTE data
Our sample includes three of the brightest intermediate polars of the southern hemisphere (in order to ensure simultaneous observations with South African Astronomical Observatory): EX Hya, V1223 Sgr and TV Col. These sources were observed by the RXTE (Bradt, Rothschild, & Swank 1993) during approximately 20 ksec each in April 2010. More detailed log of simultaneous RXTE-SAAO observations is presented in Table 1.
| RXTE | SAAO | |||||
|---|---|---|---|---|---|---|
| Source | Obs.ID | Start time | Exp., ksec | Start time (MJD) | Exp., ksec | Filters |
| EX Hya | 95305-02-01-00 | 55301.828 | 3.3 | 55301.818 | 5.1 | R,U |
| EX Hya | 95305-02-04-00 | 55303.986 | 3.2 | 55303.973 | 4.7 | R,U |
| EX Hya | 95305-02-02-02 | 55304.836 | 3.2 | 55304.822 | 4.6 | R,U |
| V1223 Sgr | 95305-01-02-05(10) | 55305.066 | 2.7 | 55305.072 | 8.2 | R,U |
| TV Col | 95305-03-01-00 | 55301.752 | 2.0 | 55301.750 | 4.7 | I,B |
| TV Col | 95305-03-02-00 | 55303.764 | 3.4 | 55303.751 | 3.6 | R,U |
| TV Col | 95305-03-02-01 | 55304.744 | 4.6 | 55304.739 | 4.9 | R,U |
Data were analized with tasks of HEASOFT package, version V6.5. RXTE/PCA background was estimated with the help of model, appropriate for faint sources ”CMFAINT_L7”. Lightcurves of sources were extracted from data of the first layer of PCU2 in energy band 3-15 keV, maximizing the signal to noise ratio. All lightcurves were background subtracted for the analysis.
2.2 SAAO data
For aquiring optical lightcurves we used the recently commissioned HIgh speed Photo-POlarimeter (HIPPO; Potter et al. 2010) on the 1.9m telescope of the South African Astronomical Observatory during the nights beginning 15th, 17th and 18th April 2010 (details of the observations is presented in Table 1). HIPPO is a 2 channel instrument capable of simultaneous two filtered photo-polarimetry. None of the targets showed statistically significant polarization in any filter and consequently the photometry is reported here only. Data reduction proceeded as outlined in Potter et al. (2010) and binned to 1 second time resolution. Absolute timing was maintained via the observatory’s time service which is phased by a GPS receiver.
3 Power spectra
Observations clearly show aperiodic variability of fluxes of all sources both in X-ray and in optical spectral bands. Among the obtained datasets, observations of EX Hya have the best quality (the source is brighter than TV Col in X-rays, and the length of overlaping observations is much larger than for V1223 Sgr), therefore we will concentrate below on the case of EX Hya, while presenting the similar results (if statistics allows us) for other sources.
An example of lightcurves of EX Hya, observed simutaneousely with RXTE/PCA and SAAO is shown in Fig.1. Close similarity between curves is clearly seen.

The power spectra of variability of the source at these energies are very similar to each other (see Fig.2).
The shape of the power spectra can be adequately described by a simple analytical model (following Revnivtsev et al. 2010)
, describing smooth break between the slope of the power spectrum at low frequencies and at high frequencies . Frequencies of the break in optical in X-ray data, collected in April 2010, are Hz and Hz, correspondingly. If we fit the power spectrum of variability of X-ray flux of EX Hya, averaged over all observations in RXTE archive (1996-2010, exposure time 200 ksec), we obtain the break frequency Hz.
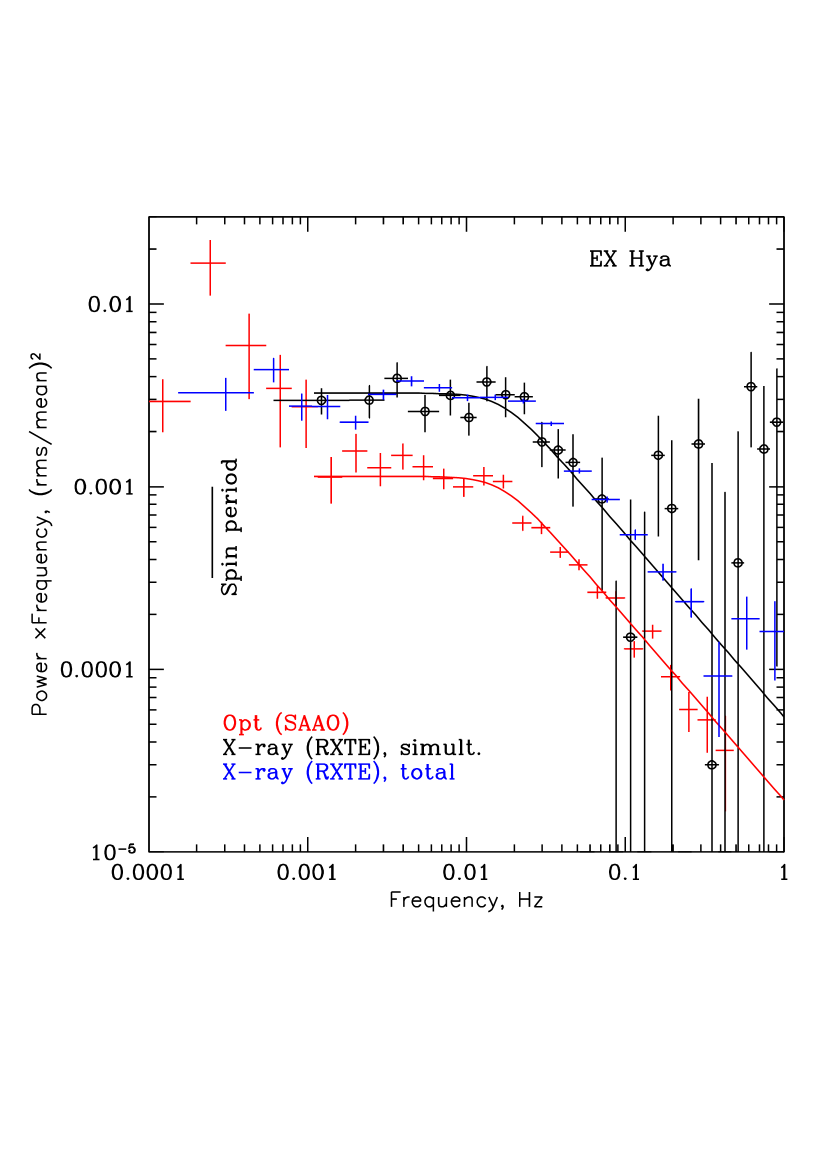
Assuming that the break frequency corresponds to the frequency of Keplerian rotation at the boundary of the magnetosphere (see evidences for this statement in Revnivtsev et al. 2009) we can estimate the inner radius of the accretion disk in EX Hya. We adopt the mass of the WD in EX Hya (Beuermann & Reinsch 2008), and thus its radius (using Nauenberg 1972) cm. The estimate of the innermost radius of the disk from the value of the break frequency is cm, or .
In fact, it is likely that the transition between the accretion disk and the WD magnetosphere is not a simple perfect circle and forms something like accretion curtains (see e.g. Hellier et al. 1987; Hellier 1995). Therefore it would be reasonable to say that the position of the break in the power spectrum measures the position of these transition regions. It is remarkable to note note that estimates of distance of these accretion curtains from the WD surface made from completely different physical arguments, i.e. cm from analysis of emission line profiles (Hellier et al. 1987) and cm from analysis of spin modulated eclipses of the emission region (Siegel et al. 1989) very close to our estimates.
This value of the radius of the transition region (or size of the WD magnetopshere) tells us that it is truncated much below the corotation radius. Depending on details of coupling of the WD magnetosphere to the accretion disk it might lead to a certain spin up of the WD rotation. Note, that the white dwarf in EX Hya is indeed spinning up (see the latest measurements in Mauche et al. 2009).
4 Time lags
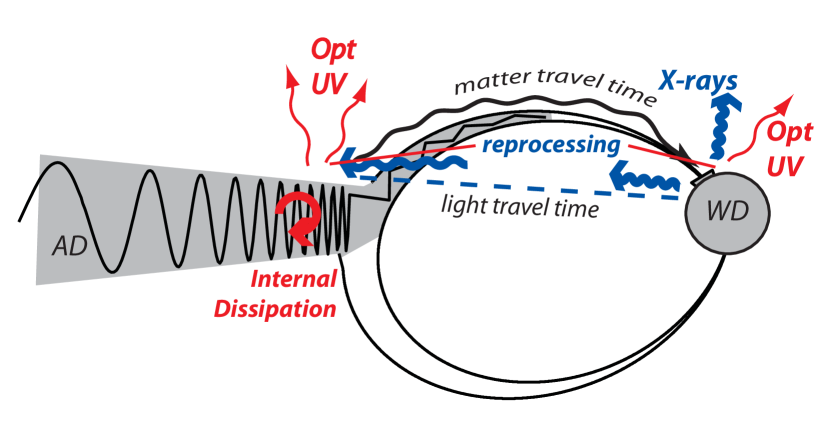
Similarity of optical and X-ray power spectra variability of EX Hya is naturally predicted by the model of propagating fluctuations. Variations of the mass accretion rate, flowing through the inner part of the accretion disk (which creates optical/UV emission), results in a modulation in the mass accretion rate at the WD surface, thus generating variable X-ray flux. If the optical/UV light is powered mainly by the internal dissipation in the disk, then X-ray emission variations should lag the optical variation by a matter travel time in the magnetosphere
More accurately, if we will assume, that the matter is accelerating from zero velocity at towards the white dwarf and moves radially, then
or
, which for our parameters is 8 sec. However, if the reprocessing of the X-ray emission plays a dominant role in heating of the accretion disk (note that surface of WD is heated by X-rays anyway), then the optical emission will lag the X-rays by a light crossing time msec. Generation of this variability pattern is schematically shown in Fig.3.
In both cases the flux variability of the source in these spectral bands should be closely correlated. This is indeed observed. The curves are strongly correlated and the peak of the cross-corelation is at (see Fig.4). This directly shows that the variable optical emission of EX Hya is mainly powered by reprocessing of X-rays (the light crossing time lag 6 msec can not be detected with time resolution of our datasets).

However, it is seen on Fig.4 that the cross-corelation obviousely is not symmetric with respect to zero – there is much more correlation at negative delays (optics leads X-rays), than on positive. This indicates that we do see some part of the internal dissipation in the disk and its variability leads the X-rays.
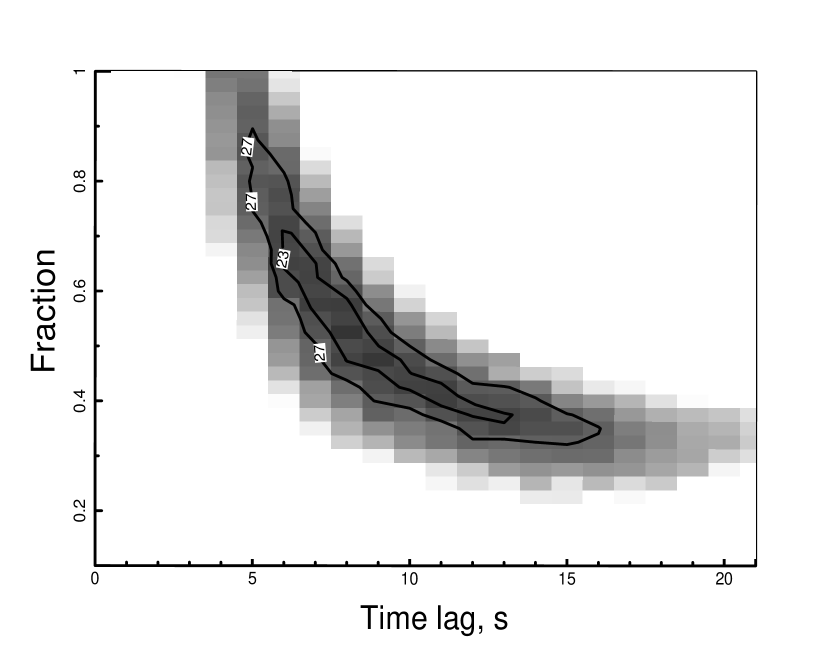
In order to demonstrate this point we have simulated the X-ray and optical lightcurves, and compared their cross-corelations with the observed one. We have simulated the X-ray lightcurve , which is suppossed to be representing mass accretion rate variations on WD surface, as a curve, whose power spectrum has a shape measured by us (see above). Then we have simulated the optical curve . This curve consists of two parts, one is having zero time lag with respect to X-ray curve (simple reprocessing of the illuminating X-ray flux) and another, which is preceeding the X-ray curve due to finite matter travel time from the place of generation of the optical emission to the WD surface. Therefore, the curve was modelled as a sum of two copies of the simulated X-ray lightcurve with a range of time lags between them () and fractional contribution of the delayed component given by : . The cross-correlation of the resulted curves was compared with that obtained from observations in range of delays seconds. The contour plot with different values of the time lag and the fractional contribution of the delayed curve is shown on upper panel of Fig. 5. The minimum of the formally calculated is approximately for 39 degrees of freedom (41 data points and 2 parameters), but we should keep in mind that the neighboring values of the cross-corelation are not statistically independent because they use almost the same samples of observed points on lightcurves, therefore the face values of the can not be used to calculate true statistical significances. If we try to rescale the obtained minimum of the value to the number of d.o.f (assuming, that the fit is good), the formal confidence intervals on the parameters would be: sec and . It is remarkable, that the lag between X-ray and optical data perfectly agrees with the estimate of the matter travel time in the magnetosphere of EX Hya (see above).

5 V1223 Sgr and TV Col
The quality of the datasets for V1223 Sgr and TV Col are somewhat worse, therefore we cannot repeat in detail the analysis which we have done for EX Hya. However, we do see the same similarities between power spectra in the X-ray and optical bands, and we do see significant correlation between them.
We only would like to mention some peculiarity in the power spectrum of variability of X-ray flux of TV Col during our observations in 2010. The power clearly has some excess (quasiperiodic oscillation, QPO) at frequencies around Hz with an amplitude of %. On the power spectrum obtained from all the data in the RXTE archive this excess is not so narrow, indicating that it might be either a transient phenomenon, or a phenomenon with a floating centroid frequency. It is interesting to note that this QPO is located close to the frequency of the break in the power spectrum ( Hz in this case). Such behavior is very similar to that of power spectra of accreting magnetized neutron stars/X-ray pulars (e.g. Cen X-3 or 4U1626-67, see Revnivtsev et al. 2009). It is likely that this QPO might be connected with instabilities at the boundary of the compact object magnetosphere.
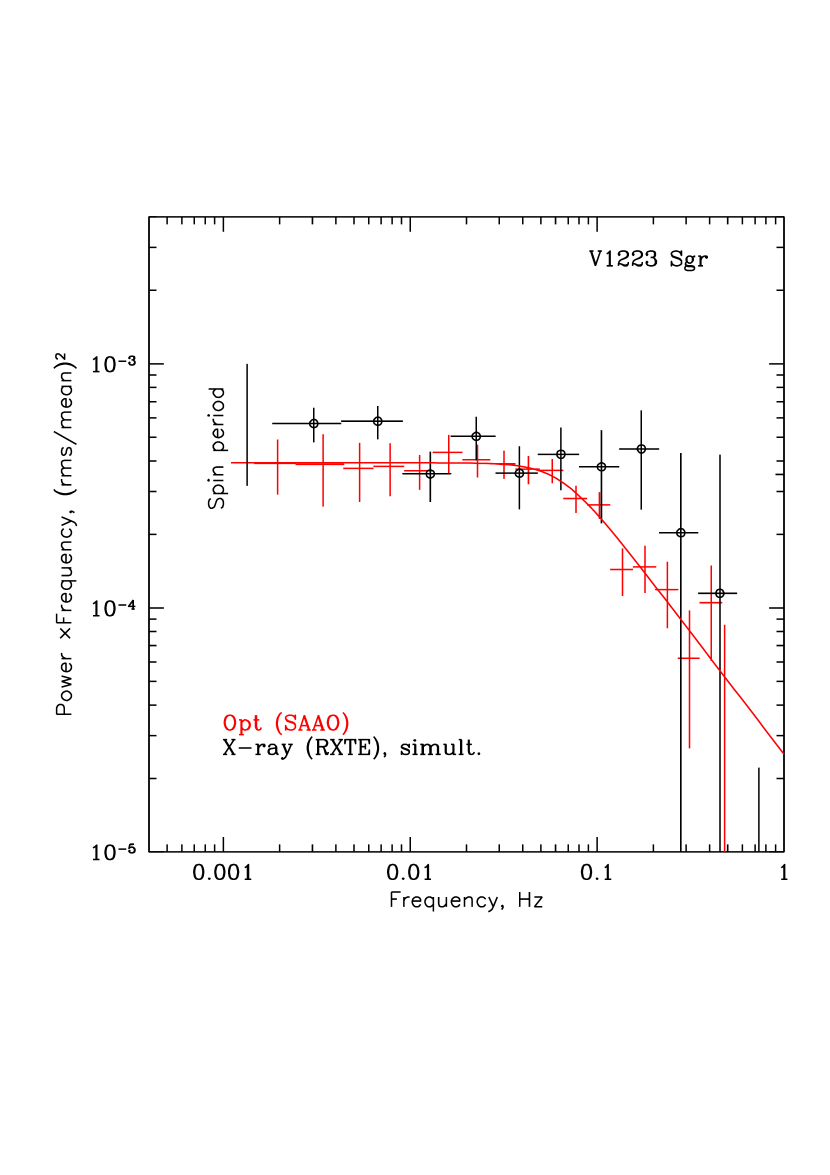
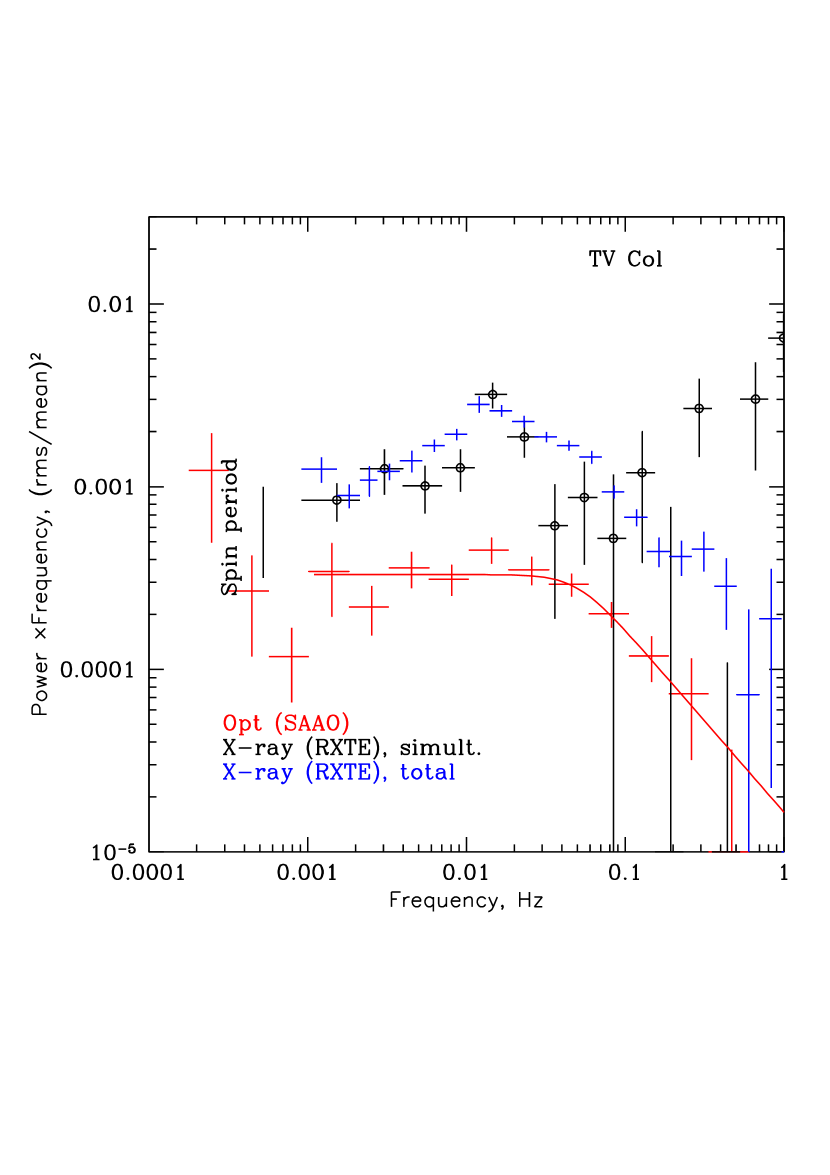
Correlations also peak at zero timelag (Fig.7) but they are more noisy than that of EX Hya.
It should be noted, that the shape of the power spectrum of the V1223 Sgr data from 2010 (reported here) has a break at Fourier frequency, which is significantly higher than that, detected in the power spectrum of its variability recorded in 2008 (Revnivtsev et al. 2010) and that we have seen in the case of EX Hya. This indicates that the inner accretion disk radius has decreased since the 2008 observations. Adopting this new inner radius of the accretion disk cm (here we adopted ) we can estimate that the lag due to matter travel time in the magnetosphere of V1223 Sgr should be small, sec and thus, undetectable with time resolution of our optical data (1 sec).

6 Summary
We have analized the sets of simultanous observations of the X-ray brightest southern intermediate polars EX Hya, V1223 Sgr and TV Col. The best avaiable dataset of EX Hya allowed us to obtain the results summarized below. Datasets of sources V1223 Sgr and TV Col are poorer quality, but they demonstrate the same properties (as far as the statistics allow) of power spectra of their variability and cross-corelation functions.
-
•
The power spectra of the flux variability of EX Hya in optical and X-ray spectral bands are very similar to each other and have a break in the slope to at the frequency Hz. Following Revnivtsev et al. (2009, 2010) we relate this break with the transition of the matter from the disk flow at larger distances from the WD to the magnetospheric flow closer to the WD. The break in the power spectrum is at much higher frequencies than the WD spin frequency, thus indicating that the disk ends within the corotation radius.
-
•
X-ray and optical lightcurves are strongly correlated with peak of cross-corelation function around zero timelag. We interpret this as a sign of reprocessing of X-ray light at surfaces of the optically thick accretion disk, the accretion curtains and the WD.
-
•
However, we detect a clear and stable asymmetry of the X-ray-optical crosscorrelation function, which indicates that at least some part of the optical variability leads the X-ray variability. We measure the the time lag between these variabilities sec, which is consistent with the travel time of matter from the inner radius of the accretion disk (or accretion curtains), along the magnetosphere, to the white dwarf surface. We interpret this as a clear sign of the propagating fluctuation in the accretion flow. In this particular case we estimate that approximately % of the optical variability is preceeding the variability of the X-ray lightcurve, indicating a significant contribution of the internal energy dissipation in the disk to the total energy budget of the inner part of the optically thick accretion disk.
Acknowledgements
Authors thank Coel Hellier for useful comments about accretion curtains in intermediate polars. This research made use of data obtained from the High Energy Astrophysics Science Archive Research Center Online Service, provided by the NASA/Goddard Space Flight Center. This work was supported by a grant of Russian Foundation of Basic Research 10-02-00492-a, NSh-5069.2010.2, and program of Presidium of RAS “The origin and evolution of stars and galaxies” (P-19).
References
- Arévalo & Uttley (2006) Arévalo P., Uttley P., 2006, MNRAS, 367, 801
- Arévalo et al. (2009) Arévalo P., Uttley P., Lira P., Breedt E., McHardy I. M., Churazov E., 2009, MNRAS, 397, 2004
- Beuermann et al. (2004) Beuermann K., Harrison Th. E., McArthur B. E., Benedict G. F., G nsicke B. T., 2004, A&A, 419, 219
- Beuermann & Reinsch (2008) Beuermann K., Reinsch K., 2008, A&A, 480, 199
- Bradt, Rothschild, & Swank (1993) Bradt H. V., Rothschild R. E., Swank J. H., 1993, A&AS, 97, 355
- Churazov, Gilfanov, & Revnivtsev (2001) Churazov E., Gilfanov M., Revnivtsev M., 2001, MNRAS, 321, 759
- Desroches et al. (2006) Desroches L.-B., et al., 2006, ApJ, 650, 88
- Done, Gierliński, & Kubota (2007) Done C., Gierliński M., Kubota A., 2007, A&ARv, 15, 1
- Doroshenko et al. (2009) Doroshenko V. T., Sergeev S. G., Efimov Y. S., Klimanov S. A., Nazarov S. V., 2009, AstL, 35, 361
- Dubus et al. (1999) Dubus G., Lasota J.-P., Hameury J.-M., Charles P., 1999, MNRAS, 303, 139
- Edelson et al. (1996) Edelson R. A., et al., 1996, ApJ, 470, 364
- Hellier et al. (1987) Hellier C., Mason K. O., Rosen S. R., Cordova F. A., 1987, MNRAS, 228, 463
- Hellier (1995) Hellier C., 1995, ASPC, 85, 185
- Horne (1985) Horne K., 1985, MNRAS, 213, 129
- Jensen et al. (1983) Jensen K. A., Middleditch J., Grauer A. D., Horne K., Gomer R., Cordova F. A., Mason K. O., 1983, ApJ, 270, 211
- Kotov, Churazov, & Gilfanov (2001) Kotov O., Churazov E., Gilfanov M., 2001, MNRAS, 327, 799
- Linnell (1950) Linnell A. P., 1950, HarCi, 455, 1
- Lyubarskii (1997) Lyubarskii Y. E., 1997, MNRAS, 292, 679
- Lyutyi & Oknyanskii (1987) Lyutyi V. M., Oknyanskii V. L., 1987, SvA, 31, 245
- Mauche et al. (2009) Mauche C. W., Brickhouse N. S., Hoogerwerf R., Luna G. J. M., Mukai K., Sterken C., 2009, IBVS, 5876, 1
- Nauenberg (1972) Nauenberg M., 1972, ApJ, 175, 417
- Pandel, Córdova, & Howell (2003) Pandel D., Córdova F. A., Howell S. B., 2003, MNRAS, 346, 1231
- Patterson (1994) Patterson J., 1994, PASP, 106, 209
- Potter et al. (2010) Potter S. B., et al., 2010, MNRAS, 402, 1161
- Revnivtsev (2008) Revnivtsev M., 2008, AIPC, 1054, 143
- Revnivtsev et al. (2009) Revnivtsev M., Churazov E., Postnov K., Tsygankov S., 2009, A&A, 507, 1211
- Revnivtsev et al. (2010) Revnivtsev M., et al., 2010, A&A, 513, A63
- Shakura & Sunyaev (1973) Shakura N. I., Sunyaev R. A., 1973, A&A, 24, 337
- Siegel et al. (1989) Siegel N., Reinsch K., Beuermann K., Wolff E., van der Woerd H., 1989, A&A, 225, 97
- Uttley & McHardy (2001) Uttley P., McHardy I. M., 2001, MNRAS, 323, L26
- Uttley, McHardy, & Vaughan (2005) Uttley P., McHardy I. M., Vaughan S., 2005, MNRAS, 359, 345
- van Paradijs & McClintock (1994) van Paradijs J., McClintock J. E., 1994, A&A, 290, 133