Mapping of the cosmic ray events related to the solar activity for the period 2003-2005
Abstract
The relationship between cosmic ray intensity decreases and solar events is still an open field of space research. In this work a complete study of solar events occurred from January 2003 to December 2005, is considered. This three-years time period characterized by an unexpected activity of the Sun was divided into 27-day intervals starting from BR 2313 (06.01.2003) to 2353 (21.12.2005), generating diagrams of the cosmic ray intensity data recorded at the Athens Neutron Monitor Station. This station is working at an altitude of 260m and cut-off rigidity 8.53GV provided to the Internet high-resolution data in real-time. A mapping of all available solar and interplanetary events, such as solar flares with importance M and X, coronal mass ejections (Halo and Partial) was done. As we are going down from the solar maximum to the declining phase of the 23rd solar cycle, a statistical overview of the corresponding relationship among these phenomena, the significant percentage of the connection of Halo CMEs and solar flares and the respective connection to Forbush decreases on yearly and monthly basis are discussed. The close association, as well as a probable quantitative analysis, between solar events is being denoted. The role of extreme solar events occurred in October / November 2003 and January 2005 is also discussed. Obtained results may be useful for predictions of transient solar events and space weather forecasting.
Nuclear and Particle Physics Section, National and Kapodistrian University of Athens, Pan/polis 15771 Athens Greece
1. Introduction
2. Data selection
Cosmic ray measurements in Athens initiated in November 2000 with a standard super 6NM-64 neutron monitor (Mavromichalaki et al., 2009).
Athens NM data are available in the on-line database at: http://cosray.phys.uoa.gr.
CME Lists of the U.S. Naval Research Laboratory (NRL) on the Large Angle and Spectrometric Coronagraph (LASCO) are used.
These lists represent a subset of the final LASCO dataset and can be accessed through the web at the site: http://cdaw.gsfc.nasa.gov/.
Data for solar flares were taken from:
http://www.
ngdc.noaa.gov/stp/SOLAR/ftpsolarflares.html.
3. Mapping of Solar Activity on CR data
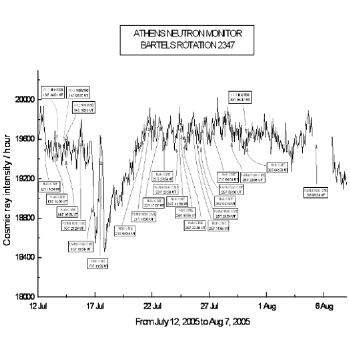
On the constructed diagrams all available data, such as: time of first observation, date the event occurred and its co-ordinates are recorded (Fig. 1). In this way an overall statistical picture of the relation between CMEs, SFs and FD is presented.
4. Discussion
References
- Cane, (2000) Cane H., 2000, Space Scie. Rev., 93, 55
- Mavromichalaki et al., (2005) Mavromichalaki H., Papaioannou A., Petrides A., Assimakopoulos V., Sarlanis C., Souvatzoglou G., 2005, JIMPA, 1, 6714
- Mavromichalaki et al., (2009) Mavromichalaki H., Gerontidou M., Mariatos G., Papailiou M., Papaioannou A., Plainaki C., Sarlanis C., Souvatzoglou G., 2009, Adv. Space Res., 44, 1237
- Papaioannou et al., (2009a) Papaioannou A., Mavromichalaki H., Erosheno E., Belov A., Oleneva V., 2009a, An. Geophys., 27, 1
- Papaioannou et al., (2009b) Papaioannou A., Belov A., Mavromichalaki H.,Eroshenko E., Oleneva V., 2009b, Adv. Space Res., 43, 582