Defect Induced Resonances and Magnetic Patterns in Graphene
Abstract
We investigate the effects of point and line defects in monolayer graphene within the framework of the Hubbard model, using a self-consistent mean field theory. These defects are found to induce characteristic patterns into the electronic density of states and cause non-uniform distributions of magnetic moments in the vicinity of the impurity sites. Specifically, defect induced resonances in the local density of states are observed at energies close to the Dirac points. The magnitudes of the frequencies of these resonance states are shown to decrease with the strength of the scattering potential, whereas their amplitudes decay algebraically with increasing distance from the defect. For the case of defect clusters, we observe that with increasing defect cluster size the local magnetic moments in the vicinity of the cluster center are strongly enhanced. Furthermore, non-trivial impurity induced magnetic patterns are observed in the presence of line defects: zigzag line defects are found to introduce stronger-amplitude magnetic patterns than armchair line defects. When the scattering strength of these topological defects is increased, the induced patterns of magnetic moments become more strongly localized.
pacs:
I introduction
In situ formation of atomic size defects has recently been observed in graphene layers, using transmission electron microscopy.H04 Specifically, it was demonstrated that certain topological defects can be induced by irradiation with electrons beams, thus raising the possibility that more complex impurity structures, such as specifically tailored line defects, can in principle be achieved using similar experimental techniques. The effects of such designer impurity structures on the nanoscale are interesting, as they can have profound effects on the electronic properties of the material. Similar to anisotropic superconductors, graphene is known to have a reduced electronic phase space close to its Fermi surface, resulting in a linear low-energy density of states.AVB06 For the case of unconventional superconductors, the introduction of such defects has been shown to have profound consequences, such as formation of low-energy bound states (or quasi-bound states) and localization of quasiparticles.SH00 In this paper we show that these features have an analogue in metallic graphene, in particular when magnetic fluctuations are taken into account.
The effects of impurities in graphene are of particular interest because their presence has been shown to strongly reduce the otherwise remarkably high electronic mobility in this compoundFS07 ; SA07 and to change its electronic band structureRNC06 ; HS10 . Furthermore, impurity induced local puddles of charge carriers have been proposed to be responsible for the observed minimum conductivity.SA07 Very recently, impurity induced bound states have been experimentally observed using scanning tunneling microscopy. MMU10 Specifically, it was shown that the tunneling current amplitude of these single impurity bound states decays inversely with the square of the distance from the defect. Because of this algebraic dependence, they are in fact quasi-bound states. It was also suggested that such defects induce local magnetic momentsHS10 ; ADH10 , which in turn can cause global ferromagnetic instabilities with a transition temperature that scales as the square root of the impurity concentration. MMU10
A number of properties of graphene sheets with point impurities have already been established VMP06 ; MMU10 ; OVY07 ; NMRP06 . In particular, in a recent experiment extended one-dimensional defects were realized JL10 , demonstrating that the creation of designer defects in graphene sheets is becoming realistic. In this paper, we investigate the effects of such topological defects on the local densities of state and on the magnetization patterns. Specifically, we study the impurity-doped Hubbard modelNMRP04 on a graphene sheet geometry, where we consider the cases of single impurities and one-dimensional impurity clusters.
This manuscript is organized as follows. In the following section, we discuss the model, the approximations used, and the quantities we investigate. In the subsequent section, we show results for the induced density of states and for the magnetization in the impurity doped Hubbard model. We conclude with a section summarizing our results and discussing possible experimental implications.
II Model
We consider the Hubbard model in the presence of non-magnetic impurities, given by the Hamiltonian
| (1) |
where the sums extend over the two-dimensional honeycomb lattice t=-2.7eV is the orbital hopping integral, and are electron creation and annihilation operators respectively. The second term denotes the on-site Coulomb repulsion, where is the number operator. The third term describes the scattering of the electrons by local defects. When a strong impurity, such as a vacancy, is created, the scattering strength goes towards infinity. In the following, we treat this model within a mean field approximation, i.e. the Coulomb repulsion term is approximated as
| (2) |
We choose U=1.2t, leading to a semi-metallic phase with a conical dispersion, as observed in graphene. This parameter choice is below the critical value FS07 ; SA07 at which there is a quantum phase transition to an antiferromagnetic insulating phase. The mean charge density is computed self-consistently from
| (3) |
where is the local electronic density of states, and is the Fermi function. This self-consistent solution provides the local densities of states and the spin densities on each atom. The calculations discussed in the following section are performed in real space on finite 960-site honeycomb lattices.
III Results and discussion
III.1 Single vacancy
Let us start by considering the effects of a single impurity in graphene. Fig. 1(a) shows the calculated zero-energy local density of states for a graphene sheet in the vicinity of a vacancy. A localized state is observed to form in the vicinity of the defect site, as has been reported previouslyVMP08 ; VMP06 , with a characteristic triangular spatial pattern that is commensurate with the lattice symmetry. For the parameters chosen here, i.e. (corresponding to a vacancy), the energy of the induced bound state is at -0.1eV. In Fig. 1(b), we compare the local densities of states at a site next to the vacancy and at another site far away from it. The bound state is clearly absent in the latter case, which instead shows the well known Dirac cone shape. Note that the linear dispersion is slightly smeared out by the finite broadening (/t=0.083) obtained as the delta functions in are replaced by Lorentzians.
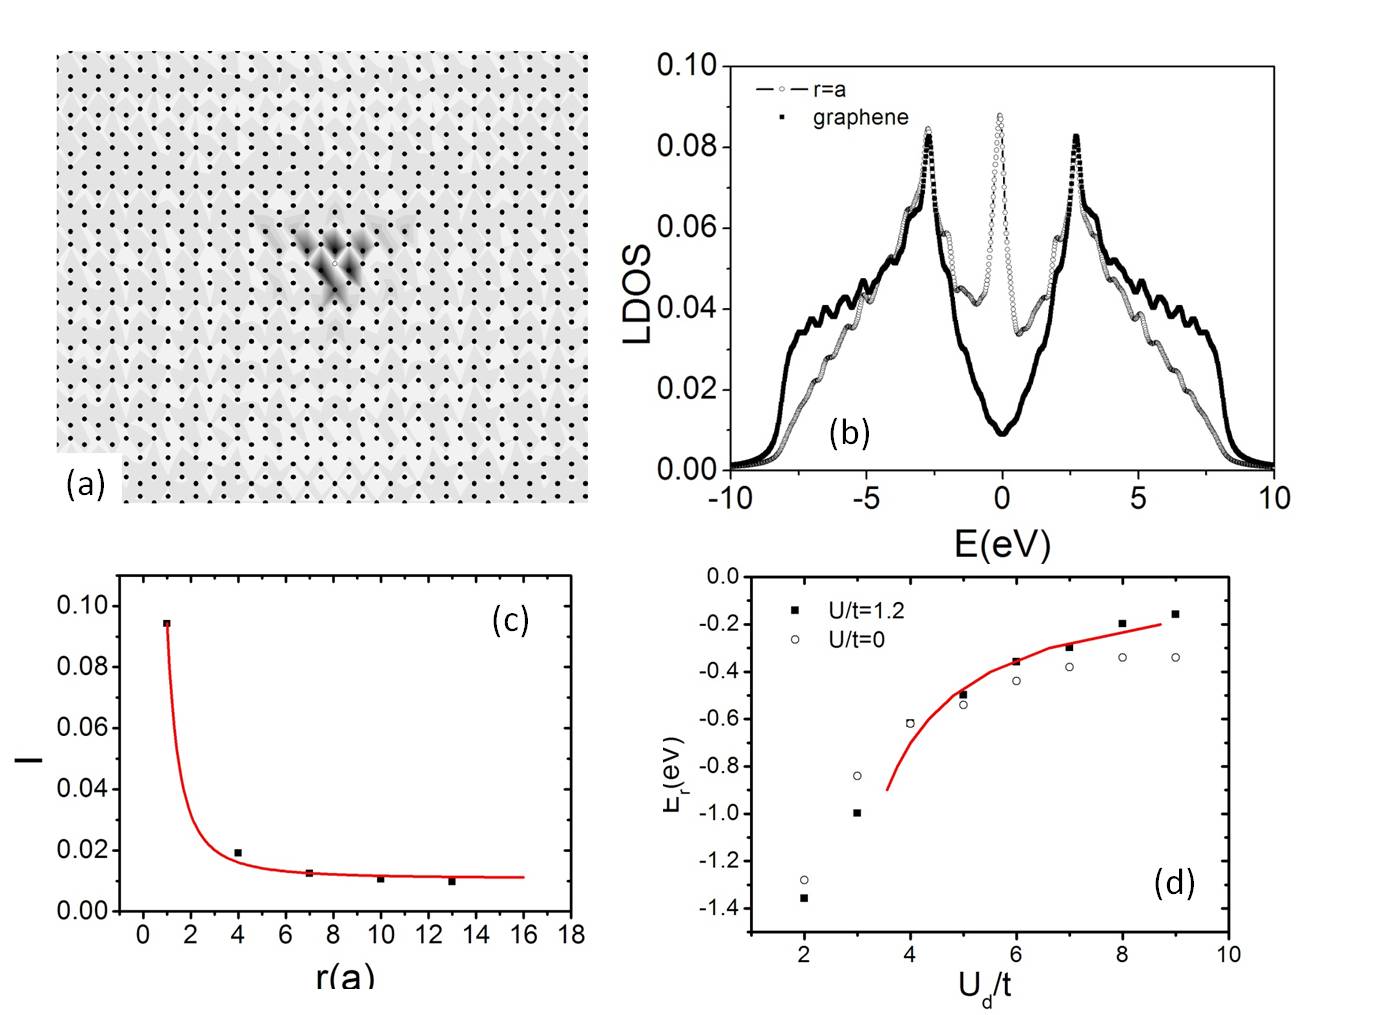
Next we examine the spatial decay of the amplitude of the defect induced bound state. As observed in Fig. 1(c), the magnitude of the impurity peak can be fitted well by a power law proportional to the squared inverse of the distance from the vacancy, which originates from the r-1 decay of the bound state wave functionVMP06 , and which is hence actually a quasi-bound state with power-law decay. This is the same algebraic decay which has recently been reported by scanning tunneling experimentsMMU10 . Furthermore, similar power-law decay has been observed for quasi-bound states around non-magnetic impurities in anisotropic superconductors along certain directionsAVB95 . In Fig. 1(d), we study the dependence of the resonance energy on the magnitude of the impurity scattering strength. The observed dependence is in agreement with the resonant scattering behavior reported by Skrypnyk et. al.YVS06 and Wehling et. al TOW07 , i.e. with the resonance energy () satisfying
| (4) |
where W is the bandwidth. When a vacancy is created, is infinite, and the resonance peak is close to the Dirac point. A fit to the asymptotic behavior in the strong coupling regime indicates that for the present case the bandwidth is 5.6eV.note When the on-site Coulomb repulsion U/t is increased, we find that the resonance peak continues to follow the same dependence as in Fig.1(d). The fit shown here is only for the regime of scattering strengths larger than .
III.2 Line vacancies
Next, let us examine the effects of more extended defects in graphene on the electronic density of states. In Fig. 2 we study the local density of states in the vicinity of a zigzag line defect, consisting of 13 contiguous vacancies in a graphene sheet. The Hamiltonian parameters are chosen to be the same as for the point defect discussed above. Similar to the case of a single vacancy, we observe that the local density of states shows a pronounced low-energy peak close to the impurity, indicating localization of the charge carriers. As expected, the amplitude of this induced resonance peak in the local density of states is enhanced with respect to the case of a single impurity. For example, at the central site next to the line defect for the given parameters it is amplified approximately by a factor of 2.2, a direct consequence of constructive interference of the joint point defects. Furthermore, we find that the spatial decay in the local density states at the Dirac point is the same as for the point defect when moving away from the line defect in a perpendicular direction. As shown in the upper inset of Fig. 2(a), it falls off with an inverse square power law along the path indicated in the lower inset.
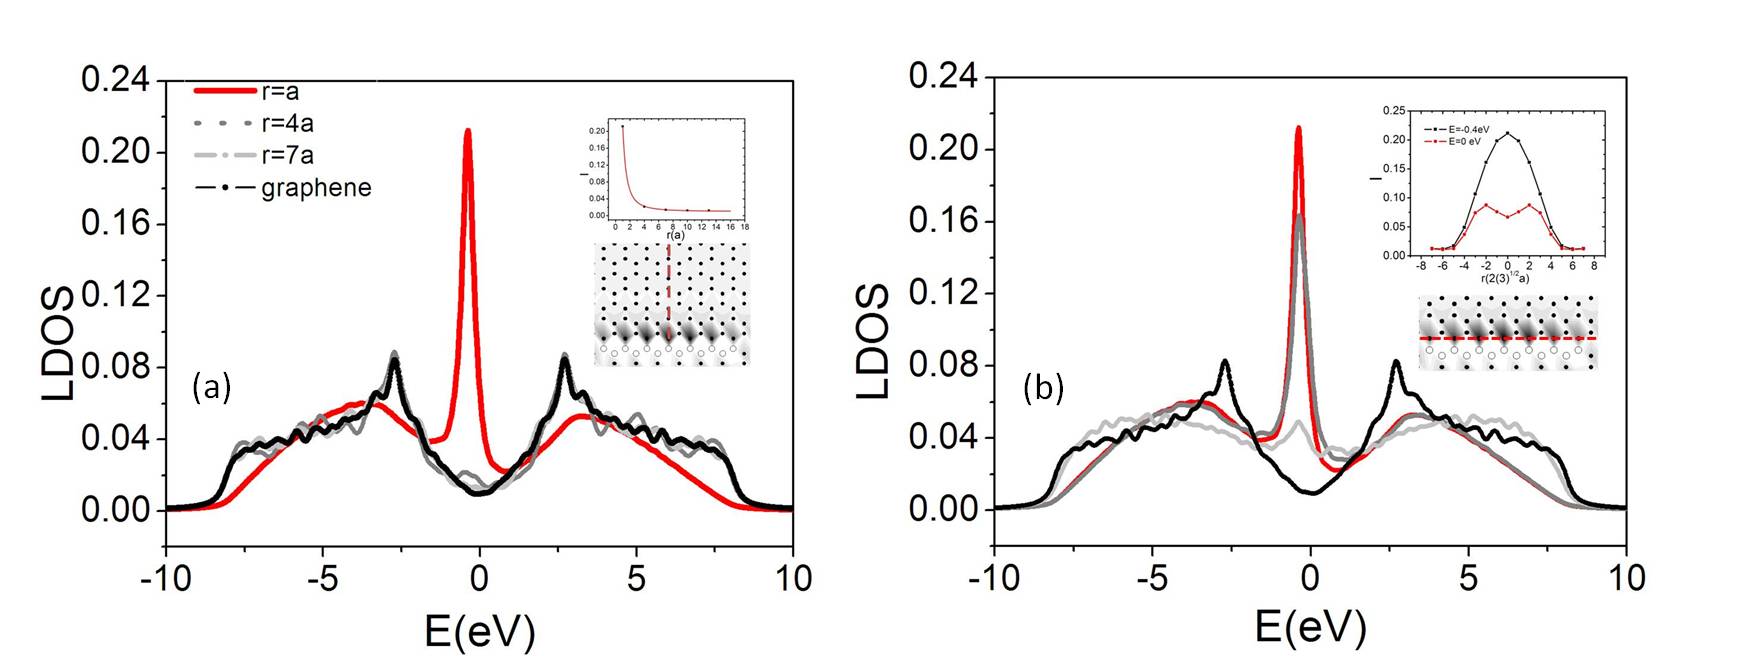
In contrast, the zero energy local density of states parallel to the line defect does not behave monotonically. In Fig. 2(b), we plot the local density of states along a path parallel to the line defect. It is evident that the magnitude of the defect induced bound state varies by two orders of magnitude along this cut. Furthermore, in contrast to the perpendicular direction, an M shaped dependence in is observed, indicating destructive interference close to the center of the defect, and maxima at two non-trivial positions along the parallel cut. At the resonance energy, on the other hand, (E) shows Gaussian behavior, with the maximum located at the center of the impurity cluster, indicating constructive interference.
III.3 Impurity clusters and random defects
The shape and size of impurity clusters is known to profoundly affect the conductivity in the graphene sheet. In particular, it is believed that the carrier concentration is dramatically modified by the presence of extended defects in the systemAA09 . Here we examine the specific case of one-dimensional zigzag vacancy clusters with variable length. In Fig. 3, the effects of defect cluster size on the local and global density of states are shown, using the same parameter choices as in the previous sections.
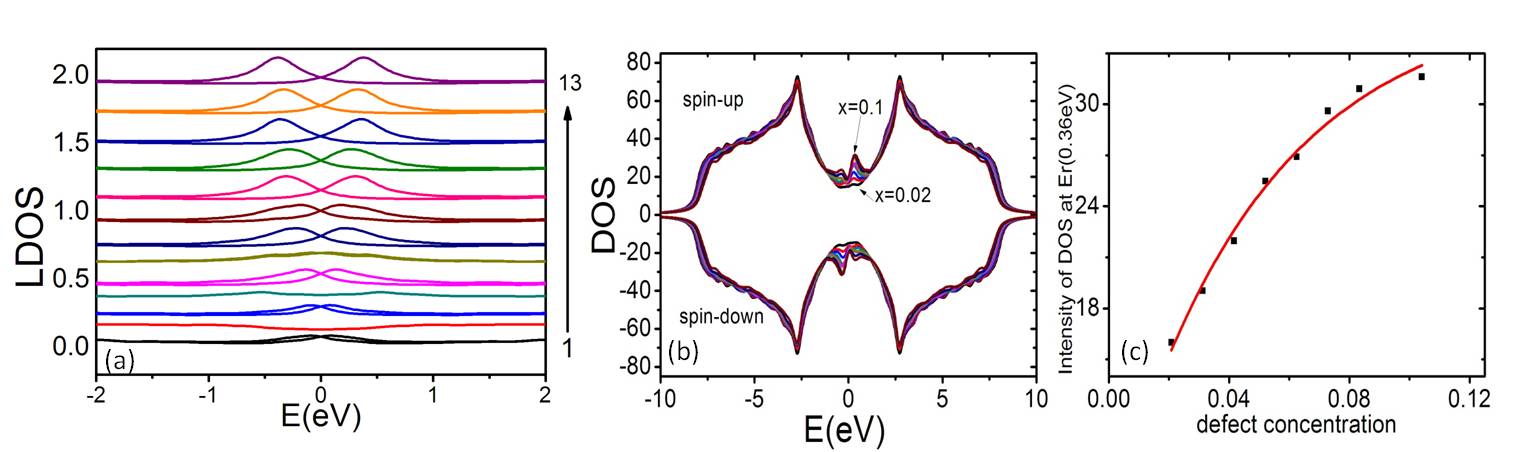
As seen in Fig. 3(a), when the number of vacancy sites (nd) in the impurity cluster is gradually increased from 1 to 13, a significant feature in the local density of states is that the intensity of the resonance peaks is enhanced due to the formation of an impurity band in the vicinity of the Dirac point. This is in agreement with a prediction of Pereira et. al.VMP06 . Second, the spin-up resonance is blue-shifted with increasing size of the impurity cluster, whereas the spin-down resonance is red-shifted. This is due to the presence of on-site Coulomb interactions, leading to stronger spin polarization in the vicinity of vacancies cluster, as we will discuss in the following section. Notice also that the resonance peaks are not present in the smallest impurity clusters with nd=2 and 4, reflecting the absence of induced local magnetic moments. This striking effect, which is visible only in the smallest impurity clusters, is due to the cancellation of defect induced spin-polarized bound states, in agreement with an observation recently reported by Kumazaki et. al.HK08
Next, we focus on the case where vacancies are randomly distributed within in the graphene sheet. Fig. 3(b) shows the global density of states as a function of defect concentration. In the low-energy region, the intensity of the resonance peak (E0.36 eV) is found to be significantly enhanced with increasing defect concentration. This indicates that this feature in the global density of states is not just a simple superposition of the local density of states surrounding the vacancies. The space between the vacancies is reduced when the defect concentration increased, and the contributions from the localized states are therefore reduced. This implies that a maximum conductivity will be observed when a critical defect concentration is formed in the graphene sheet. Notice that, another relatively small resonance peak located at E-0.36 eV, which originates from the uneven number of spin up and spin down electrons in the system, resulting from the random distribution of vacancies sites. In the high energy region, a softening of the van Hove singularity located at and development of Lifshitz tails at the band edge are induced by increasing the defect concentrationVMP08 .
III.4 Magnetic patterns
Next, we examine the magnetic patterns induced by defects. Within the self-consistent mean field calculation the numbers of spin-up and spin-down electrons are fixed during the iteration process, whereas the total number of electrons is kept equal to the number of carbon atoms. As the honeycomb lattice of graphene is composed of two sublattices, containing atoms A and B, the presence of a single vacancy defect implies that the numbers of A atoms (NA) and B atoms (NB) are not equal. Therefore magnetic moments are induced, consistent with Lieb’s theoremLieb , i.e. the total spin of the ground state is S = (NA -NB)/2.
Let us first examine the magnetic pattern in a graphene sheet induced by a single defect, shown in Fig.4(a). The total magnetic moment in this case is 0.5/960, since only one A atom in the 960-site sheet is missing. The magnetic moment is localized around the vacancy resembling the LDOS shown in Fig. 1(a). If the vacancy is introduced into the A sublattice, the magnitude of the induced magnetic moment in the at B sublattice is larger than in the A sublattice with a maximum value and . This indicates that the effective magnetic interaction between spins in opposite sublattices is antiferromagnetic, and the interaction between spins on the same sublattice is ferromagnetic. MPL09 ; HK08 ; AMB10 ; Moh .
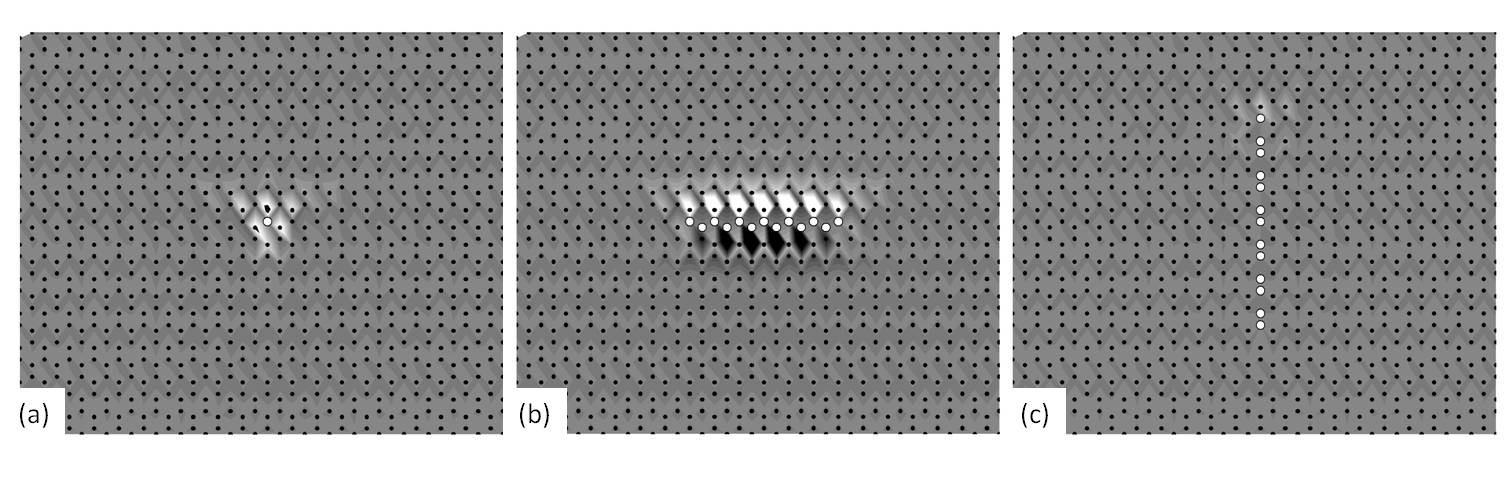
When a zigzag type line defect is introduced, a pronounced localized magnetic pattern is formed close to the defect, as observed in Fig.4(b). For example, when taking out 7 A atoms and 6 B atoms, the induced magnetic moment magnitudes in the B sublattice are larger than the A sublattice with maximum impurity induced magnetic moment and . Although the total magnetic moment remains 0.5/960, the local magnetic moment is 2.6 times larger than for a single vacancy in the spin-down case and 16.6 times larger for the spin-up case. This can be understood by comparing the intensities of the LDOS resonance peaks in these cases. The magnetic moment shows a spatial Gaussian shape, following the resonance in the local density of states shown in Fig. 2(b).
Fig.4(c) shows the impurity induced magnetic pattern of a graphene sheet in the presence of an armchair line defect. Compared to the zigzag line defect and the single defect, the induced local magnetic moment is much weaker. This indicates the absence of impurity bound states in the vicinity of armchair line defects and armchair edges, as also reported in previous workWk99 .
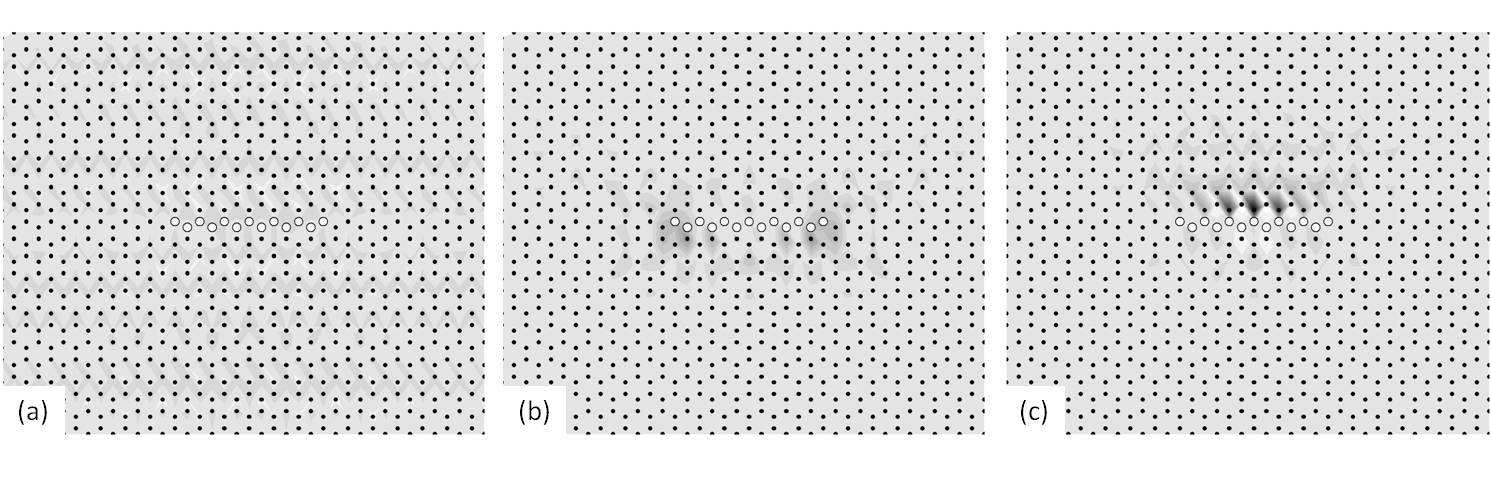
So far, we have focused on the limit of very strong impurity scattering, corresponding to vacancy defects. When these vacancy sites are replaced by impurity atoms, the resulting scattering strengths are typically smaller, i.e. of the order . In Fig. 5, we study the evolution of the magnetic patterns induced by a zigzag line defect as a function of increasing impurity scattering strength, while leaving U/t=1.2.
Examining the spatial structure of these magnetic patterns, we observe that they become more localized with increasing impurity scattering strength, which is expected. More interesting, however, is the evolution of these patterns. For weak impurity scattering ()=1, the local magnetic moment is not strongly localized around the impurity sites. When the scattering strength is increased to , the local magnetic moment localizes more strongly around the edge of the impurity cluster with maximum induced magnetic moment are and . For even stronger scattering, i.e. the local magnetic moment localizes close to the center of impurity cluster, with maximum induced magnetic moment are and . A Gaussian shape along the direction parallel to the zigzag defect is observed, which was already seen in Fig.4(b) for the case when tends to infinity. When the scattering strength of impurity increased, a stronger localized state is formed around the impurity sites, and hence a stronger local magnetic moment.
IV conclusion
In summary, we have studied the effects of point, zigzag and armchair line defects on the electronic and magnetic structure in graphene sheets, using a self-consistent numerical solution of the mea- field Hubbard model on a two-dimensional honeycomb lattice. In the vicinity of point and zigzag defects, we observe pronounced impurity induced scattering resonances in the electronic density of states, which are largely absent for armchair line defects. In the case of a point vacancy defect, the amplitude of the impurity induced local density of states is found to decay inversely proportional to , and its frequency is observed to converge as with increasing impurity scattering strength. The local electronic density of states around zigzag line defects is found to be strongly enhanced as well. The amplitudes of the impurity induced scattering resonances decay with a power law similar to the case of a point defect, and otherwise their spatial dependence is rather featureless, with the exception of a local minimum in the local electronic density of states appearing near the center of zigzag line defects, indicating destructive interference. For linear clusters of impurities, we observe that the induced local magnetic moments are enhanced close to the center of the line defect, indicating the formation of spin polarized localized states. Furthermore, for the case of randomly placed defects, we find that maximum conductivity can be achieved at a non-trivial critical defect concentration. Strong impurity-induced magnetic patterns are also observed in the vicinity of point defects and zigzag line defects. For the case of point defects, a threefold symmetric magnetic pattern is observed. In the case of zigzag line defects, the amplitudes of the defect induced magnetic moments are strongest at the center of the line defect and weaker at its ends. Generally, the impurity induced magnetic patterns of the zigzag line defect display a Gaussian spatial pattern along the direction of the line. This strong orientational magnetic pattern is found to persist down to fairly small impurity scattering strengths of , below which the induced patterns become more uniform.
Acknowledgements.
We would like to thank B. Normand, Tim Wehling, and Z. Y. Ming for useful discussions. Computing facilities were generously provided by the University of Southern California High-Performance Supercomputing Center. Furthermore, we acknowledge financial support by the Department of Energy under grant DE-FG02-05ER46240.References
- (1) Ayako Hashimoto, Kazu Suenaga, Alexandre Gloter, Koki Urita and Sumio Iijima, Nature 430, 870 (2004); K.F. Kelly and N.J. Halas, Surf. Sci,. 416, L1085 (1998); Min Ouyang, Jin-Lin Huang, Chin Li Cheung, and Charles M. Lieber, Science 291, 97(2001).
- (2) A. V. Balatsky, I. Vekhter, and J.-X. Zhu, Rev. Mod. Phys. 78, 373 (2006).
- (3) S. Haas and K. Maki, Phys. Rev. Lett. 85, 2172 (2000).
- (4) F. Schedin, A. K. Geim, S. V. Morozov, E. W. Hill, P. Blake, M. I. Katsnelson, and K. S. Novoselov, Nature Mater 6 (9), 652 (2007).
- (5) Shaffique Adam, E. H. Hwang, V. M. Galitski, and S. Das Sarma, Proc. Nat. Acad. Sci. USA 104 (47), 18392(2007).
- (6) R. N. Costa Filho, G. A. Farias, and F. M. Peeters, Phys. Rev. B 76, 193409 (2007).
- (7) H. Scedilahin, C. Ataca, and S. Ciraci, Phys. Rev. B 81, 205417(2010); H.Scedilahin, C. Ataca, and S. Ciraci, Appl. Phys. Lett. 95, 222510 (2009).
- (8) M. M. Ugeda, I. Brihuega, F. Guinea, and J. M. Gómez-Rodríguez , Phys. Rev. Lett. 104, 096804 (2010).
- (9) A. D. Hernndez-Nieves, B. Partoens, and F. M. Peeters, arXiv:1009.2026.
- (10) O. V. Yazyev and L. Helm, Phys. Rev. B 75, 125408 (2007); O. V. Yazyev, Rep. Prog. Phys. 73, 056501 (2010); O. V. Yazyev, Phys. Rev. Lett. 101, 037203 (2008).
- (11) V. M. Pereira, F. Guinea, J. M. B. Lopes dos Santos, N. M. R. Peres, and A. H. CastronbspNeto, Phys. Rev. Lett. 96, 036801 (2006).
- (12) N. M. R. Peres, F. Guinea, and A. H. Castro Neto, Phys. Rev. B 73, 125411 (2006);N. M. R. Peres, Rev. Mod. Phys. 82, 2673(2010).
- (13) J. Lahiri, Y. Lin, P. Bozkurt, I. I. Oleynik, and M. Batzill, Nature Nanotech. 5, 326(2010).
- (14) N. M. R. Peres, M. A. N. Arajo, and Daniel Bozi, Phys. Rev. B 70, 195122 (2004); M. A. N. Arajo, and N. M. R. Peres, J. Phys.: Condens. Matter 18, 1769 (2006).
- (15) V. M. Pereira, J. M. B. Lopes dos Santos, and A. H. Castro Neto, Phys. Rev. B 77, 115109 (2008).
- (16) A.V. Balatsky, M.I. Salkola and A. Rosengren, Phys. Rev. B 51, 15547 (1995).
- (17) Y. V. Skrypnyk and V. M. Loktev, Phys. Rev. B 73, 241402 (2006).
- (18) T. O. Wehling, S. Yuan, A. I. Lichtenstein, A. K. Geim, and M. I. Katsnelson, Phys. Rev. Lett. 105, 056802(2010); T. O. Wehling, A. V. Balatsky, M. I. Katsnelson, A. I. Lichtenstein, K. Scharnberg, and R. Wiesendanger, Phys. Rev. B 75, 125425 (2007).
- (19) Our fitting value W is smaller than the value reported by Wehling (6.06eV), because the impurity configuration is slightly different. In Ref TOW07 , the impurity only acts on one C-atom. In our case, the impurity is embedded in the graphene sheet which forms chemical bonds with all three nearest-neighbor carbon atoms.
- (20) K. Wakabayashi, M. Fujita, H. Ajiki, and M. Sigrist, Phys. Rev. B 59, 8271 (1999).
- (21) M. A. H. Vozmediano, oacute, M. P. pez-Sancho, T. Stauber, and F. Guinea, Phys. Rev. B, 72, 155121 (2005).
- (22) K. W. Mitsutaka Fujita, Kyoko Nakada and Koichi Kusakabe, J. Phys. Soc. Jpn. 65, 1920 (1996).
- (23) A. Arndt, D. Spoddig, P. Esquinazi, J. Barzola-Quiquia, S. Dusari, and T. Butz, Phys. Rev. B, 80, 195402 (2009).
- (24) MaríP. Lóez-Sancho, Fernando de Juan, and María A. H. Vozmediano, Phys. Rev. B, 79, 075413 (2009).
- (25) Hideki Kumazaki and Dai Hirashima, J. Phys. Soc. Jpn. 76, 064723 (2007), Physica E 40, 1703 (2007), Physica, Low Temp. Phys. 34 (2008).
- (26) E. H. Lieb, Phys. Rev. Lett. 62, 1201 (1989).
- (27) A. M. Black-Schaffer, Phys. Rev. B 81, 205416(2010).
- (28) M. Sherafati and S. Satpathy, arXiv:1008.4834v1.
- (29) The slight top-bottom asymmetries observed at the boundaries of Figs. 5(a)-(c) are due to finite size effects. In order to apply periodic boundary conditions to the zigzag edges of the fonote lattice, we had to choose an even number of lines along the zigzag direction. In this case, the line defect cannot be perfectly centered, thus giving rise to the slightly non-symmetric magnetic pattern.