01
11email: giampaolo.piotto@unipd.it, valerio.nascimbeni@unipd.it 22institutetext: Space Telescope Science Institute, 3700 San Martin Drive, Baltimore, MD 21218
22email: bedin@stsci.edu 33institutetext: Astronomical Observatory of the Autonomous Region of the Aosta Valley, Loc. Lignan 39, 11020 Nus (AO), Italy 33email: mario.damasso@studenti.unipd.it
V. Nascimbeni
TASTE: The Asiago Survey for Timing
transit variations of Exoplanets
Abstract
A promising method to detect earth-sized exoplanets is the timing analysis of a known transit. The technique allows a search for variations in transit duration or center induced by the perturbation of a third body, e.g. a second planet or an exomoon. To this aim, TASTE (The Asiago Survey for Timing transit variations of Exoplanets) project will collect high-precision, short-cadence light curves for a selected sample of transits by using imaging differential photometry at the Asiago 1.82m telescope. The first light curves show that our project can already provide a competitive timing accuracy, as well as a significant improvement over the orbital parameters. We derived refined ephemerides for HAT-P-3b and HAT-P-14b with only one transit each, thanks to a timing accuracy of 11 and 25 s, respectively.
keywords:
techniques: photometric – stars: planetary systems – stars: individual: HAT-P-14, HAT-P-31 Introduction
The transit of an exoplanet over the disk of its parent star gives us the opportunity of a nearly complete characterization of system, by measuring orbital and physical parameters such as the orbital inclination , the planetary radius , and hence the density of the planet. Also, a focused follow-up of a transiting planet can reveal a second planet in the system, following the Transit Time Variation (TTV) technique.
Holman & Murray (2005) showed that the presence of a perturbing body (not necessarily transiting) breaks the strict periodicity of the primary planet, leading to predictable departures of the observed transit times from the computed mean ephemeris. The amplitude of the TTV is dependent upon the mass of the perturber (more massive planets leading to a bigger effect) and is strongly enhanced if the hidden planet is locked in a low-order orbital resonance with the primary, like 1:2 or 2:3 (Agol et al., 2005). In that case, even a terrestrial planet could be responsible for a TTV of the order of tens or hundreds of seconds. The Transit Duration Variation (TDV) analysis is a newer technique. A periodic change of the transit duration may arise from the presence of a satellite, or exomoon, which makes the planet oscillate around the planet-satellite barycenter along its path (Kipping, 2009).
Many projects about TTV/TDV analysis are currently ongoing, the most notable being RISE (Gibson et al., 2009) and the Transit Light Curve Project (Holman et al., 2006). Most of these works use an instrumental setup which is specifically designed to get high-precision light curves with a short cadence – sometimes a few seconds. Systematic trends have to be carefully identified and corrected, because they can mimick a fake TTV (Pont et al., 2006; Gibson et al., 2009). Achieving a demonstrated timing accuracy 10 s is still an ambitious target, typical values ranging from 15 to 30 s in the best works.
Our primary aim is to collect a database of high-precision light curves which will be suitable for a simultaneous TTV/TDV analysis, optimizing every task from the observation/calibration setup to the data extraction with fully home-made software tools, optimized for this specific program. Our survey is based on data collected with the 1.82m telescope at the Asiago observatory111http://www.pd.astro.it/asiago/. Some feasibility tests were also performed with the 0.81m telescope at the Osservatorio Astronomico della regione autonoma Valle d’Aosta222http://www.oavda.it/ (OAVdA) observatory.
2 Methods
In the typical observing conditions we deal with (variable PSFs, lack of stellar crowding) the technique of choice is differential aperture photometry, which allows us to normalize the flux of the target with the flux of one or more reference stars. The differential measure automatically cancels out first order systematic trends, like transparency variations. Bright targets are defocused to avoid saturation and to minimize systematics from flat field residual errors and guiding drifts (Southworth et al., 2009).
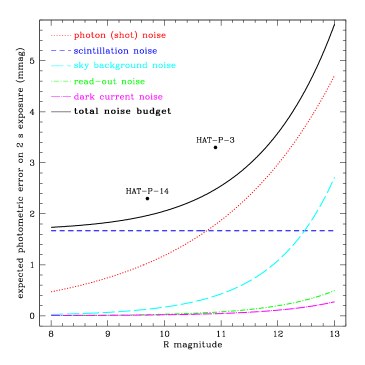
We employ as imager the Asiago Faint Object Spectrograph and Camera (AFOSC), a focal-reducer type camera with a 8.5′8.5′ field of view. AFOSC has been recently upgraded with a new E2V 42-20 thinned, back-illuminated CCD (QE90% in the band). The tests we carried out demonstrate that the detector is very stable, with low read-out noise and dark current. The shutter is accurate down to 1 s of exposure time. The camera controller software has been customized to meet our needs for a very fast time sampling. 44 binning is used to lower the readout time and decrease the readout noise. We read a CCD sub-array when only a part of the field is necessary. A big effort has been devoted to shorten as much as possible the dead technical time between consecutive frames. An assessment of the expected S/N ratio shows that, in typical conditions, our photometry is dominated by scintillation for the brighter stars (11) and by photon noise for the fainter stars (11). We expect for most of our targets a scatter 3 mmag on a single 2 s exposure (Fig. 1).
In order to extract the maximal information from the available data, we implemented and use independent software tools specifically developed for this project. The key concept of our pipeline is a fully empirical approach to perform every task, including pre-processing, light curve extraction, and estimate of the transit parameters along with their associated errors. The first half of the pipeline, concerning the extraction of the light curves (STARSKY) is already operative. The algorithms we have implemented are described in a forthcoming paper (Nascimbeni et al. submitted). We rely on the JKTEBOP code (Southworth et al., 2004) to fit a model on our light curves. JKTEBOP includes routines for the empirical estimation of the errors associated to the fitted parameters.
3 First results
Our survey already began to gather data. A sample of twelve targets has been selected, based on both observational and astrophysical criteria. An higher priority has been set for planets which would show the biggest TDV/TDV signal by a 1 perturber in a 2:1 resonant external orbit and by a 1 exomoon at one third of the Hill radius. Targets such as WASP-3b were included because of an existing TTV claim (Maciejewski et al. 2010).
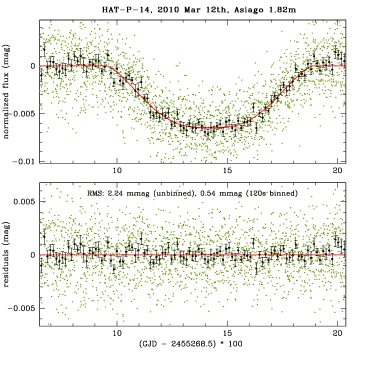
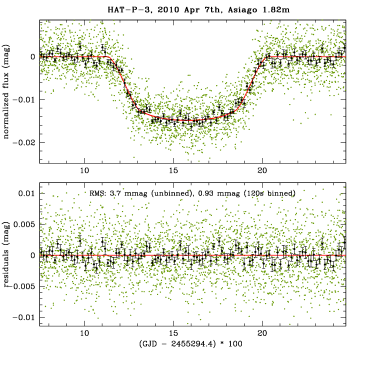
We report the first collected light curves for HAT-P-14b and HAT-P-3b (Torres et al., 2010, 2007), which are respectively the brightest, and near to the faintest magnitude limits of our surveyed sample (Fig 2). The unbinned series is made from 2,247 and 2,882 frames respectively, with a net time sampling of 5.4 and 5 s and an RMS of 2.2 and 3.7 mmag around the best-fit model. The overall photometric performances of our system met our expectations. The scatter measured on our light curves is in good agreement with the theoretical expected amount of noise, as shown in Fig. 1. In particular, the noise measured for HAT-P-14 ( mmag on 120 s bins) indicates a very low amount of systematic errors, and is of the same order achieved by state-of-the-art photometry on medium class telescopes (e.g., see Southworth et al. 2009b, with data acquired in a much better site).
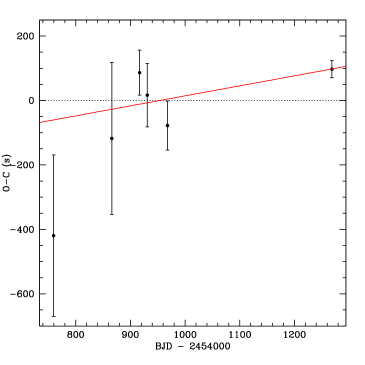
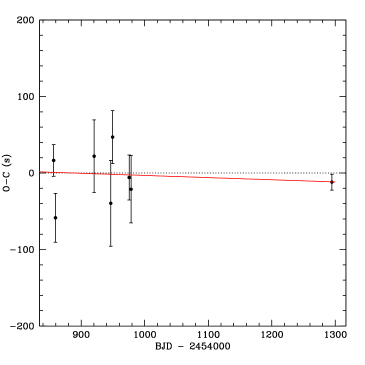
The timing accuracy achieved by our observations was assessed by different techniques. The most conservative one (a “prayer-bead” residual permutation algorithm) returned for the central instant an error of 25 s for HAT-P-14b and 11 s for HAT-P-3b. The improvement over the previous measurements is made clear by comparing their errorbars with ours in the Observed Calculated diagram for (Fig. 3). For both planets, we were able to refine the ephemeris and the orbital parameters with only one observed transit.
4 Conclusions
The performance achieved by TASTE photometry proved it to be suitable for a long-term characterization of the targets and for an extremely accurate TTV/TDV analysis. Further improvements are still possibile for the data analysis and for the duty-cycle of our series. Once a sufficient number of light curves will be collected for a given target, it should be possible to search for low-mass perturbers, and to put very stringent upper-limits in case of null detection.
Acknowledgements.
We thank M. Fiaschi for the support in the optimization for our purposes of AFOSC data acquisition software.References
- Agol et al. (2005) Agol, E., Steffen, J., Sari, R., & Clarkson, W. 2005, MNRAS, 359, 567
- Gibson et al. (2009) Gibson, N. P., Pollacco, D., Simpson, E. K., et al. 2009, ApJ, 700, 1078
- Gibson et al. (2010) Gibson, N. P., Pollacco, D. L., Barros, S., et al. 2010, MNRAS, 401, 1917
- Holman & Murray (2005) Holman, M. J. & Murray, N. W. 2005, Science, 307, 1288
- Holman et al. (2006) Holman, M. J., Winn, J. N., Latham, D. W., et al. 2006, ApJ, 652, 1715
- Kipping (2009) Kipping, D. M. 2009, MNRAS, 392, 181
- Pont et al. (2006) Pont, F., Zucker, S., & Queloz, D. 2006, MNRAS, 373, 231
- Southworth et al. (2009) Southworth, J., Hinse, T. C., Burgdorf, M. J., et al. 2009, MNRAS, 399, 287
- Southworth et al. (2004) Southworth, J., Maxted, P. F. L., & Smalley, B. 2004, MNRAS, 351, 1277
- Torres et al. (2010) Torres, G., Bakos, G. A., Hartman, J., et al. 2010, ArXiv e-prints
- Torres et al. (2007) Torres, G., Bakos, G. Á., Kovács, G., et al. 2007, ApJ, 666, L121