The Impact of Stellar Model Spectra in Disk Detection
Abstract
We present a study of the impact of different model groups in the detection of circumstellar debris disks. Almost all previous studies in this field have used kurucz (atlas9) model spectra to predict the stellar contribution to the flux at the wavelength of observation thus determining the existence of a disk excess. Only recently have other model groups or families like marcs and NextGen (phoenix) become available to the same extent as atlas9. This study aims to determine whether the predicted stellar flux of a disk target can change with the choice of model family - can a disk excess be present in the use of one model family whilst being absent from another? A simple comparison of kurucz model spectra with marcs and NextGen model spectra of identical stellar parameters was conducted and differences were present at near-infrared wavelengths. Model spectra often do not extend in wavelength to that of observation and therefore extrapolation of the spectrum is required. In extrapolation of model spectra to the Spitzer MIPS passbands, prediction of the stellar contribution differed by % at m for F, G and early K spectral types with differences increasing to % for early M dwarfs. Analysis of the Spitzer MIPS m observations of 37 F, G and K solar-like stars in the Pleiades cluster was conducted. In using kurucz model spectra, 7 disk excesses were detected while only 3 and 4 excesses were detected in using marcs and NextGen (phoenix) model spectra respectively.
1 Introduction
The study of Protoplanetary and Debris Disks is a significant area of research today. It is uncertain whether the processes which formed our own solar system are typical of other planetary systems. Both protoplanetary and debris disks describe planetary systems in the midst of formation/evolution and therefore are crucial to our understanding of planetary systems as a whole. In steady state, the mutual collisions of planetesimals replenish dust removed from the disk by radiation pressure and Poynting-Robertson drag. Planetesimals and regenerated dust around older stars describe debris disks in contrast to the first-generation dust around stars younger than 10 Myr old.
Detection of a disk may be gained if infrared emission from an object is in excess of expectation from the stellar flux. This is determined numerically by fitting a model spectrum and extrapolating out to the wavelength of observation - see the Appendix of Bryden et al. (2006) for details of this procedure. The excess ratio () is computed and detection of an infrared excess is concluded when this value exceeds the 3 limit of the entire sample (Aumann et al. (1984), Beichman et al. (2005)). In almost all past and present studies of debris disks, kurucz (ATLAS9) models (Castelli & Kurucz (2004)) are used for this procedure. Other model groups like marcs (Gustafsson et al. (2008)) and NextGen (phoenix) (Hauschildt et al. (1999)) remain largely unused and have only recently become readily available.
Standard 1D model spectra are the result of a solution of the equation of radiative transfer, the hydrostatic equation, mixing-length theory and the equations describing the gas phase in chemical equilibrium. Ideally, every possible atomic and molecular transition should be included however this is computationally impractical and simplifications are necessary. marcs and NextGen model spectra are produced using Opacity Sampling (Helling & Jørgensen (1998)) where opacities are distributed statistically in wavelength giving rise to high resolution model spectra. kurucz model spectra however are produced using Opacity Distribution Functions (ODFs) where absorption cross-sections are binned producing a smoother, lower resolution model spectrum (Gustafsson et al. (1975), Ekberg et al. (1986)). Discrepancies in line features are expected between model groups due to these different opacity treatments though such differences are not expected at the longer wavelengths at which disks are observed. The different model groups include opacities drawn from different literature. This is likely to introduce sizeable differences in the spectral appearance of the model groups; for a discussion, see Jørgensen (2003). Model spectra with identical stellar parameters but of different model families are compared in Section 2 of this paper to determine whether such differences exist. The model spectra often do not extend to longer wavelengths at which observations of disks are made therefore, fitting of a Rayleigh-Jeans tail and extrapolation to the required wavelength is necessary (Section 3). NextGen models do extend beyond m however, the sparse wavelength distribution at these wavelengths make it necessary to fit a Rayleigh-Jeans tail for interpolation onto some filter bandpass. Section 4 applies the use of all three model families to 37 solar-like stars previously analysed for disk excesses in Sierchio et al. (2010).
2 Comparison of Model Spectra
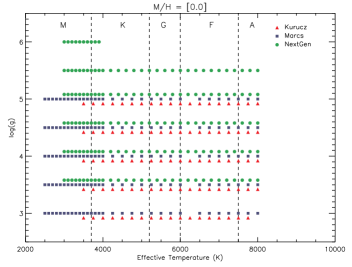
Spectra of all three model families were compiled. kurucz111http://kurucz.harvard.edu/grids.html and NextGen222ftp://phoenix.hs.uni-hamburg.de/NextGen/Spectra/ model spectra with inclusion of a microturbulence, a convective mixing length, = 1.25 and no parameterization of convective overshoot were chosen (Castelli & Kurucz (2004), Hauschildt et al. (1999)). marcs333http://marcs.astro.uu.se/search.php model spectra with identical microturbulence but (the only available at the time) convective mixing, = 1.5 were chosen (Gustafsson et al. (2008)). kurucz and NextGen model groups provide accurate synthetic SEDs of solar-like stars though kurucz better reproduces early-type stars while NextGen is more accurate in the M regime (Bertone et al. (2004)). The Marcs model group have also been shown to adequately match the stellar SEDs given their use in the photometry calibration of the Spitzer Space Telescope (Decin et al. (2004)). Fig. 1 displays the effective temperature and surface gravity combinations of all three model families. As shown, model spectra in all three families adequately span the F, G and K spectral types which dominate the stellar sample of disk surveys. Model spectra of solar metallicity are considered the most appropriate in the context of disk surveys using stellar samples of solar-like, solar neighbourhood stars which typically exhibit metallicities of [Fe/H] = 0.25 (Valenti & Fischer (2005)).
A comparison of the model spectra across the model families was conducted. A kurucz model spectra of some effective temperature, surface gravity (and solar metallicity) was compared with a marcs and NextGen model spectra with identical stellar parameters. The wavelength range and resolution differed between model families therefore interpolation (Eq. 1) was necessary. In comparing kurucz and marcs spectra, the former were interpolated onto the wavelength distribution of the latter. For comparison with NextGen models, a few short wavelength points were omitted to allow a common wavelength range and the kurucz spectra interpolated onto the NextGen wavelength distribution. A ratio of the flux (2) was computed.
| (1) |
| (2) |
where , represents the kurucz model spectrum while , represents the marcs or NextGen model spectrum where is a wavelength intermediate to and . was calculated for each set of synthetic spectra and subsequently averaged for all spectra of the F, G and K spectral types.
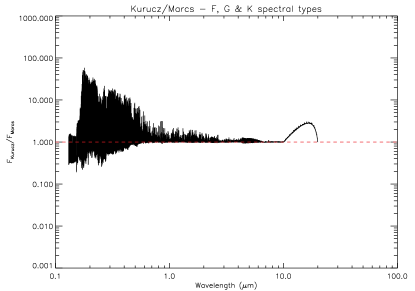
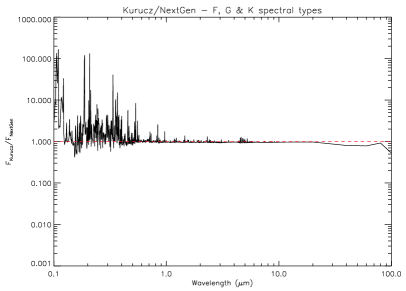
Spectral fluxes of kurucz and marcs spectra can differ by greater than an order of magnitude (Fig. 2). In particular, the poorest agreement occurs at approximately m. The trend of the flux ratio is dominated by delta-function-like features which likely are produced as a result of line features present in one model group but absent from the other. This is likely capturing the different opacity treatments. A higher level of agreement occurs between kurucz and NextGen model spectra (Fig. 2). Line features remain present, again capturing the different opacity treatments. The trends of both comparison tend to unity with increasing wavelength showing better agreement of the synthetic spectra at longer wavelengths. The best agreement is apparent for the kurucz and NextGen models while there exist some fluctuation about unity for the kurucz/marcs comparison. The bump-like feature at approximately m in the Kurucz/Marcs comparison possibly arises from differences in H- opacity, the dominant source at these wavelengths. The deviation from unity in the Kurucz/NextGen comparison arises from an unphysical anomaly present in the Kurucz T = 8000 K, log(g) = 4.5, [M/H] = 0.0 model spectrum. This feature was masked in all subsequent analysis. These differences in the model spectra has obvious implications in stellar flux prediction and finding the excess ratio from which detection of a disk is decided.
3 Extrapolation to longer wavelengths
The algebraic form of the Rayleigh-Jeans’ flux ( did not provide a good fit of the long wavelength regions of the synthetic spectra. (where is the effective temperature of the model spectrum) was offset from the synthetic spectrum by up to % at m. A simple scaling of to the synthetic spectrum did not offer a solution as the fall-off of the synthetic flux with wavelength deviated from . Such an offset and slope difference remained when the full blackbody flux was instead fit. A straight line fit of the spectrum in logarithmic space was instead conducted. Eq. 3 was fit (allowing freedom of and which minimised ) and transformed back into normal space, giving a function of the form shown in Eq. 4.
| (3) |
| (4) |
where describes the wavelength power index (approximately 4) while serves as a scale for the pattern. Significant differences in the parameters which minimised were apparent - for example, , provides a good fit for a kurucz T = 3500 K, log(g) = 4.5 and [M/H] = 0.0 model spectrum while , provides a good fit for a NextGen model spectrum with the same parameters. For each model spectrum, such a fit was performed, the spectrum extrapolated out to m and m and the flux integrated over the corresponding Spitzer MIPS passbands which are sensitive to dust emission at 1 AU and outside 10 AU from a solar-like star respectively (Rieke et al. (2004)). For each set of kurucz and marcs or NextGen model spectra identical in stellar parameters, the broadband fluxes of these passbands were compared. Fig. 3 displays a ratio of these fluxes for each set of synthetic spectra. Kurucz model spectra do not extend to the cooler effective temperatures of M dwarfs and therefore Marcs and NextGen model spectra are also compared in this way to determine the possible differences in flux prediction for such objects.
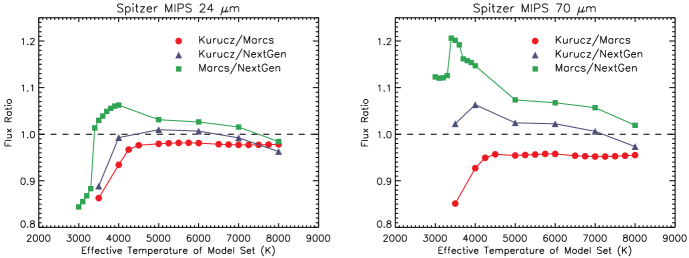
At m, the extrapolated fluxes of kurucz and marcs model spectra exhibit good agreement (of approximately 2 %) for F, G and early K spectral types. The trend deviates significantly from unity for cooler late K and early M spectral types with disagreement as high as % in kurucz and marcs spectra of 3500 K. At m, the flux ratio of kurucz and marcs model spectra is identical to that of m though it has a larger deviation from unity (approximately %). This suggests that the long wavelength regions of kurucz and marcs synthetic spectra differ in slope and therefore their log-log straight line fits (Eq. 3) diverge with wavelength. In comparison, the kurucz/NextGen trend exhibits a higher level of agreement which is consistent with Fig. 2. At m, the flux ratio almost perfectly centres on unity with large disagreement only apparent in the comparison of early M dwarfs. At m, a small deviation from unity is apparent though agreement is still true within % for F, G and K spectral types. Similarly, Marcs and NextGen model spectra of F, G and K spectral types exhibit good agreement (of approximately 4 %) at m, deviating to approximately % at m. Again, M dwarfs exhibit the worst agreement with differences as large as %. The poor agreement of M dwarf model spectra likely arises from the challenges in determining the opacity-relevant effects of molecular species present in such atmospheres (Gustafsson (1997), Jørgensen (2003), see also section 2.2 of Helling & Lucas (2009)). Observational studies have noted discrepancies between the observed and synthetic colours of such objects (Gautier et al. (2007)).
4 Analysis of 37 solar-like Pleiades stars
The possible impact in the use of different model groups in flux prediction of disk observations has so far only been inferred from comparison of the model spectra. It is therefore ideal to physically apply using all three model spectra to a set of observations.
A recent publication (Sierchio et al. (2010)) analysed the Spitzer MIPS m observations of approximately 70 stars in the Pleiades cluster. Using kurucz model spectra for prediction of the stellar flux at m, they concluded that 23 of such stars harboured disks. Using a smaller subset of their target sample (due to limitations in the available photometry) this study was reproduced using kurucz, marcs and NextGen model spectra.
Johnson B, V, R, I and 2MASS J, H, Ks photometry of each object was compiled where possible. Synthetic photometry of all spectra of all three model groups was searched and calculated in each instance. The observed and synthetic photometry differed significantly by the target distance modulus. Some targets in the Pleiades sample had known accurate (Hipparcos) distances however, for consistency and to avoid further reducing the stellar sample of the stars to those only with parallax measurements, an alternative method was decided. A mean magnitude in the above bands was calculated for both the synthetic and observed photometric magnitudes. The difference in these mean values was considered to give a value of the distance modulus. U band photometry was highly offset from longer wavelength photometry, as noted in the Appendix of Bryden et al. (2006), and was therefore omitted in this procedure. Chromospheric activity was considered to be the most likely explanation for these offsets in the U band (T. Lloyd-Evans, A. C. Cameron, private communication, 2010). Having found the synthetic spectrum in all three model families which provided the best photometry fit, the ‘distance modulus’ was added to the synthetic Spitzer MIPS m magnitude to determine the predicted flux.
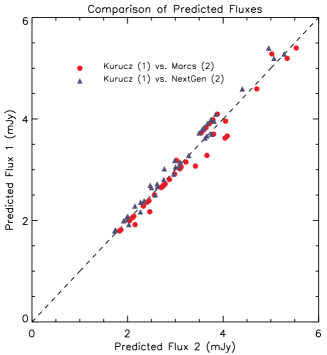
For each object, the predicted fluxes using all three model families were compared. Fig. 4 displays a plot of the predicted fluxes of the 37 objects using kurucz model spectra against that of marcs and NextGen models. As shown, the line of equality provides an adequate best-fit of each data set. Although many points lie very close to equality, there are also many outliers and therefore, flux predictions for some objects using different model families can be significantly different.
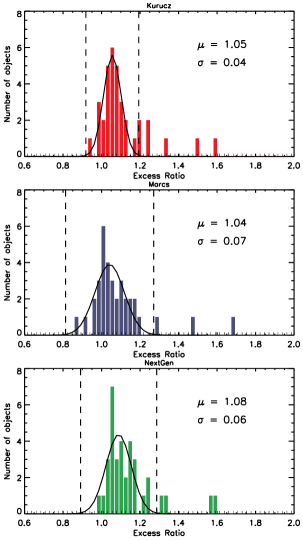
For each object, the excess ratio () was calculated forming three distributions of excess ratios for each model family. These distributions were binned and the resulting histograms are displayed in Fig. 5. As shown, the excess ratios form a gaussian-like distribution with positive outliers being candidate excesses. It is immediately apparent that these distributions are somewhat different despite representing the same sample of stars. Gaussian functions were fit to these distributions in order to gain a quantitative measure of their width and translation. A narrow distribution with a translation of describes model spectra which accurately predict the flux of the target stars. While the marcs distribution is best-centred on unity, it is the broadest of the three distributions. kurucz model spectra form the narrowest distribution while the NextGen distribution has the largest offset from unity. These offsets have been previously noted of Pleiades stars - see Fig. 4 of Gorlova et al. (2006).
Detection of an infrared excess is considered conclusive when the excess ratio of an object exceeds the upper confidence interval of the entire distribution (Sierchio et al. (2010)). Excluding AKII 437 and HII 132 (which significantly outlie), it is found that 7 objects (including 2 borderline objects) in the kurucz distribution satisfy this condition while falling to only 3 and 4 objects of the marcs and NextGen distributions respectively. There is agreement in all model families that AKIA76 ( K, determined from the B-V colour), HII 1766 ( K) and PELS 146 ( K) have disk excesses. AKII 383 ( K), PELS 20 ( K) and PELS 150 ( K) yield disk excesses in using kurucz model spectra while no excesses exist if marcs or NextGen spectra are used. In particular, the kurucz, marcs and NextGen spectra whose synthetic photometry best fit the photometry of AKII 383 have identical stellar parameters (T = 6000 K, log(g) = 4.5 , M/H = [0.0]).
5 Summary
Detection of a disk can be concluded when infrared flux is in excess of expectation from the star alone. Popularly, a model spectra is used to predict the stellar contribution and almost all previous studies in this field have used kurucz (ATLAS9) model spectra for this purpose. marcs and NextGen model spectra however have remained largely unused due to only recent availability.
An initial comparison of solar metallicity kurucz, marcs and NextGen model spectra of identical stellar parameters yielded differences as large as two orders of magnitude. In extrapolating these spectra out to longer wavelengths, prediction of Spitzer MIPS fluxes could differ by 5 % for F, G and K spectra types and as much as 15 % for early M dwarfs.
A recent publication (Sierchio et al. (2010)) studied the Spitzer MIPS m observations of 70 stars in the Pleiades cluster for possible disk excesses, using kurucz (ATLAS9) models for prediction of the stellar contribution. This analysis was initially reproduced for a subset of these stars and 7 out of 37 were determined to have disk excesses. In repeating this analysis using marcs and NextGen model spectra, only 3 and 4 disk excesses were detected respectively. The differences between the model groups are such that different disk detection rates are obtained. We encourage the use of more than one model family to determine the presence (or absence) of an infrared excess.
References
- Aumann et al. (1984) Aumann H. H., et al., 1984, ApJ, 278, L23
- Beichman et al. (2005) Beichman C. A., et al., 2005, ApJ, 622, 1160
- Bertone et al. (2004) Bertone E., Buzzoni A., Chávez M., Rodr guez-Merino L. H., 2004, AJ, 128, 829
- Bryden et al. (2006) Bryden G., et al., 2006, ApJ, 636, 1098
- Castelli & Kurucz (2004) Castelli F., Kurucz R. L., 2004, http://adsabs.harvard.edu/abs/2004astro.ph..5087C
- Decin et al. (2004) Decin L., et al., 2004, ApJS, 154, 408
- Ekberg et al. (1986) Ekberg U., Eriksson K., Gustafsson B., 1986, A&A, 167, 304
- Gautier et al. (2007) Gautier T. N., et al., 2007, ApJ, 667, 527
- Gorlova et al. (2006) Gorlova N., et al., 2006, ApJ, 649, 1028
- Gustafsson (1997) Gustafsson B., 1997, Astrophysics and Space Science, 255, 241
- Gustafsson et al. (1975) Gustafsson B., Bell R. A., Eriksson K., Nordlund A., 1975, A&A, 42, 407
- Gustafsson et al. (2008) Gustafsson B., Edvardsson B., Eriksson K., Jørgensen U. G., Nordlund ., Plez B., 2008, A&A, 486, 951
- Hauschildt et al. (1999) Hauschildt P. H., Allard F., Baron E., 1999, ApJ, 512, 377
- Helling & Jørgensen (1998) Helling C., Jørgensen U. G., 1998, A&A, 337, 477
- Helling & Lucas (2009) Helling C., Lucas W., 2009, MNRAS, 398, 985
- Jørgensen (2003) Jørgensen U. G., 2003, in Stellar Atmosphere Modeling, ASP Conference Proceedings Vol. 288. p. 303
- Rieke et al. (2004) Rieke G. H., et al., 2004, APJS, 154, 25
- Sierchio et al. (2010) Sierchio J. M., et al., 2010, ApJ, 712, 1421
- Valenti & Fischer (2005) Valenti J. A., Fischer D. A., 2005, ApJS, 159, 141