Crystal nucleation and cluster-growth kinetics
in a model glass under shear
Abstract
Crystal nucleation and growth processes induced by an externally applied shear strain in a model metallic glass are studied by means of nonequilibrium molecular dynamics simulations, in a range of temperatures. We observe that the nucleation-growth process takes place after a transient, induction regime. The critical cluster size and the lag-time associated with this induction period are determined from a mean-first passage time analysis. The laws that describe the cluster growth process are studied as a function of temperature and strain rate. A theoretical model for crystallization kinetics that includes the time-dependence for nucleation and cluster growth is developed within the framework of the Kolmogorov-Johnson-Mehl-Avrami scenario and is compared with the molecular dynamics data. Scalings for the cluster growth laws and for the crystallization kinetics are also proposed and tested. The observed nucleation rates are found to display a nonmonotonic strain rate dependency.
pacs:
46.35.+z, 05.70.Ln, 64.60.qe, 64.70.peI Introduction
The study of phase transformation between liquid and crystal through a nucleation and subsequent growth regime is a problem with a very long history Kashchiev_Nucleation ; Kelton_SolidStatePhys_1991 . Understanding the crystallization process, including the rate of phase transition and the morphology of the crystal formed, has a great importance for many technological applications. The situation becomes even more complex, when the phase transformation takes place in a system under external drive due to shear flow, electric, magnetic or laser-optical fields etc. (for a recent review see Lowen_JPCM_20_2008 ). The problem belongs then to the class of nonequilibrium processes in driven materials, which has attracted attention more recently Martin_1998 .
Numerical simulations techniques have allowed one to obtain a series of important results for the kinetics of crystallization in systems driven by an imposed shear flow Wallace_PRL_96_2006 ; Albano_JCP_122_2005 ; Blaak_PRL_93_2004 ; Butler/Harrowell_PRE_67_2003 ; Butler_JCP2003 , including glasses Mokshin/Barrat_PRE_77_2008 ; Mokshin/Barrat_JCP_130_2009 ; Duff_PRE_75_2007 , semicrystalline polymers Graham_PRL_103_2009 , colloidal suspensions Butler/Harrowell_PRE_52_1995 ; Cerda_PRE_78_2008 and Ising model Valeriani_condmat_2008 . The generally established outcome here, which confirms the experimental observations (see, e.g., Haw/Pusey_PRE_1998 ; Holmqvist_Langmuir_2005 ; Coccorullo_Macromol_41_2008 ; Koumakis_Soft_matter_2008 ), is that the shear drive can have a significant impact on the various aspects of the nonequilibrium phase transitions, in particular, on the transition, nucleation and crystal growth rates as well as on the induction time Lowen_JPCM_20_2008 ; Vermant_JPCM_17_2005 .
In terms of nucleation, the influence of a finite shear rate on the structural ordering of a system appears to be, in general, that a small shear rate speeds up nucleation, while larger shear rates prevent ordering Valeriani_condmat_2008 ; Cerda_PRE_78_2008 . Fluid-crystal coexistence can also be affected by shear, as found in Ref. Butler/Harrowell_PRE_52_1995 where crystallization is shown to be suppressed by flow. Hence, the shear flow influences both the thermodynamic and the kinetic aspects of nucleation, in a way that may depend on the depth of supercooling and on the intensity of the strain rate, presumably compared to the system internal relaxation time. For a deeply supercooled, glassy system, the relaxation time is essentially infinite, so that a finite shear rate will always have a favorable impact on nucleation.
The cluster growth process, which follows nucleation, is also expected to be affected by a finite strain rate. For a specific, Ising like, two-dimensional system, it was shown recently that a moderate shear-drive plays a significant role in crystal erosion and growth governing by single “particle” attachment and coalescence processes Valeriani_condmat_2008 ; Cerda_PRE_78_2008 . More generally, one may inquire how the domain growth law are affected by the shear rate. In systems at rest, the standard description for the apparition of a crystalline phase through nucleation and cluster growth, is generally reproduced by the classical Kolmogorov-Johnson-Mehl-Avrami (KJMA) theory Kashchiev_Nucleation . In the present work, we apply the extension of the KJMA theory for the case of the time-dependent nucleation and growth in a model metallic glass under shear drive. Extension of the theory is tested together with nonequilibrium molecular dynamics simulation data at different temperatures and wide range of shear rates. The data is compatible with the extension of the theory that includes a finite lag-time for appearance before the onset of steady state nucleation.
The numerical model used in our simulations, as well as the extended KJMA theory, are presented in sections II and III. The results of molecular dynamics simulations and parameters of the KJMA theory, in particular, the critical cluster size, the lag-time and the steady state nucleation rate, are analyzed and discussed in section IV. Finally, we present our conclusions in section V.
II Model, simulation details and cluster analysis
In this work we focus on a system of particles interacting through the spherically symmetric Dzugutov potential
| (1) | |||||
where and define the unit length and energy, respectively111For convenience, all quantities are expressed in reduced form. The time unit is , is a particle mass, the strain rate is in units of , the temperature is in units of and the pressure is in units of , where is the Boltzmann constant.. The parameters , , , , and are chosen as proposed originally in Ref. Dzugutov_PRA_46_1992 , the Heaviside step function sets the range of the various contributions in relation (1). Besides a minimum , the potential includes a maximum and falls off rapidly with the interatomic distance . Such a short-ranged, oscillating interaction mimics in a simple way the ion-ion interaction influenced by the electron screening effects in the metallic systems. Moreover, the maximum in potential (1) reflects the first of the Friedel oscillations and favors icosahedral local order in the system, therefore making it a good glass-former at low pressure Dzugutov_PRL_1993 .
The system under study and the simulation setup are completely identical to the considered one in Ref. Mokshin/Barrat_JCP_130_2009 . Namely, the system consists of particles within the simulation box with that corresponds to the density . A set of glassy samples is prepared by fast cooling from the equilibrated liquid state to the temperatures , and that is well below the melting point Simdyankin_JNCS_2001 .
The shear drive is applied by moving two amorphous walls created at the sides of the simulation cell perpendicular to the direction. The bottom wall is fixed, whereas the top wall is moving in the -direction with the instantaneous velocity at a constant strain rate and pressure , which in the equilibrium phase diagram would favor the fcc phase. Here is the instantaneous distance between the walls.
To identify the nuclei of the ordered phase (clusters) we use a cluster analysis, which is based on the consideration of the local environment around each particle by means of a -dimensional complex vector with the components
| (2) |
where are the spherical harmonics with the polar and azimuthal angles between radius-vector and a reference direction; is the number of neighbors for a particle , which are the particles located within a sphere of the radius (see Ref. Steinhardt_PRE_1983 ). Following the ten Wolde-Frenkel scheme Wolde_JCP_1996 , we specify the pair of neighbors, particles and , as correlated into an ordered structure if the following condition is satisfied:
| (3) |
where the normalization
| (4) |
sets the maximum possible value in the r.h.s. of inequality (3) equal to unity. Moreover, to exclude from consideration the structures with a negligible number of bonds per atom, which occurs even in liquid phase, we apply the following additional restriction Wolde_JCP_1996 : particle is considered as included into a crystalline structure if it has seven and more neighbors satisfying the condition (3).
III Nucleation and growth kinetics
According to the KJMA theory for crystallization kinetics Kashchiev_Nucleation , the fraction of material transformed into a crystalline phase at a given time is defined by
| (5) |
where is the nucleation rate and is the volume at time of a nucleus formed at time :
| (6) |
is the growth rate of the nucleus radius, is a dimensionless shape factor. This description is obviously correct if critical sized nuclei grow isotropically and are much smaller than the system size. In the simplest version of the theory, the growth rate does not depend on size or time, and the nucleation rate is approximated by the steady-state nucleation rate , – Eqs. (5) and (6) are simplified to give a well-known expression for steady-state homogeneous nucleation kinetics:
| (7) |
However, if the time scale of the transient regime, which precedes the steady nucleation and growth kinetics, is comparable to nucleation and growth time scales, a lag-time that accounts for the non-stationary character of the transition kinetics should be introduced, as discussed below.
The growth law of a supercritical cluster is commonly chosen (see Ref. Kashchiev_Nucleation , p. 378) to be of the form
| (8) |
with the growth rate averaged over directions222Generally, clusters can have a distribution of shapes and structures. Here we use a simplified description in terms of appropriately averaged cluster shapes Binder_1977 .
| (9) |
Here, is the averaged radius of a crystallite, the growth constant and the exponent take positive values and are determined by the growth mechanisms. Note that the term has a dimension of .
Taking into account the last equation, one obtains the volume of the supercritical cluster . As a result, the growth law of a supercritical cluster can be written as
| (10) |
where is a critical cluster size, is a numerical density of the crystalline cluster and is the mean lag-time for the appearance of a critical cluster. This equation can be rewritten in the dimensionless form:
| (11) |
where
Assuming that Eq. (10) holds to describe the growth of a supercritical cluster, we obtain equation for the time-dependent extended volume of a single cluster
Further, the simplest model to take into account the existence of a transient regime on the nucleation rate consists in assuming that this rate is zero until , and becomes constant hereafter Dobreva_1996 ; Chushak_JPCA_2000 . This corresponds to a function given by
| (13) |
where is the Heaviside step function. By inserting Eqs. (III) and (13) into Eq. (5), we obtain for nucleation-growth regime the following equation:
where the normalization factor indicates the possibility of incomplete crystallization of the parent phase, . By analogy with the growth law for a supercritical cluster [see Eq. (11)] the last equation can be also written in the dimensionless form:
When the critical cluster size is much smaller than the system size, the first (linear) term in the exponent of Eqs. (III) and (III) can be neglected. Moreover, if the lag-time is negligible in the nucleation and growth kinetics, then Eq. (III) reduces to the well-known Avrami equation [Eq. (7)].
IV Results
IV.1 Critical cluster
The critical cluster size is one of the crucial parameters in nucleation theories. Since the critical clusters are undetectable by the common traditional experimental tools, especially at the high supercoolings corresponding to a glassy phase, advanced methods must be used to define the critical cluster size and to clarify the question about subcritical cluster morphology (see review Fokin_Nucl2005 ). Here one can mention the advanced Köster’s method Koster_1988 and the way based on the accurate study of static structure factor data Debenetti_2006 . On the other hand, molecular dynamics simulations allow one to identify clusters of all sizes including supercritical solid clusters of the nucleation regime as well as subcritical clusters of the transient regime. Therefore, the critical cluster size can be identified, if a method to define correctly the boundary between these regimes is found.
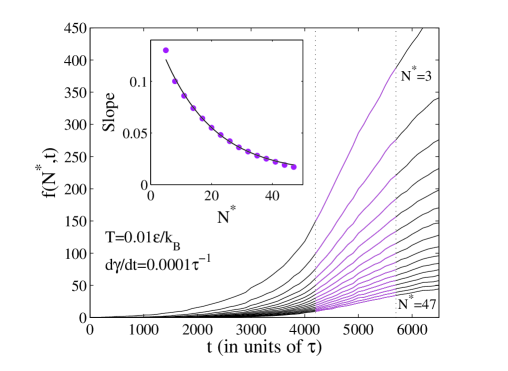
Yasuoko-Matsumoto method. – A first method for identifying is based on the consideration of the time-dependent total number of clusters whose size is larger than a given value , i.e.
| (16) |
where is the time-dependent cluster size distribution, is the size of the largest cluster at the time . Obviously, at Eq. (16) defines the total number of supercritical clusters formed at time , whereas is the nucleation rate ; is the volume. In the steady nucleation regime, the rate , defined by the slope of , is independent of for the range of supercritical clusters, i.e. . Note that this is correct only if the cluster growth rate is independent of time and size. As a result, the time-dependent curves at different must be simply shifted and have the same slope for the steady nucleation regime. This regularity will appear in the vicinity to the critical cluster size Yasuoka_Matsumoto_JCP_1998 .
To test the suitability of this method for extraction of the critical cluster size , we compute . The time evolution of at the different threshold values of is shown in Fig. 1. As expected, the curves shift in with the increase of . A linear growth in the nucleation regime (marked one in the main figure) is observed for all the cases including the case with extremely small threshold value . At the same time, the expected regularity that would indicate the independence of the -slope on is never observed (see inset of Fig. 1). Instead, we find that the dependence of the slope on is well fitted by an exponential decay Romer_JCP_127_2007 . Therefore, we conclude that in the present case, the method does not allow one to find explicitly the values of the critical cluster size . On the other hand, such a behavior of can arise because both nucleation and growth take the comparable time scales Chkonia/Wedekind_JCP_2009 , and the growth rate is a time- and size-dependent. In that case, a supercritical cluster is growing by a single-particle attachment as well as by a cluster coalescence, where a larger cluster merges with a smaller one.

Mean first-passage time method. – This method focuses on the evolution of the largest cluster with the aim to define the average time of first appearance of a cluster with size (see Refs. Bartell_JCP2006 ; Wedekind_JCP2006 ), i.e.
| (17) |
where is the time of the first appearance of the -sized cluster after a single run and is the total number of runs, . If the nucleation is followed by fast cluster growth, the has a pronounced sigmoidal form and can be fitted by
| (18) |
where is the ordinary error function, defines the curvature and is related to the Zeldovich factor Hanggi_RMP_1990 . Then, the critical cluster size can be simply defined by the position of the inflection point in MFPT Wedekind_JCP2006 , which indicates the onset of stable cluster growth, whereas the term will characterize the mean lag-time for the appearance of a critical cluster. It is important to note that if the transient regime is insignificant and the transition is characterized by steady-state nucleation mainly, then MFPT method allows one to estimate the nucleation rates directly as an inverse height of plateau in MFPT divided by volume Wedekind_JCP2006 ; Bartell_JCP2006 .
Figure 2 shows MFPT distributions averaged over set of independent runs, where each curve corresponds to a fixed temperature and strain rate. Although a fit of Eq. (18) to the data is suitable and the plateau in MFPT is observable for all cases [Fig. 2(b)], the position of the plateau is difficult to locate accurately [Fig. 2(a)]. Such a behavior indicates once again the possible non-stationary character of the cluster nucleation-growth process and that nucleation and growth occur at the comparable time scales Chkonia/Wedekind_JCP_2009 . Nevertheless, as can be seen from Fig. 2(a), the inflection point in MFPT distributions, which is associated with the critical cluster size and the lag-time , is well-defined.
IV.2 Cluster growth
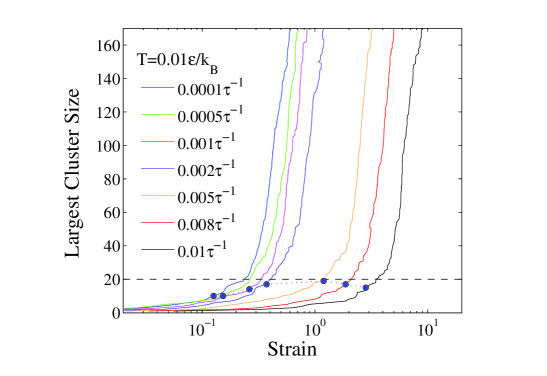
Figure 3 shows the growth curves of the largest cluster in the system under shear, for strain rates , and at a low temperature . It is seen from the figure that all the curves indicate a steady growth for a cluster with size larger than particles. Therefore, the threshold value of a cluster size, associated in CNT with a critical cluster size , at which the steady growth starts, must be relatively small. The values of defined by means of MFPT method are also presented in Fig. 3. These small values of are qualitatively in agreement with CNT, which predicts a decrease of the critical cluster size with the supercooling. Another interesting observation is related with the existence of a transient regime, which precedes the nucleation and growth processes and causes the delay of the cluster growth. The transient regime can be characterized by the lag-time , which defines the time required for the appearance of a critical sized cluster Yasuoka_Matsumoto_JCP_1998 ; Chushak_JPCA_2000 . Hence, the shift of the growth curves, observed in Fig. 3, indicates directly a dependence of the lag-times. We note that the similar growth curves are also observed for the cases with and .
Growth laws of the largest cluster at various strain rates and temperatures are presented in Fig. 4, using the scaling form described by Eq. (11). First, as can be seen, all curves for the fixed temperature are collapsed onto a single master curve, which indicates the universal character of the growth kinetics. Moreover, the master curve is very well fitted by Eq. (11) with the growth exponent and the factor for all considered temperatures. Both parameters appear to be -independent for the temperatures we have studied. On the other hand, it appears that the growth constant correlates with the lag-time and the critical cluster size , and so we have
| (19) |
Taking into account that for 3D uniform crystalline growth controlled by interface transfer, the smaller value of the growth exponent, , can reflect the influence of shear on the growth mechanism, where the corresponding cluster growth is considered as an averaged one over directions. Note that a crystal growth law with a small exponent , was observed in the diffusion wave spectroscopy “echo” experiments for colloidal glasses under shear of Ref. Haw/Pusey_PRE_1998 . While we do not have any theoretical explanation for the empirical correlation (19), this correlation is clearly associated with the influence of shear on the kinetic aspect of the nucleation and growth process. The growth constant is defined by a particle attachment frequency, whereas the lag-time characterizes shear-induced “unjamming” of the glassy system Mokshin/Barrat_JCP_130_2009 .
| () | () | () | () | ||
|---|---|---|---|---|---|
IV.3 Crystallization kinetics and nucleation rates
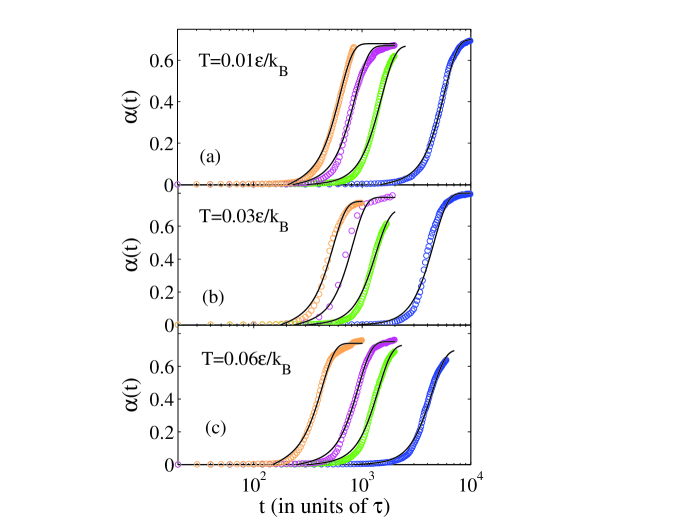
We now come to a discussion of the crystallization kinetics of the glassy system under strain. The time-dependent crystalline phase fraction , as resulting from cluster analysis applied to our simulation data at three fixed temperatures , and and four fixed values of the strain rate , is presented in Fig. 5. The data for each case presented in the figure is the result of averaging over a set of independent runs. One can see from the figure, that the evolution of the crystal fraction is characterized by three distinct regimes, in analogy with the transition without external drive. In the first regime the crystalline fraction is practically negligible. The characteristic time scale for this stage is defined by the time elapsed between the system quench and the formation of a critical cluster. The second regime corresponds to the growth of the crystalline fraction. Finally, in the third regime, the crystalline growth is essentially terminated, and the small increase appears due to coarsening and defect removal processes Mokshin/Barrat_PRE_77_2008 . Moreover, Fig. 5 shows the fit of these results by the theoretical model (III) presented in Sec. III. Only two adjustable parameters, and , are needed to reproduce simulation results for all considered cases, as the values of all other terms included in Eq. (III) are known from the cluster growth curves discussed above. It is clear that the parameter defines the final part of the crystallized fraction and, thereby, can be found from the final plateau of . Then, if theoretical model (III) is capable to reproduce the data, then we obtain within such a model an additional tool to extract the steady-state nucleation rate from crystallization kinetics data333A similar method was used in Ref. Chushak_JPCA_2000 to estimate the growth and nucleation rates..
As can be seen from Fig. 5, an excellent agreement between the molecular dynamics simulation data and the model (III) is obtained for all considered temperatures and values of the strain rate . The growth exponent was taken as , the product , the lag-time and the critical cluster size were used immediately as found from cluster growth analysis [see Table 1]. Moreover, from Fig. 5, the values of do not saturate to unity. This indicates incomplete crystallization of the glassy system, of the bulk, and represents a consequence of the shear drive. Note, that a similar effect was observed by Rottler-Srolovitz for shear-induced alignment in polycrystalline bilayer systems, although the final ordered fraction was found to be less than in our case Rottler_PRL_2007 .
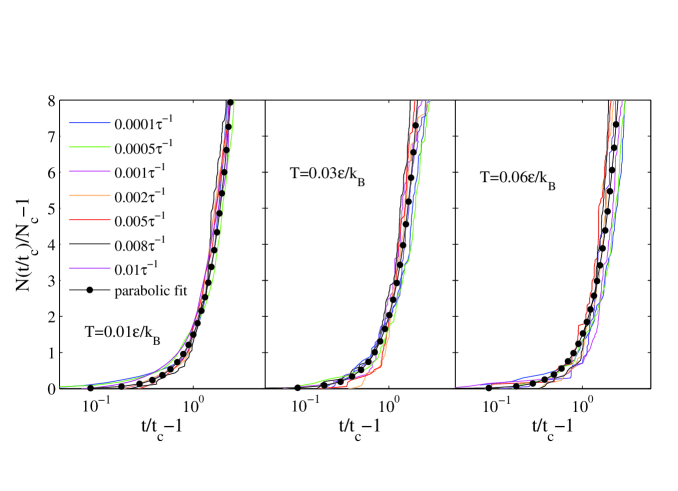
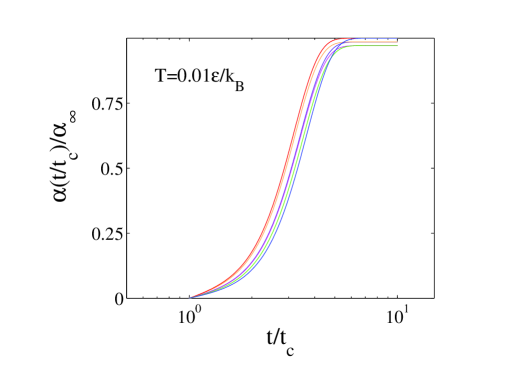
The slope of in the nucleation-growth regime appears to be the same for all the considered shear rates and temperatures, indicating the universal character of the crystallization kinetics. In Fig. 6, the rescaled curves for according to Eq. (III) with the extracted values of the parameters are presented. As can be seen, the rescaled data generate a unified master curve, well described by the scaling form [Eq. (III)]. So, crystallization kinetics of the system is defined by the time scales responsible for crystal nucleation and cluster growth, respectively. This has a similarity with results of Cavagna et al. for a lattice spin system Cavagna_EPL_2003 ; Cavagna_JCP_2003 , where at low temperatures the fast nucleation of small and stable crystal droplets followed by slow activated crystal growth.
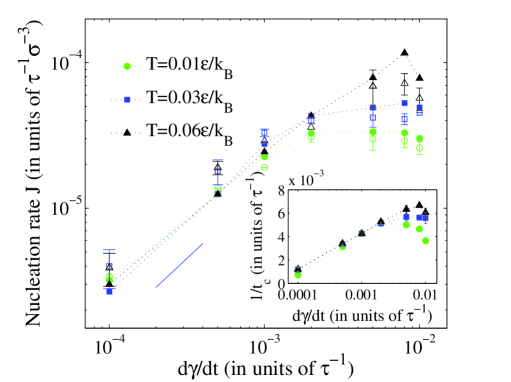
Fig. 7 shows the -dependence of the nucleation rate at fixed temperatures. In this figure, the data obtained from the evolution of crystallization kinetics within Eq. (III) are compared with the results of Yatsuoko-Matsumoto method at the known critical cluster size. Remarkably, both methods yield a very close behavior and reveal the same features for all the considered cases. As can be seen, at the constant temperature is nonmonotonic. Namely, the nucleation rate increases linearly at low strain rates. Then, at the values the nucleation rate levels off and reaches a maximum. On further increase of nucleation rate starts to decrease. Interestingly, a similar -dependence was earlier found by us for the phase transformation rate of the system Mokshin/Barrat_JCP_130_2009 . Results similar to those shown in Fig. 7 have also been observed for steady-state nucleation rate measurements against shear rate in very different systems, including an industrial polydisperse isotactic polypropylene melt Coccorullo_Macromol_41_2008 and a two-dimensional Ising model Valeriani_condmat_2008 .
To understand the observed nonmonotonic behavior of we also consider the values of the product and of the lag-time presented in Table 1 [the inverse lag-time vs. the strain rate is also shown in the inset of Fig. (7)]. As can be seen, both quantities correlate directly with nucleation rate, with a very similar nonmonotonic variation. The rise of nucleation rate is therefore accompanied by the increase of the cluster growth and by the reduction of the time scale for transient regime and, vice versa, the decrease of nucleation rate occurs at retarding the cluster growth and increasing the lag-time scale. Such a correlation indicates directly that the changes in the nucleation rate are essentially a kinetic, rather than thermodynamic effect.
Recently, the similar nonmonotonic behavior of nucleation rate vs. strain rate for a driven two-dimensional Ising model was revealed in Ref. Valeriani_condmat_2008 . The authors had related the observed behavior with an interplay between shear-enhanced cluster growth, cluster coalescence and cluster breakup. It was additionally found in Ref. Valeriani_condmat_2008 that shear-enhanced cluster coalescence and monomer attachment (single spin flip growth in Ising model) give the similar impact in the total ordering. Results of our study indicate rather that cluster growth and nucleation processes are merely correlated and their features are defined by kinetics of the transition. At the same time, a weak -dependence observed for the critical cluster size [see Table 1] reflects the influence of shear drive on the particle cohesion in a crystalline nuclei due to mechanical stresses.
V Conclusion
In summary, we have performed nonequilibrium molecular dynamics simulations to study crystal nucleation and growth processes induced by shear drive in a metallic glass for a range of temperatures and strain rates. By applying a mean first passage time analysis, we define the size of a critical cluster and the time scale of its appearance. We find that the nucleation-growth process has a non-stationary character, and the crystalline cluster grows with a time- and size-dependent rate.
To describe the crystallization kinetics under shear observed in our simulations, the extension of the KJMA theory is suggested and compared with simulation data. As a result, an excellent agreement is obtained for all the considered cases. Further, we find that data for time evolution of the crystalline fraction at particular values of strain rates can be rescaled within this theoretical model to give an unified master curve.
The observed nonmonotonic behavior of the nucleation rate on the strain rate at the fixed temperatures is very similar with that was recently reported for the case of a two-dimensional Ising model under shear Valeriani_condmat_2008 . This behavior of indicates directly that shear drive can speed up as well as suppress nucleation in a glass. Finally, we find that nucleation rate, lag-time and cluster growth are affected by the shear in a very similar and correlated way.
Acknowledgements.
The authors thank A. Tanguy, M. Tsamados, S.F. Timashev and R.M. Khusnutdinoff for useful discussions. This work was supported by the CNRS/RFBR project (Grant No. 09-02-91053-CNRS¯a).References
- [1] D. Kashchiev, Nucleation: Basic Theory with Applications (Butterworth-Heinemann, Oxford, 2000).
- [2] K.F. Kelton, Solid State Physics, edited by H. Ehrenreich and D. Turnbull (Academic, New York, 1991), Vol. 45, p. 75.
- [3] H. Löwen, J. Phys.: Condens. Matter 20, 404201 (2008).
- [4] G. Martin, Curr. Opin. Solid St. M. 3, 552 (1998).
- [5] M.L. Wallace and B. Joós, Phys. Rev. Lett. 96, 025501 (2006).
- [6] F. Albano and M. Falk, J. Chem. Phys. 122, 154508 (2005).
- [7] R. Blaak, S. Auer, D. Frenkel, and H. Löwen, Phys. Rev. Lett. 93, 068303 (2004); R. Blaak, S. Auer, D. Frenkel, and H. Löwen, J. Phys.: Condens. Matter 16, S3873 (2004).
- [8] S. Butler and P. Harrowell, Phys. Rev. E 67, 051503 (2003).
- [9] S. Butler and P. Harrowell, J. Chem. Phys. 118, 4117 (2003)
- [10] N. Duff and D.J. Lacks, Phys. Rev. E 75, 031501 (2007).
- [11] A.V. Mokshin and J.-L. Barrat, Phys. Rev. E 77, 021505 (2008).
- [12] A.V. Mokshin and J.-L. Barrat, J. Chem. Phys. 130, 034502 (2009).
- [13] R.S. Graham and P.D. Olmsted, Phys. Rev. Lett. 103, 115702 (2009).
- [14] S. Butler and P. Harrowell, Phys. rev. E 52, 6424 (1995).
- [15] J.J. Cerdà, T. Sintes, C. Holm, C.M. Sorensen, and A. Chakrabarti, Phys. Rev. E 78, 031403 (2008).
- [16] R.J. Allen, C. Valeriani, S. Tănase-Nicola, P.R. ten Wolde, and D. Frenkel, J. Chem. Phys. 129, 134704 (2008).
- [17] N. Koumakis, A.B. Schofield and G. Petekidis, Soft Matter 4, 2008 (2008).
- [18] M.D. Haw, W.C.K. Poon, P.N. Pusey, P. Hebraud and F. Lequeux Phys. Rev. E 58, 4673 (1998).
- [19] P. Holmqvist, M.P. Lettinga, J. Buitenhuis and J.K.G. Dhont, Langmuir 21, 10976 (2005).
- [20] I. Coccorullo, R. Pantani, and G. Titomanlio, Macromolecules 41, 9214 (2008).
- [21] J. Vermant and M.J. Solomon, J. Phys.: Condens. Matter 17, R187 (2005).
- [22] M. Dzugutov, Phys. Rev. A 46, R2984 (1992).
- [23] M. Dzugutov, Phys. Rev. Lett. 70, 2924 (1993); M. Dzugutov, Eur. Phys. J. B 14, 449 (2000).
- [24] S.I. Simdyankin, M. Dzugutov, S.N. Taraskin and S.R. Elliott, J. Non-Cryst. Solids 293-295, 327 (2001).
- [25] P.J. Steinhardt, D.R. Nelson, M. Ronchetti, Phys. Rev. B 28, 784 (1983).
- [26] P.R. ten Wolde, M.J. Ruiz-Montero, and D. Frenkel, J. Chem. Phys. 104, 9932 (1996).
- [27] K. Binder, Phys. Rev. B 15 4425 (1977).
- [28] Y. Chushak and L.S. Bartell, J. Phys. Chem. A 104, 9328-9336 (2000)
- [29] A. Dobreva, S. Stoyanov, T. Tzuparska, I. Gutzow, Thermochim. Acta 127, 280-281 (1996).
- [30] V.M. Fokin, N.S. Yuritsyn, and E.D. Zanotto in Nucleation Theory and Applications edited by J.W.P. Schmelzer (Wiley, Weinheim, 2005).
- [31] U. Köster, Mater. Sci. Eng. 97, 183 (1988).
- [32] P.G. Debenedetti, Nature 441, 168 (2006).
- [33] K. Yasuoka and M. Matsumoto. J. Chem. Phys. 109, 8451 (1998); T. Koishi, K. Yasuoka, T. Ebisuzaki, J. Chem. Phys. 119, 11298 (2003).
- [34] F. Römer and T. Kraska, J. Chem. Phys. 127, 234509 (2007).
- [35] G. Chkonia, J. Wölk, R. Strey, J. Wedekind, and D. Reguera, J. Chem. Phys. 130, 064505 (2009).
- [36] P. Hänggi, P. Talkner, and M. Borkovec, Rev. Mod. Phys. 62, 251 (1990).
- [37] L.S. Bartell, D.T. Wu, J. Chem. Phys. 125, 194503 (2006).
- [38] J. Wedekind, D. Reguera, and R. Strey, J. Chem. Phys. 125, 214505 (2006).
- [39] J. Rottler, D.J. Srolovitz, Phys. Rev. Lett. 98, 175503 (2007).
- [40] A. Cavagna, I. Giardina, and T.S. Grigera, Europhys. Lett. 61, 74 (2003).
- [41] A. Cavagna, I. Giardina, and T.S. Grigera, J. Chem. Phys. 118, 6974 (2003).