Ferromagnetic Behavior of High Purity ZnO Nanoparticles.
Abstract
ZnO nanoparticles with Wurtzite structure were prepared by chemical methods at low temperature in aqueous solution. Nanoparticles are in the range from about 10 to 30 nm. Ferromagnetic properties were observed from 2 K to room temperature and above. Magnetization vs temperature, M(T), and isothermal measurements M(H) were determined. The coercive field clearly shows ferromagnetism above room temperature. An exchange bias was observed, and we related this behavior at a core shell structure presented in the samples. The chemical synthesis, structure, defects in the bulk related to oxygen vacancies are the main factors for the observed magnetic behavior.
pacs:
61.46.Hk Nanocrystals, 75.50.Pp Magnetic semiconductors, 81.05.Dz II-VI semiconductorsI Introduction
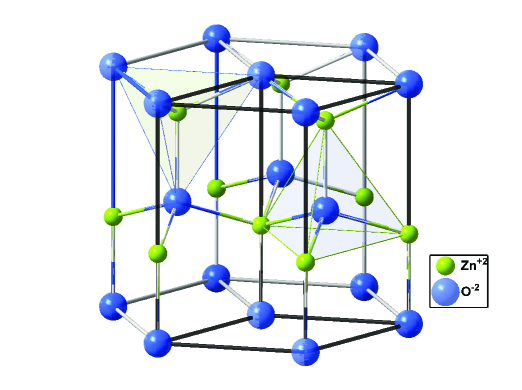
Recently Zinc oxide, ZnO has been a material that has attracted an intense interest for its possible application in distinct technological fields; spintronics, magnetic semiconductors, catalysts, sensors, field emission devices, solar cells, etc Ozgur . This compound is a band gap semiconducting material with a direct band gap of 3.37 eV, and electronic concentration only about to . In bulk material Zinc atoms occupy the special position 2(b) with coordinates (1/3, 2/3, 0), oxygen also occupy special position 2(b) with coordinates (1/3, 2/3, u), where u= a/c = 0.3817, see Kisi, et al. kisi . Figure 1 presents the hexagonal structure characteristic of zinc-oxide. The ZnO wurzite structure also named as zincite mineral, has cell parameters Å, and Å, consistent with the standard JCPDS 36-1451 pattern card.
In addition, to the studies in bulk crystalline materials, nanoparticles of this compound with different morphologies, have been turned important for the reason that the electronic characteristics may change at the nanometric scale Yanhe ; zhang ; sundaresan ; sundaresan2 ; nguyen . These changes are mainly related to the ratio volumen/area, which may give different physical characteristics and behaviors. Recently studies of native points defects in ZnO bulk by Anderson, et al. Anderson , describe the mechanism of defects over the electronic properties. In compounds at the nanometric scale the ratio changes the physical and chemical properties making posible diferent electronic mechanisms. Many workers in the field of nanomaterials have used different procedures for the preparation of this material; using varied physical and chemical techniques to obtain the synthesis of this compound Yanhe ; Hulan . In this work we prepared the nanostructured material using a Sol-gel method as described by Hui, et al. Xiangyang . The obtained nanostructures present interesting and new magnetic characteristics some already reported by other authors, nguyen ; sundaresan ; sundaresan2 . In this paper we present our studies concerned with structural defects in ZnO nano-material and the magnetic ordering found. Our observation shows that ZnO in sizes from about 10 to 30 nm presents ferromagnetic ordering up to room temperature, which can be related to the absence or vacancies of oxygen or Zn atoms Kay , XPS measurements confirm the assumption that vacancies are an important factor.
II Experimental Details
Nanoparticles of ZnO were prepared using the sol gel method. Different amounts of di-hidrated zinc acetate Zn(CH3COO)2, (Aldrich 99.99 %) was used as precursor diluted in de-ionized water at pH = 7 and 25 0C, ammonium hydroxide (NH4OH)was added slowly as a dispersive medium according to the following reaction:
Zn(CH3COO)2 + 2NH4OH —–¿ Zn(OH)2 + 2CH3COO- + 2NH+4.
The resulting gel was dried at 60 0C in air for a period of time (30 hrs) and posteriorly annealed in air, at maximum temperature about 200 - 300 0C depending of the precursor amount to obtain ZnO, the reaction was: Zn(OH)2 —–¿ ZnO +H2O.
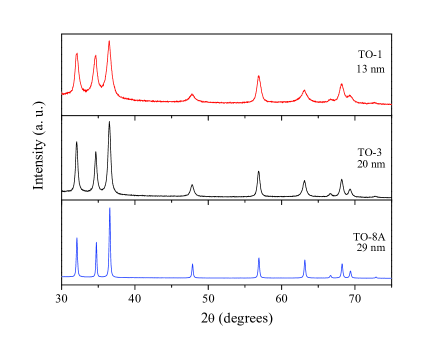
Different powder samples of ZnO were prepared with distinct pH s values and precursor amounts ismai . In this work particularly we will describe mainly the resulting study done on three samples called: TO-1, TO-2, and TO-8A. The samples were characterized and analyzed with X-ray diffraction, see Fig. 2. There we present the X-ray diffraction patterns for three ZnO nanoparticle samples. The panels show the X-ray nanoparticles with average sizes from about 30 to 13 , the size was determined with Scherer formula and using a gaussian fit, the center of the gaussian was considered the average size. All the diffraction peaks were appropriated indexed, and corresponding with the hexagonal Wurtzite ZnO structure.
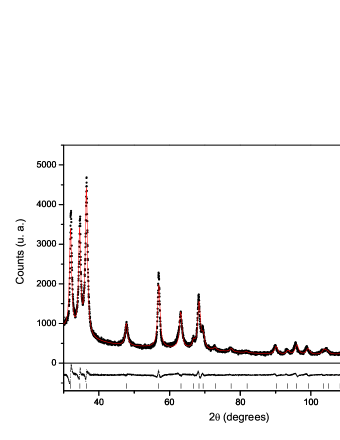
Phase identification of the samples was performed with X-ray diffractometer Brucker D8 using Cu-Kα radiation and a Ni filter. Intensities were measured at room temperature in steps of 0.025 degrees, from 2 range 6 to 130 degrees. The crystallographic phases were identified by comparison with the X-ray patterns of the JCPDS database. The parameters were refined with a Rietveld-fit program; Rietica v 1.71 with multi-phase capability howard . The structural parameters for three ZnO samples ( TO-1, TO-3, and TO-8A) are shown in Table 1, there are concentrated all characteristics including parameters and Rp, Re, and Rwp data related to the Rietveld fitting. Chemical analysis was carried out by X-ray photoelectron spectroscopy (XPS). The analysis was performed using a VG Microtech ESCA 2000 Multilab UHV system, with an Al X-ray source, h = 1486.6 eV, operated at 15 kV and 20 mA beam, and CLAM4 MCD analyzer.
In order to perform the analyisis, the surface of the pellets were etched with Ar+ for 20 min with 4.5 kV at 0.3 A mm-2. The XPS spectrum was obtained at 55 degrees respect to the normal surface in a constant pass energy mode (CAE), at E0 = 50 and 20 eV for survey and high resolution narrow scan, respectively. The atomic relative sensitivity factor (RSF) reported by Scofield was corrected by the transmission function of the analyzer scofield and by the reference material ZnO. The peak positions were referenced to the background silver 3d5/2 photopeak at 368.21 eV, having a FWHM of 1.00 eV, and C-1s hydrocarbon groups in 284.50 eV central peak position. The XPS spectra were fitted with the program SDP v 4.1 SDP .
![[Uncaptioned image]](/html/1009.5641/assets/x4.png)
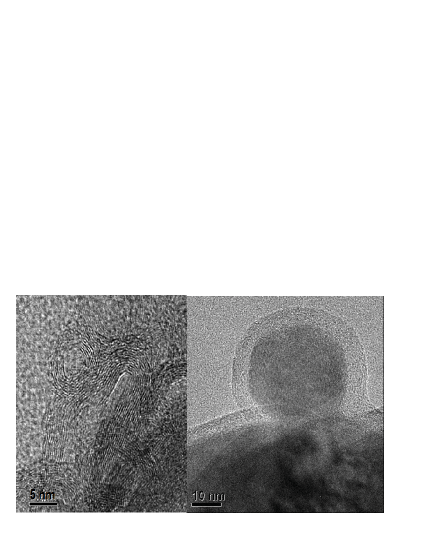
Transmision electron micrographs (TEM) were obtained with a JEOL FEG 2010 FASTEM analytical microscope. Results of sinthesis, X-ray, and TEM show that nanoparticles with size below nm present a light grey color, whereas other with size above nm are with normal white coloration. TEM photographies of the nanostructured samples shown in Fig. 4 display the morphology and size of these nanoparticles. It is interesting to note a core shell structure completely surrounded some of the nanoparticles, delimiting the bulk of the sample from the surface. This feature was also observed by Debjani et al. Debjani . We assume that these characteristic structural morphologies are related from the thermodynamical point of view, to one of the forms to decrease the ground state energy of the system formed by nanoparticles, and is specificaly applicable to our ZnO nanoparticles. As we will explain further, the magnetic characteristic are affected by this shell structure, the effects mainly observed in an exchange bias feature. The isothermal magnetic measurements, particularly with the exchange bias in our measurements will be displayed in a latter figure (Fig. 9). those results).
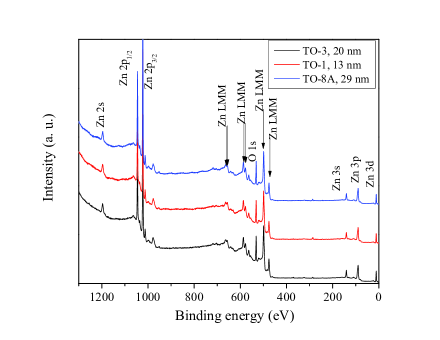
In order to examine the stoichiometry of the compound, we analyzed the poly-crystalline samples by x-ray photoelectron spectroscopy (XPS). Fig. 5 shows the XPS survey spectra after Ar+ etching for the three samples. No extra peak corresponding to any magnetic impurities other than Zn and O atoms were observed, as shown in this figure.
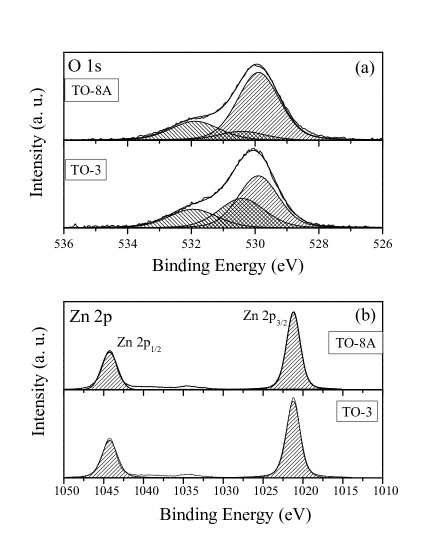
In Fig. 6(a) is shown the deconvolution of the XPS spectra in the O-1s region for TO-3 and TO-8A samples. The asymmetric O-1s peak in the surface was fitted by three Lorentzian-Gaussian components, centered at 529.90, 530.42, and 531.96 eV, respectively, as displayed in Fig. 6(a). The three fitted binding energy peaks approximate the results of Chen et al., and Wang et al. Chen ; Wang . Chen et al. attributed the peak on the low binding energy side of the O-1s spectrum to the O2- ions on the wurtzite structure of the hexagonal Zn2+ ion array, surrounded by zinc atoms with the full supplement of nearest-neighbor O2- ions. Accordingly, this peak of the O-1s spectrum can be attributed to the Zn-O bonds. The higher binding energy at 531.96 eV is usually attributed to chemisorbed or dissociated oxygen or OH species on the surface of the ZnO thin film, such as CO3, adsorbed H2O or adsorbed O2 Chen ; Major . The component at the medium binding energy of the O-1s peak may be associated with O2- ions that exist in oxygen-deficient regions within the ZnO matrix. Thus as a result, changes in the intensity of this component may be in connection with the variations in the concentration of the oxygen vacancies SZo . The intensity of the peak localized at 529.90 eV exceeds those localized at 530.42 and 531.96 eV, indicating the strong Zn-O bonding in ZnO. In order to determine the sample compositions, the atomic concentration was calculated by XPS using the survey spectra and the value of RSF for O-1s and Zn-2p: 2.95, and 9, respectively. For the three smples studied; TO-8A, TO-3 and TO-1, the of atomic oxygen was determined as 0.757, 0.736 and 0.715 respectively. In Fig. 6(b) are shown the deconvolution of the XPS spectra in the Zn-2p region for the mentioned samples. The Zn-2p spectrum shows a doublet whose binding energies are 1021.21 and 1044.26 eV and can be identified as the lines Zn-2p3/2 and Zn-2p1/2, respectively. The binding energy differences between the two lines is 22.4 eV, which is well lying within the standard reference value of ZnO wagner . The values of binding energy and binding energy difference calculated from the XPS study show that Zn atoms are in Zn2+ oxidation state. No metallic Zn with a binding energy of 1021.5 eV was observed Islam . This confirms again that Zn is in the Zn2+ state. Furthermore, at this stage is not possible to determine the presence of Zn interstitial defects from Zn-2p spectra, which may be established only by the Auger peak of Zn.
II.1 Magnetic characterization
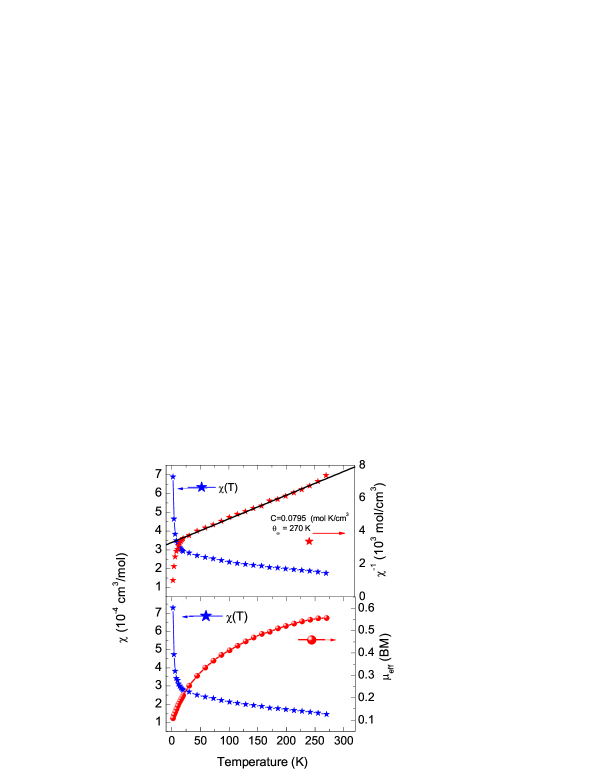
Magnetic behavior was determined from low temperature, 2 K to room temperature. The characteristics were determined by using a MPMS Quantum Design Magnetometer. Magnetization versus Temperature characteristics M(T) were performed in magnetic field intensities of 1 kOe and 50 kOe, and in two typical modes of measurement, in order to determine probably irreversible effects. In Zero Field Cooling (ZFC) the sample is first cooled to the minimum accesible temperature, once in thermal equilibrium the magnetic field is applied and the measurement is initiated increasing the temperature. In the field cooling mode (FC) the measurement is performed starting at the maximum temperature with the magnetic field applied and decreasing the temperature. With those two modes, the behavior related to hysteretic or irreversible processes can readily be observed. In addition to these measurement, we also performed measurements at the two mentioned different magnetic fields, this in order to observe possible metamagnetic effects; in all measurements neither metamagnetic or irreversibility processes were observed. In Fig. 7, it is displayed a tipical susceptibility characteristic as function of temperature, for two different size particle samples measured at two distinct fields. In general we observed similar magnetic behavior for all samples, with small variation of the Curie constant from about 0.05 to 0.09 molK/cm3, with small changes of the Weiss temperature, to about 250 to 326 K. The small Curie values extracted of the susceptibility are quite representative of a weak ferromagnetic behavior. Fig. 7 displays both sets of data in two different samples. Top panel also shows the inverse susceptibility fitting very well to a Curie Weiss law from high temperature to below 50 K. The resulting Curie constant is; C = 0.0795 molKcm3, and Weiss temperature K. The bottom panel shows , and the right axis the number of Bohr magnetons, , at room temperature is about 0.55 BM, value similar to all samples.

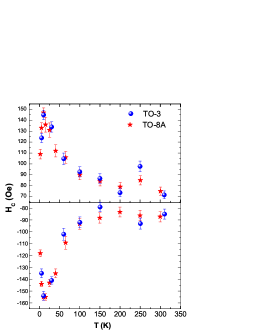
In order to have better insight about the magnetic behavior of the ZnO nanosamples, we performed isothermal magnetization measurements, M(H), determined at different temperatures to characterize the resulting coercive field. These measurements were from 2 K to above room temperature. Fig. 8 displays panels with isothermal M(H) at six different temperatures. All temperatures show an anomalous variation of the coercive field as displayed in Fig. 9. Several interesting characteristics can be noted; at low temperature the coercive field presents an anomalous peak around 5 K. Measurements taken at 2 K present a small value that increases, and reaches a maximum at about 5 K. After this temperature the coercive field decreases up to 200 K. Above 200 K it seems that another anomalous change ocurrs at 250 K followed for a smooth decrease, but persistent to above room temperature. We have plotted in Fig. 9 the positive and negative parts of the coercive field. Clearly is noted a small but different coercive field in the TO-3 and TO-8A samples, and also in the negative and positive parts. This exchange bias we speculate may be related to two possible magnetic orderings ocurring in the samples; one existing on surface and other in bulk. The core shell charateristic of our samples are surely related to this behavior schuller and also explain our observations. However we do not have a complete explanation for the two observed anomalous peaks of the coercive field at low temperature. It is important to stress about the purity of the samples. Particularly, we did not find detect any magnetic impurities. The determined exchange bias differences, respect to the negative and positive parts plotted in Fig. 9 are small but quite measurable. Accordingly this effect may be due to two different magnetic orderings in the bulk and on surface of the samples. Thus, this explains our results of the exchange bias.
III Conclusions
In this experimental study of ZnO nanoparticles prepared using sol gel method we demonstrate that ferromagnetism exist up to room temperature. Rietveld refining shows that the cell parameters are almost similar to bulk samples and studies of the XPS show the presence of oxygen vacancies, around 25 - 29 % . That difference in structure, is conclusive and related with the magnetic behavior. Also we observed an exchange bias in measurements related to the coercive field, this effect might be clearly related to a core shell structure as observed in our samples and by other workers, this structural shell definitive affects the magnetic order in the nanoparticles.
Acknowledgements.
We thank F. Silvar for Helium provisions, L. Huerta for XPS measurements, L. Rendon, for high resolution TEM measurements, L. Diazbarriga, for the help in the conclusion of this study, and O. Garcia, A. Fernandez for initial help in initial method of sample preparation.References
- (1) U. Ozgur, Ya. I. Alivov, C. Liu, A. Teke, M. A. Reshchikov, S. Dogan, V. Avrutin, S. J. Cho, and H. Morkoc. J. Appl. Phys. 98, 041301 (2005).
- (2) Erich H. Kisi and Margaret M. Elcombe. Acta Cryst. C45, 1867 (1989).
- (3) Yanhe Xiao, Liang Li, Yan Li, Ming Fang and Lide Zhang. Nanotechnology 16, no. 6, 671 (2005).
- (4) Hui Zhang, Deren Yang, Xiangyan Ma, Yujie Ji, Jin Xu, Duanlin Que. Nanotechnology 15, 622 (2004).
- (5) A. Sundaresan, R. Bhargavi, N. Rangarajan, U. Siddesh. C. N. R. Rao. Physical Review B 74, 161306 (R) (2006).
- (6) A. Sundaresan, C. N. R. Rao. Solid State Communications. 149, 1197 (2009).
- (7) Nguyen Hoa Hong, Joe Sakai, Virginie Briz . J. Phys:. Condens. Matter 19, 036219 (2007).
- (8) Anderson Janotti and Chris G. Van de Walle. Phys. Rev. B 76, 165202 (2007).
- (9) Hulan Zhou, Zhuang Li. Materials Chemistry and Physics 89, 326 (2005).
- (10) Xiangyang Ma, Hui Zhang, Yujie Ji, Jin Xu, Deren Yang. Materials Letters 59, Issue 27, 3393 (2005)
- (11) Kay Potzger, and Shengqiang Zhou. Phys. Status Solidi B 246, No.6, 1147 (2009).
- (12) A. A. Ismail, A. El-Midany, E. A. Abdel-Aal, H. El. Shall. Materials Letters 59, 1924 (2005).
- (13) C. J. Howard, B. A. Hunter, DE.A. J. Swinkels. Rietica, IUCR Powder Diffraction 22, 21 (1997).
- (14) J. H. Scofield. J. Electron Spectrosc. 8, 129 (1976).
- (15) SDP, v4.1 (32bit) Copyright 2004, XPS International, LLC. Compiled Jan. (2004).
- (16) Debjani Karmakar, S. K. Mandal, R. M. Kadam, P. L. Paulose, A. K. Rajarajan, T. K. Nath, A. K. Das, I. Dasgupta and G. P. Das. Phys. Rev. B 75, 144404 (2007).
- (17) M. Chen, X. Wang, Y. H. Yu, Z. L. Pei, X. D. Bai, C. Sun, R. F. Huang, L. S. Wen. Appl. Surf. Sci. 158, 134 (2000).
- (18) Z. G. Wang, X. T. Zu, S. Zhu, L. M. Wang. Phys. E 35, 199 (2006).
- (19) S. Major, S. Kumar, M. Bhatnagar, K. L. Chopra. Appl. Phys. Lett. 49, 394 (1986).
- (20) T. Sz r enyi, L. D. Laude, I. Bert oti, Z. K antor, Z. Geretovszky. J. Appl. Phys. 78, 6211 (1995).
- (21) C. D. Wagner, W. M. Riggs, et al. in: Handbook of X-ray photoelectron Spectroscopy, Perkin Elmer, Eden Praire. (1979).
- (22) M. N. Islam, T. B. Ghosh, K. L. Chopra, H. N. Acharya. Thin Solid Films 280, 20 (1996).
- (23) J. Nogues, I. K. Schuller. Journal of Magnetism and Magnetic Materials 192, 203 (1999).