The inclinations of faint TNOs
Abstract
Bernstein et al. (2004) found that the population of faint (R26) trans-Neptunian objects (TNOs) known at that time was dominated by “Classical” objects, which have low inclinations () and distances 40–45 AU. Since those observations, the number of faint TNOs whose orbits are sufficiently well known to be classified as “Classical” or “Excited” has grown from seven to 39. We analyze the dynamical classifications of faint TNOs known today and find that this population is dominated by Excited objects. We discuss some implications of this result.
1 Introduction
The trans-Neptunian region is inhabited by rocky-icy bodies called trans-Neptunian objects (TNOs). Most TNOs are faint, and extensive sky coverage and sensitive surveys are needed for their detection. Understanding the properties of TNOs — numbers, sizes, compositions, and orbital properties — helps constrain the history of the outer Solar System.
The deepest TNO survey performed to date is that of Bernstein et al. (2004, hereafter B04), who surveyed 0.02 deg2 to an F606W magnitude of 29.2 (50% completion rate) with the Hubble Space Telescope (HST). B04 found three new faint TNOs (R magnitudes 26.3–27.8). Significantly, all three of these new faint TNOs have orbits that lie very close to the ecliptic plane, all with inclinations less than 2.5 degrees. B04 compiled all existing TNO survey data at the time and, in combination with their three new faint TNOs, concluded that faint TNOs were far more likely to be low-inclination objects, which they named “Classical” TNOs, and far less likely to be high-inclination (“Excited”) TNOs. At the time of the B04 survey, there were only four other R26 TNOs known.
In the years since the B04 survey, two groups have significantly extended the number of faint TNOs known, primarily using ground-based facilities (Table 1). There are now 39 known TNOs with R26 and known inclinations. It is therefore possible now to repeat the analysis that B04 did to determine the relative prevelance of Classical and Excited TNOs, at a far higher significance. We present in this paper our analysis of the dynamical state of faint TNOs, using data available as of June, 2010.
2 Data and analysis
We compile data from the surveys listed in Table 1. These are the published surveys that have some sensitivity to objects with R. We additionally include Elliot et al. (2005) to provide a “baseline” for brighter objects, but our compilation for objects brighter than R=26 is not meant to be complete, just representative. Most of these papers report either R magnitudes, or transformations from their bandpasses to R, so the compiled data is all in R magnitude as a common system. We use the B04 definitions of Classical versus Excited, assigning to the former class all objects with inclinations less than 5 degrees and to the latter group all objects with inclinations larger than 5 degrees. We do not use distance as a discriminant in the present study; that parameter is significantly more difficult to measure in ground-based surveys than it is with HST.
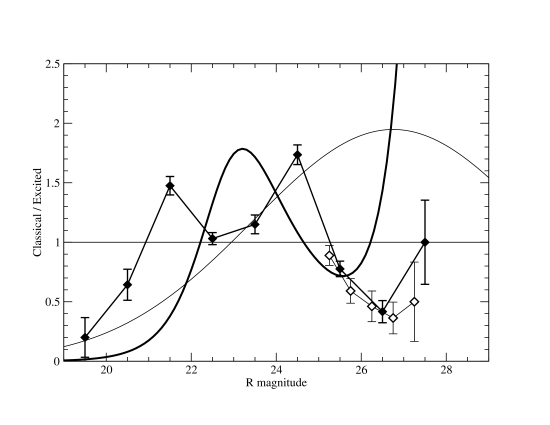
Figure 1 shows the ratio of Classical to Excited objects as a function of R magnitude (dark and light data points). An equal number of Classical and Excited TNOs would have a ratio of unity. Of the 648 TNOs in our compendium, 333 are Classical, with the remaining 315 objects belonging to the Excited class. While the Classical objects slightly dominate overall, we find that Excited objects dominate in several magnitude ranges (Figure 1). Significantly, Excited objects dominate the brightest (R22) and faintest (R25) magnitude ranges, while Classical objects dominate the middle magnitudes. The largest deviations from unity are very large, about 50%.
We also show in Figure 1 two best-fit curves from B04: a double-power law (thick curving line) and a rolling-index law (thin curving line). These two curves in B04 fit the data known at that time approximately equally well. The rolling-index law fits the present data R24 well, but the agreement is much less good at R24, where we have included significant new data in this work. The double-power law fits the present data reasonably well, with the biggest deviations faintward of R=26, where the most significant new data is found. (We do not include all of the bright-end surveys that B04 did, so the bright-end agreement between the B04 curves and the data we present here is probably satisfactory due to our bright-end incompleteness.)
Both B04 curves predict, based on fitting the data known at the time, that the R26 TNO population should be dominated by Classical objects. Clearly, this is because the data fit by B04 includes only seven objects with R26, three of which are the Classical objects discovered by B04. Compared to B04, we include here more than five times as many objects with R26. This new compilation shows that Excited objects dominate this faint population.
3 Possible biases
With such difficult observations from a range of facilities, biases could easily be significant. For example, most of the new TNOs fainter than R=26 were discovered in ground-based searches, as compared to B04’s space-based search. The most obvious difference between those two techniques is that ground-based searches have much poorer angular resolution, and therefore, in general, produce less precise orbital solutions. If some aspect of less precise solutions could preferentially produce Excited orbits then the result presented here could be explained, perhaps. As an example, the errors on the inclinations reported in Fraser et al. (2008) are typically 10–20 degrees, which means that the confidence in any individual classification of Classical may be low, while the classification of an object as Excited may be higher. This has the effect of overestimating the number of Classical TNOs, and therefore does not rectify the apparent disagreement between B04 and the present work. Additionally, as a counter-argument, the reason that B04 used inclination as the discriminant is because this orbital element is most easily and accurately measured in ground-based surveys, as inclination is manifest simply by the angle of TNO motion with respect to the ecliptic plane. Systematically overestimating this angle to the degree required to explain the results presented here is quite unlikely.
Many TNO surveys use multi-lunation follow-up observations to secure orbits, and these long arcs may be subject to biases that are dependent on dynamical class (Jones et al., 2010). However, all of the faint TNOs used here were discovered in pencil beam-type surveys, which have no long-term recovery observations. There is essentially no bias against Classical orbits in such an observational scheme.
All of the nine faint surveys whose data are compiled here searched within a few degrees of the ecliptic plane (Table 1), where there is no bias against finding Classical TNOs, with one exception: Fuentes et al. (2010) searched fields 5 degrees from the ecliptic. This should technically not introduce a bias against Classical objects, since our definition of Classical is those objects having inclinations 5 degrees. Furthermore, the Fuentes et al. (2010) search contributes only a single R26 object to our catalog, and thus can contribute little overall bias to our result.
4 Discussion
Our data compilation shows that Excited objects dominate the faint TNO population. Why, then, did B04 find only Classical objects in their survey? At R=[26.3,27.5,27.8] (the magnitudes of the three B04-discovered TNOs (Bernstein et al., 2006)), the ratio of Classical to Excited TNOs is approximately [0.4,0.5,0.5] (Figure 1) and the fraction of all TNOs that are Classical (that is, N(Classical)/(N(Classical)+N(Excited))) is therefore approximately [0.3,0.3,0.3]. The probability of finding these three Classical objects is therefore 0.33, or around 3%. To translate this binomial probability to a conceptual gaussian equivalent, this is about a 2.2 result, so not drastically improbable. This may be ample explanation. The fact that B04 discovered only three objects may indicate that small-number statistics drove the B04 analysis.
The new data presented here shows that the faint population is dominated by Excited TNOs. The much-cited “Nice model” describes a Solar System-wide upheaval that occurred some 600 Myr after the formation of the planets (Levison et al., 2008). During that event, small bodies, including TNOs, were scattered throughout the Solar System. In particular, proto-TNOs that were found within the planetary realm would have been ejected to Excited orbits outside the planets during this episode. The Levison et al. (2008) results broadly reproduce the observed structure of the TNO region, including the existence of both Excited and Classical objects. However, the specific finding that Excited TNOs are far more numerous at faint magnitudes (which probably, but not certainly, correspond to small sizes; see below) is not explained within the context of the Nice model.
Small TNOs are either the product of planetesimal formation (creation) or the result of collisional grinding among larger TNOs (destruction). Under the creation hypothesis, the ratio between Classical and Excited TNOs records their (possibly distinct) formation histories, and the fact that Excited objects dominate the bright and faint ends and not the middle is difficult to explain unless the two populations formed with very different size-frequency distributions. Alternately, small Excited TNOs may be created by the collisional destruction of larger Excited TNOs, which predicts that TNOs an order of magnitude larger than the Excited-dominated regime — that is, TNOs around R=23–24 — should be dominated by Classical objects. In other words, the “excess” of small Excited TNOs at R26 results from a collisional “deficit” of medium-sized Excited TNOs at R=23–24, which matches the observational data. Higher rates of collisional destruction among Excited than Classical TNOs could be explained simply by the fact that Excited TNOs have larger mutual velocities in the present day Kuiper Belt due to their excited orbits; a similar result has been found for the main asteroid belt (Terai & Itoh, 2008; O’Brien et al., 2009). Alternately, a higher collisional destruction rate for Excited TNOs could be a result of their hypothesized formation closer to the Sun (according to the Nice model), which would provide both shorter evolutionary timescales and higher mutual velocities. In either case, the size distribution of Excited TNOs could include subtle features that derive from collisional evolution.
Another possible explanation exists. In general, Classical objects have distances 40–45 AU. Excited objects have a wider range of heliocentric distance, and dominate the populations both closer than and farther than 40–45 AU. Therefore, one interpretation of the data shown in Figure 1 is that the ratio of Classical and Excited TNO sizes is relatively constant with size, and that the observation that the Excited population dominates the bright and faint ends reflects simply the change in apparent brightness due to the objects’ distances from the Earth. As a complicating factor, Classical TNOs appear to have higher albedos than other dynamical subgroups (Stansberry et al., 2008; Brucker et al., 2009). Thus, Classical TNOs of a given size appear fainter than Excited TNOs of the same size.
There are three very faint Classical TNOs not shown in Figure 1 (2003 BF91, R=27.5, i=1.49; 2003 BH91, R=27.8, i=1.97; and c5a4, R=28.5, i=0) because there are no Excited objects in these sparsely-populated bins, giving a ratio of infinity. Thus, in our faintest bin, we are as data-limited as B04 was — interestingly, again with only Classical objects in the faintest bin — and no significant conclusion can be drawn. New data that pushes the faint limit another 1 or 2 magnitudes would allow us to constrain this “very faint” population and help determine whether the differences in the two populations are dynamical (collisional destruction) or geometrical (similar size distributions at different locations, modulated by albedo effects). Although very difficult to obtain, new data at these very faint magnitudes will be quite powerful in constraining the history of the outer Solar System.
References
- Allen et al. (2002) Allen, R. L., Bernstein, G. M., & Malhotra, R. 2002, AJ, 124, 2949
- Bernstein et al. (2004) Bernstein, G. M., Trilling, D. E., Allen, R. L., Brown, M. E., Holman, M., & Malhotra, R. 2004, AJ, 128, 1364
- Bernstein et al. (2006) Bernstein, G. M., Trilling, D. E., Allen, R. L., Brown, M. E., Holman, M., & Malhotra, R. 2006, AJ, 131, 2364
- Brucker et al. (2009) Brucker, M. J., Grundy, W. M., Stansberry, J. A., Spencer, J. R., Sheppard, S. S., Chiang, E. I., & Buie, M. W. 2009, Icarus, 201, 284
- Chiang & Brown (1999) Chiang, E. & Brown, M. E. 1999, AJ, 118, 1411
- Elliot et al. (2005) Elliot, J. L. et al. 2005, AJ, 129, 1117
- Fraser et al. (2008) Fraser, W. C. et al. 2008, Icarus, 195, 827
- Fraser & Kavelaars (2009) Fraser, W. C. & Kavelaars, J. J. 2009, AJ, 137, 72
- Fuentes & Holman (2008) Fuentes, C. I. & Holman, M. J. 2008, AJ, 136, 83
- Fuentes et al. (2009) Fuentes, C. I., George, M. R., & Holman, M. J. 2009, ApJ, 696, 92
- Fuentes et al. (2010) Fuentes, C. I., Holman, M. J., Trilling, D. E., & Protopapas, P. 2010, AJ, in press
- Gladman et al. (2001) Gladman, B., Kavelaars, J. J., Petit, J.-M., Morbidelli, A., Holman, M. J., & Loredo, T. 2001, 122, 1051
- Jones et al. (2010) Jones, R. L., Parker, W. M., Bieryla, A., Marsden, B. G., Gladman, B., Kavelaars, J. J., & Petit, J.-M. 2010, AJ, 139, 2249
- Levison et al. (2008) Levison, H. F., Morbidello, A., Vanlaerhoven, C., Gomes, R., & Tsiganis, K. 2008, Icarus, 196, 258
- O’Brien et al. (2009) O’Brien, D. P., Michel, P., & Jutzi, M. 2009, BAAS, 41, #27.03
- Stansberry et al. (2008) Stansberry, J., Grundy, W., Brown, M., Cruikshank, D., Spencer, J., Trilling, D., & Margot, J.-L. 2008, in Solar System Beyond Neptune, Eds. Barucci et al. (Tucson: Univ. of Arizona Press), 161
- Tegler & Romanishin (2003) Tegler, S. C. & Romanishin, W. 2003, Icarus, 161, 181
- Terai & Itoh (2008) Terai, T. & Itoh, Y. 2008, in LPI Contributions Vol. 1405, 8215
| Survey | Telescope | Sensitivity | Area (deg2) | Ecl. lat. (deg) | |
|---|---|---|---|---|---|
| Chiang & Brown (1999) | Keck | 27.9 (V) | 0.01 | 0.54 | 1 |
| Gladman et al. (2001) | CFHT, VLT | 25.9 (R), 26.7 (R) | 0.27, 0.012 | 2.64, 1.04 | 3, 0 |
| Allen et al. (2002) | NOAO 4-m | 24.9 – 25.4 (R) | 2.3 | 0.02–1.93 | 0 |
| Bernstein et al. (2004, 2006) | HST | 29.2 (F606W) | 0.02 | 1.48 | 3 |
| Elliot et al. (2005) | NOAO 4-m | 22.5 (VR) | 550 | 6 | 0 |
| Fraser et al. (2008) | CFHT, CTIO 4-m | 25.1 (VR) – 26.4 (g′) | 3.0 | 0.06–0.76 | 3 |
| Fuentes & Holman (2008) | Subaru | 25.7 (R) | 2.8 | 0.13–1.88 | 0 |
| Fraser & Kavelaars (2009) | Subaru | 26.9 (r′) | 0.26 | 0.29 | 18 |
| Fuentes et al. (2009) | Subaru | 26.8 (R) | 0.26 | 0.6 | 10 |
| Fuentes et al. (2010) | HST | 26.1 (R) | 0.45 | 5 | 1 |
Note. — We list here the 10 surveys whose data we compile in this work. The 50% sensitivities in the indicated filter are given along with the searched area, absolute value of the ecliptic latitude of the search, and number of objects R26 that were detected. We used V-R=0.6 (Tegler & Romanishin, 2003); VR-R=0.03 (Fraser et al., 2008); g′-R=0.95 (Fraser et al., 2008); and r′-R=0.26 (Fraser et al., 2008) to convert to R magnitudes.