A Reconnecting Current Sheet Imaged in A Solar Flare
Abstract
Magnetic reconnection changes the magnetic field topology and powers explosive events in astrophysical, space and laboratory plasmas. For flares and coronal mass ejections (CMEs) in the solar atmosphere, the standard model predicts the presence of a reconnecting current sheet, which has been the subject of considerable theoretical and numerical modeling over the last fifty years, yet direct, unambiguous observational verification has been absent. In this Letter we show a bright sheet structure of global length () and macroscopic width ((5–10) km) distinctly above the cusp-shaped flaring loop, imaged during the flare rising phase in EUV. The sheet formed due to the stretch of a transequatorial loop system, and was accompanied by various reconnection signatures that have been dispersed in the literature. This unique event provides a comprehensive view of the reconnection geometry and dynamics in the solar corona.
1 Introduction
A vertical current sheet is expected to form above the flare loop when a closed magnetic structure is highly stretched in solar conditions (Kopp & Pneuman, 1976; Karpen et al., 1995; Lin & Forbes, 2000; Linker et al., 2003). Pieces of indirect evidence highly suggestive of such a reconnection geometry have accumulated over decades of observations (Priest & Forbes, 2002). These include candlelight flare loops implying an X-type or Y-type reconnection point above the cusp (Tsuneta et al., 1992), high-temperature plasma along the field lines mapping to the tip of the cusp (Tsuneta, 1996), loop shrinkage implying the relaxation of newly reconnected field lines (Forbes & Acton, 1996), a hard X-ray (HXR) source above the soft X-ray loop top (Masuda et al., 1994), upward-moving plasmoid (Shibata et al., 1995) and supra-arcade downflows (McKenzie & Hudson, 1999) implying reconnection outflows, horizontal converging motion above a cusp-shaped flare loop implying reconnection inflows (Yokoyama et al., 2001), and a double coronal source morphology in HXRs implying the formation of a current sheet between the two sources (Sui & Holman, 2003). Recently, considerable attention has been given to a coaxial, bright ray feature that appears several hours after some CMEs (Ciaravella et al., 2002; Ko et al., 2003; Raymond et al., 2003; Webb et al., 2003; Lin et al., 2005; Bemporad et al., 2006; Ciaravella & Raymond, 2008; Lin et al., 2009). The flaring-time current sheet, however, has not been directly detected yet.
In this Letter, we study a transequatorial loop system (TLS), whose eruption on 2004 July 29 resulted in a halo CME and a GOES-class C2.1 flare. Most importantly, a bright elongated feature is observed to extend above a cusp-shaped flare loop during the impulsive phase, whose geometry and dynamics are highly suggestive of a reconnecting current sheet.
2 Observation
2.1 Instruments
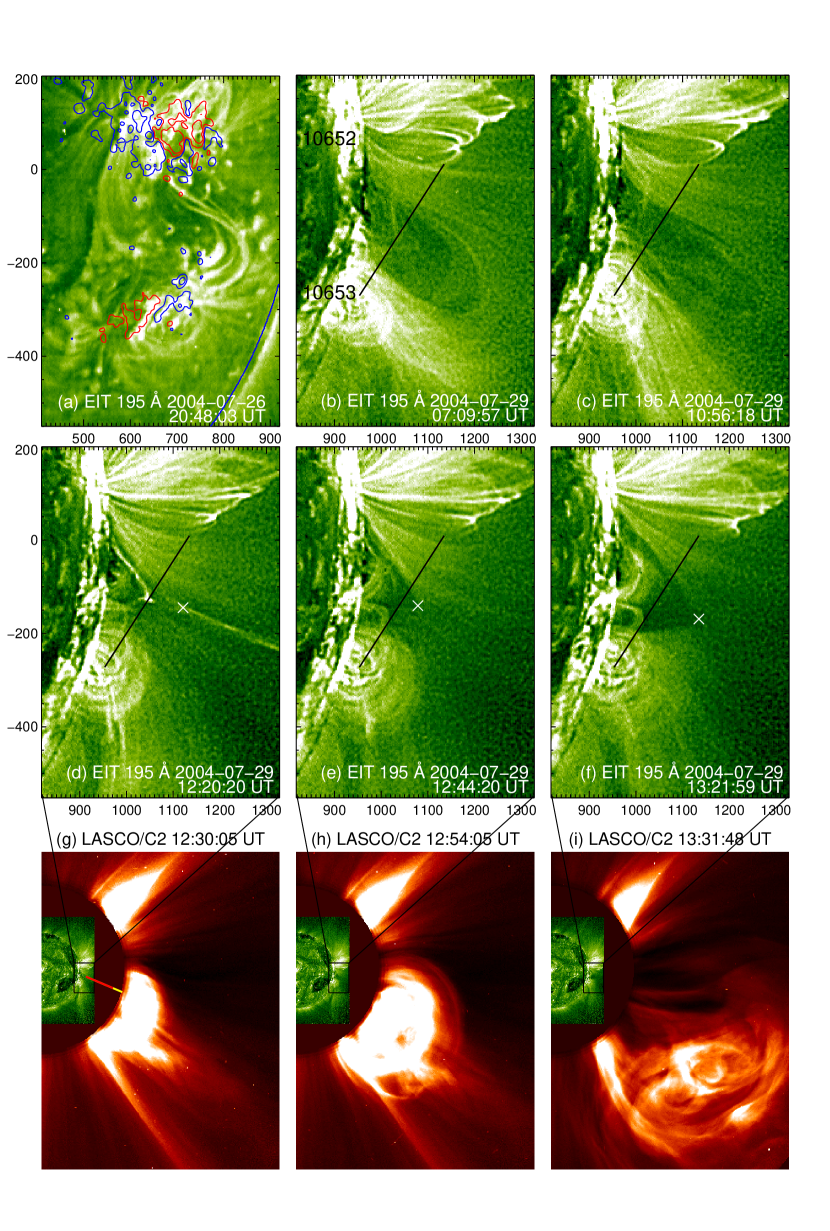
The TLS connected NOAA AR 10652 to AR 10653 (1(a) and (b)). During its disk passage, the TLS was oriented primarily in the north-south direction, with the northern footpoints located to the east of the southern ones by . When rotated with the Sun to the west limb, the TLS erupted as a halo CME associated with a flare at about 12:00 UT on 2004 July 29, observed by the EUV Imaging Telescope (EIT; Delaboudinière et al., 1995) on board the Solar and Heliospheric Observatory (SOHO). EIT takes full-disk images at a pixel scale of pixel-1 and 12-min cadence in a narrow bandpass centered on 195 Å (Fe XII; K). The 195 Å channel is also sensitive to high-temperature flare plasma (Tripathi et al., 2006), because of the presence of the Fe XXIV resonance line (192; K) . In addition to the standard EIT data processing, we have further removed the instrumental stray-light background, and enhanced the fine coronal structures in EIT images with a wavelet method (Stenborg et al., 2008). The Coronal Diagnostic Spectrometer (CDS; Harrison et al., 1995) on board SOHO was also pointing at AR 10652. A raster scan from 13:32 to 15:32 UT covered the northern leg of the post-flare loop, despite the limited field of view (FOV; ) of the raster images. The ensuing CME was observed in white-light by the Large Angle and Spectrometric Coronagraph (LASCO; Brueckner et al., 1995) on board SOHO, which consists of two optical systems, C2 (2.2–6.0 ) and C3 (4–32 ). Relevant radio emissions were recorded by the Green Bank Solar Radio Burst Spectrometer (GBSRBS) on the ground and the WAVES instrument on board the WIND spacecraft (Bougeret et al., 1995).
2.2 Analysis
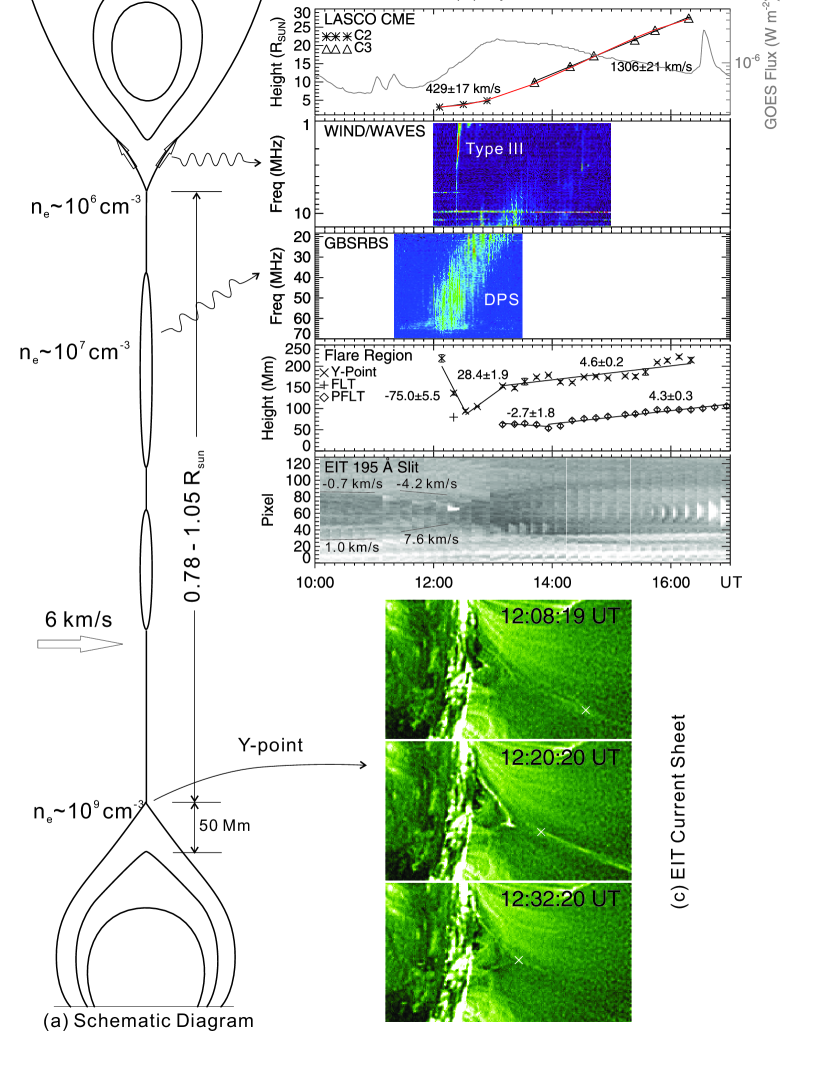
The TLS that erupted on 2004 July 29 12:00 UT can be clearly seen to slowly rise from as early as 2004 July 28 21:12 UT. With footpoints being “fixed” on the extremely dense photosphere, the “waist” of the TLS became thinner and thinner (1(b)–(c)). By placing a slit across the waist (1(b)–(f)), and then putting the resultant strips in chronological order (bottom panel of 2(b)), one can see that initially the waist converged at 1 km s-1, and then the speed suddenly increased to km s-1 from 11:08 until 12:20 UT when a cusp-shaped flare loop formed (1(d); Tsuneta, 1996). Meanwhile, from 11:30 till 13:30 UT, GBSRBS recorded drifting pulsating structures (DPSs) at metric frequencies (3rd panel of 2(b)), suggestive of the tearing of a current sheet (2(a); Kliem et al., 2000). In this scenario, electrons are accelerated and trapped as the plasmoids (magnetic islands) contract and mutually interact, probably in a classic Fermi manner (Drake et al., 2006), which generate the individual pulses of the DPSs; motions of the plasmoids in the corona result in the global drift of the DPSs. With reconnection sets in, we expect that the plasma near the reconnection region would be rapidly heated to flaring temperatures in excess of K, which would make the reconnection region a bright feature in EUV lines of highly ionized lines, such as Fe XXIV covered by the EIT 195 Å filter.
Indeed, at 12:20 UT (1(d)), a bright, collimated feature can be seen to extend from well above a cusp-shaped flare loop for 170 Mm () up to the border of the EIT FOV (), indicating that the TLS had been stretched to the point that the oppositely directed field lines at the waist were close enough to reconnect. The morphology is similar to that in the standard model (Kopp & Pneuman, 1976), and the extended sheet structure favors a Y-type (Lin & Forbes, 2000) over an X-type geometry (Yokoyama & Shibata, 2001). The sheet spans about 3–5 EIT pixels, i.e., (5–10) km. Hence the observed thickness is not resolution-limited since the EIT point spread functions are narrower than the pixel size of the CCD (Delaboudinière et al., 1995). However, projection effects could increase the apparent thickness by a factor of 2–4 (Lin et al., 2009). The (inverse) Y-point, i.e., the lower tip of the sheet, is above the cusp-shaped flare looptop by about 50 Mm, with the height ratio of about 1.6 between the Y-point and the looptop. From 12:08 to 12:32 UT, the lower tip of the sheet (2(b–c)) moved toward the solar surface. Meanwhile (12:23 UT), the WIND spacecraft recorded a Type III burst (2nd panel of 2(b)), indicative of accelerated electrons beaming upward from the upper tip of the current sheet (2(a); McLean & Labrum, 1985). One can see from the radio spectrograms that the starting frequency of the Type III burst, . By exploiting the density profile known as the Baumbach-Allen formula (Cox, 2001), one obtains that , where is the heliocentric distance of the upper tip of the current sheet. The heliocentric distance of the lower tip, , is measured to be ; and the sheet orientation is deviant from the radial direction by , hence the sheet length, , can be estimated, i.e., (1(g)).
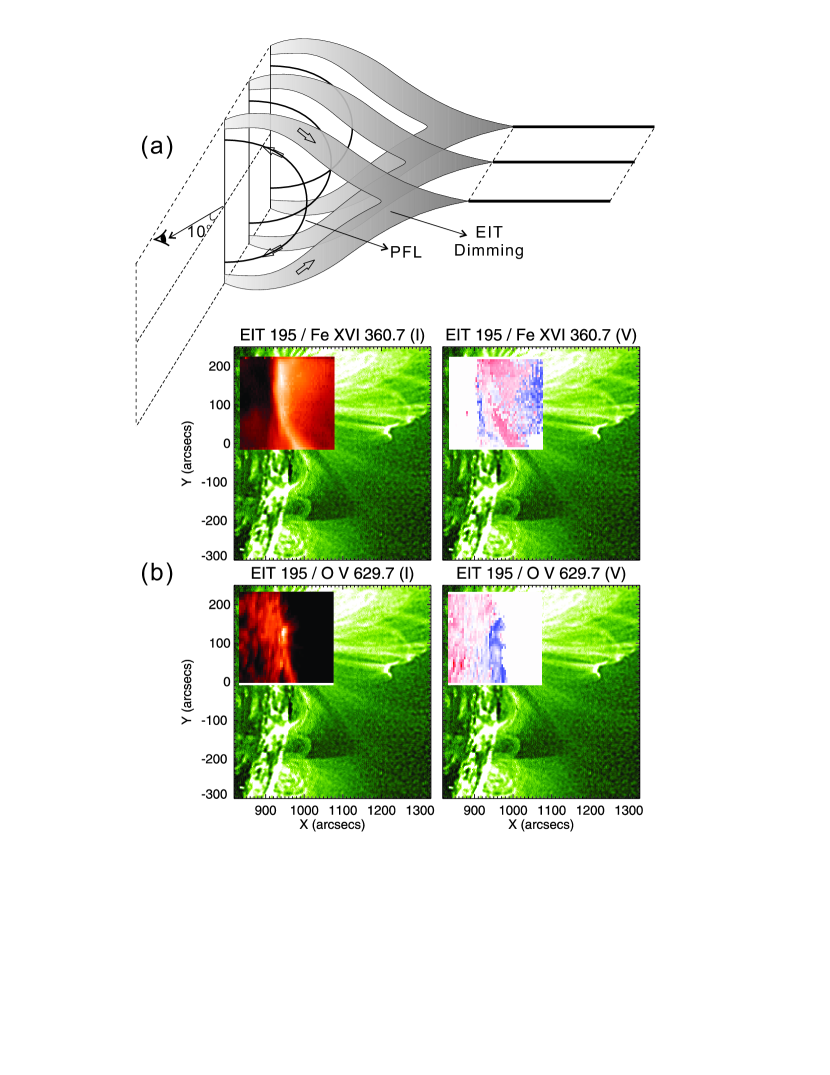
The sheet and the cusp-shaped flare loop are visible probably due to the Fe XXIV emission (; K). Both faded out quickly after the temporary appearance, presumably due to cooling. The flare loop reappeared at 13:09 UT at a lower altitude by about 17 Mm, taking a relaxed shape (e.g., 1(f)), above which appeared an emission-depressed, cusp-shaped region (1(e)–(f)). Note that the bright loops apparently within the southern leg of the dimming region are not newly formed but relatively long-lived active-region loops of AR 10653, which may be located in the foreground or background due to the optically thin nature of coronal lines. The EIT cusp-shaped dimming is in emission in the hot Fe XVI line (; K; top left panel of 3(b)), while remaining dark in the cold O V line (; K; bottom left panel of 3(b)). Clearly, the cusp-shaped region hosts newly reconnected flux tubes that later cooled and relaxed into the dipolar post-flare loops (Forbes & Acton, 1996). Velocity maps (right column of 3(b)) show that Doppler redshifts dominate in the cusp-shaped region in Fe XVI, while blueshifts dominate in the post-flare arcade in O V. This is because the flare-loop plane is tilted eastward by about as illustrated in 3(a), hence upflows due to evaporated chromospheric plasma filling the newly reconnected flux tubes bear a velocity component away from the observer (redshift) at the northern leg of the cusp-shaped region; meanwhile, downflows due to cooled plasma falling back along the relaxed field bear a velocity component toward the observer (blueshift) at the northern leg of the post-flare arcade. As an important consequence of the reconnection in the corona, the evaporation takes place when chorompospheic material is heated by precipitating nonthermal electrons or thermal conduction (Priest & Forbes, 2002). Both the cusp-shaped dimming and the underlying post-flare arcade expanded with time (1(e)–(f)), implying reconnection proceeding to higher and higher altitudes (Priest & Forbes, 2002).
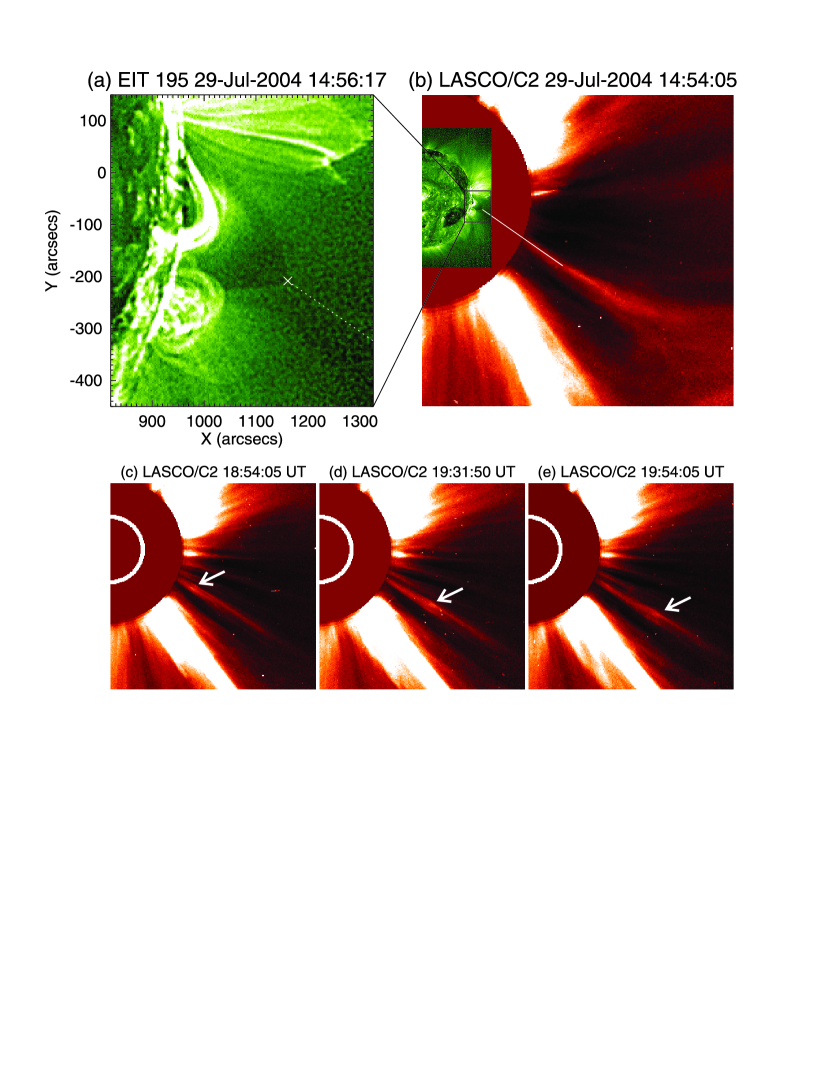
Despite the low contrast, one can still get a sense of the orientation of the current sheet from the cusp morphology. It was apparently aligned with a post-CME ray feature observed in coronagraph (top panels of 4). The ray was seen to rapidly fan out above its upper tip (4(b)) in a similar fashion as the vertical current sheet does in the models (Kopp & Pneuman, 1976; Lin & Forbes, 2000), which is not reported in previous observations (e.g., Webb et al., 2003; Ko et al., 2003; Lin et al., 2005). A blob was observed to move outward along the ray at 360 km s-1 (bottom panels of 4), implying the ejection of a plasmoid.
These observations allow us to estimate the rate of magnetic reconnection, , given by the ratio between the inflow and the outflow speed (Priest & Forbes, 2000). If we relate the ejected blob to the reconnection outflow (Ko et al., 2003; Lin et al., 2005), and assume that the reconnection inflow can be characterized by the converging of the loop waist (1 and the bottom panel of 2(b); Yokoyama et al., 2001), then 0.01–0.02, despite the caveat that the outflow is not simultaneous to the inflow. According to the steady reconnection theory Priest & Forbes (2000), the sheet thickness for a diffusion region of length and width . With and 0.01–0.02, we find that (5–15) km, in good agreement with the observed sheet thickness ((5–10) km). The dissipation of the current sheet may help further accelerate the CME to a speed (1300 km s-1; top panel of 2(b)) much faster than the one (400 km s-1) when the current sheet was first detected. A follow-up paper is being prepared on more detailed properties of this reconnection region.
3 Conclusion & Discussion
The various reconnection signatures observed in this single event, including plasma inflow and outflow, an expanding cusp-shaped dimming, chromospheric evaporation, and the relevant radio emissions, constitute for the first time a comprehensive view of the reconnection dynamics in the solar corona. Taking its formation, geometry and dynamics into account, we conclude that the bright, elongated EUV feature observed above the cusp-shaped flaring loop is a Y-type current sheet.
This unique observation has several important implications. First of all, the Y-type reconnection geometry together with the above dynamic features constitutes direct verification of the standard physical picture for flares/CMEs (Kopp & Pneuman, 1976; Lin & Forbes, 2000), which has been invoked in other astrophysical phenomena beyond stellar flares, e.g., episodic jets from black hole systems (Yuan et al., 2009). Second, the fact that the lower tip of the current sheet is located well above the cusp-shaped flare loop provides an unequivocal evidence that particle acceleration in solar flares occurs well above the flare loop. The reconnection geometry observed here agrees with an independent study of electron time-of-flight (TOF; Aschwanden et al., 1996), in which a scaling law is found between the electron TOF distance , indicating the height of the acceleration site, and the flare-loop half length , i.e., . Third, the fact that the lower tip of the current sheet initially moved downward supports the conjecture that the descending motion of the flare looptop emission during the flare rising phase, which the standard flare model fails to explain, is due to the extending of a current sheet (Sui & Holman, 2003). In our case, the plasma inflows due to the stretch of the TLS may bring in flux faster than the rate of dissipation. With the flux piling up, the diffusion region grows in length in both (upward and downward) directions until it reaches the global dimension () and becomes subject to tearing (Biskamp, 1986). Fourth, the imaging observation allows for a direct measurement of the thickness of the flaring-time current sheet. The measured width ((5–10) km) is an order of magnitude thinner than that of post-CME rays ( km; Ciaravella et al., 2002; Ko et al., 2003; Ciaravella & Raymond, 2008; Lin et al., 2009). However, it agrees with the steady reconnection theory (Priest & Forbes, 2000), and matches not only the width (4 km) of high-speed outflows of hot plasma near a reconnection site, detected in EUV spectra (Wang et al., 2007), but also the thickness ((3–10) km) of the heliospheric current sheet measured in situ (Winterhalter et al., 1994). Thus, we have obtained a tight upper limit to the “true” thickness of the current sheet in the solar corona. Finally, the observation of a current sheet of global length and macroscopic width, which is associated with radio pulsations (Kliem et al., 2000), supports recent theoretical studies which conclude that a single localized reconnection region cannot account for the large number of energetic electrons typically seen in flares (e.g., Egedal et al., 2009).
References
- Aschwanden et al. (1996) Aschwanden, M. J., Kosugi, T., Hudson, H. S., Wills, M. J., & Schwartz, R. A. 1996, ApJ, 470, 1198
- Bemporad et al. (2006) Bemporad, A., Poletto, G., Suess, S. T., Ko, Y., Schwadron, N. A., Elliott, H. A., & Raymond, J. C. 2006, ApJ, 638, 1110
- Biskamp (1986) Biskamp, D. 1986, Physics of Fluids, 29, 1520
- Bougeret et al. (1995) Bougeret, J., Kaiser, M. L., Kellogg, P. J., et al. 1995, Space Science Reviews, 71, 231
- Brueckner et al. (1995) Brueckner, G. E., Howard, R. A., Koomen, M. J., et al. 1995, 162, 357
- Ciaravella & Raymond (2008) Ciaravella, A. & Raymond, J. C. 2008, ApJ, 686, 1372
- Ciaravella et al. (2002) Ciaravella, A., Raymond, J. C., Li, J., Reiser, P., Gardner, L. D., Ko, Y., & Fineschi, S. 2002, ApJ, 575, 1116
- Cox (2001) Cox, A. N. 2001, Allen’s astrophysical quantities, 4th edn., ed. Cox, A. N. (Springer)
- Delaboudinière et al. (1995) Delaboudinière, J., Artzner, G. E., Brunaud, J., et al. 1995, Sol. Phys., 162, 291
- Drake et al. (2006) Drake, J. F., Swisdak, M., Che, H., & Shay, M. A. 2006, Nature, 443, 553
- Egedal et al. (2009) Egedal, J., Daughton, W., Drake, J. F., Katz, N., & Lê, A. 2009, Physics of Plasmas, 16, 050701
- Forbes & Acton (1996) Forbes, T. G. & Acton, L. W. 1996, ApJ, 459, 330
- Harrison et al. (1995) Harrison, R. A., Sawyer, E. C., Carter, M. K., et al. 1995, Sol. Phys., 162, 233
- Karpen et al. (1995) Karpen, J. T., Antiochos, S. K., & Devore, C. R. 1995, ApJ, 450, 422
- Kliem et al. (2000) Kliem, B., Karlický, M., & Benz, A. O. 2000, A&A, 360, 715
- Ko et al. (2003) Ko, Y., Raymond, J. C., Lin, J., Lawrence, G., Li, J., & Fludra, A. 2003, ApJ, 594, 1068
- Kopp & Pneuman (1976) Kopp, R. A. & Pneuman, G. W. 1976, Sol. Phys., 50, 85
- Lin & Forbes (2000) Lin, J. & Forbes, T. G. 2000, J. Geophys. Res., 105, 2375
- Lin et al. (2005) Lin, J., Ko, Y., Sui, L., Raymond, J. C., Stenborg, G. A., Jiang, Y., Zhao, S., & Mancuso, S. 2005, ApJ, 622, 1251
- Lin et al. (2009) Lin, J., Li, J., Ko, Y., & Raymond, J. C. 2009, ApJ, 693, 1666
- Linker et al. (2003) Linker, J. A., Mikić, Z., Lionello, R., et al. 2003, Phys. Plasmas, 10, 1971
- Masuda et al. (1994) Masuda, S., Kosugi, T., Hara, H., Tsuneta, S., & Ogawara, Y. 1994, Nature, 371, 495
- McKenzie & Hudson (1999) McKenzie, D. E. & Hudson, H. S. 1999, ApJ, 519, L93
- McLean & Labrum (1985) McLean, D. J. & Labrum, N. R. 1985, Solar radiophysics: Studies of emission from the sun at metre wavelengths, ed. McLean, D. J. & Labrum, N. R.
- Priest & Forbes (2000) Priest, E. & Forbes, T. 2000, Magnetic Reconnection, ed. Priest, E. & Forbes, T.
- Priest & Forbes (2002) Priest, E. R. & Forbes, T. G. 2002, A&A Rev., 10, 313
- Raymond et al. (2003) Raymond, J. C., Ciaravella, A., Dobrzycka, D., Strachan, L., Ko, Y., Uzzo, M., & Raouafi, N. 2003, ApJ, 597, 1106
- Shibata et al. (1995) Shibata, K., Masuda, S., Shimojo, M., Hara, H., Yokoyama, T., Tsuneta, S., Kosugi, T., & Ogawara, Y. 1995, ApJ, 451, L83+
- Stenborg et al. (2008) Stenborg, G., Vourlidas, A., & Howard, R. A. 2008, ApJ, 674, 1201
- Sui & Holman (2003) Sui, L. & Holman, G. D. 2003, ApJ, 596, L251
- Tripathi et al. (2006) Tripathi, D., Del Zanna, G., Mason, H. E., & Chifor, C. 2006, A&A, 460, L53
- Tsuneta (1996) Tsuneta, S. 1996, ApJ, 456, 840
- Tsuneta et al. (1992) Tsuneta, S., Hara, H., Shimizu, T., Acton, L. W., Strong, K. T., Hudson, H. S., & Ogawara, Y. 1992, PASJ, 44, L63
- Wang et al. (2007) Wang, T., Sui, L., & Qiu, J. 2007, ApJ, 661, L207
- Webb et al. (2003) Webb, D. F., Burkepile, J., Forbes, T. G., & Riley, P. 2003, Journal of Geophysical Research (Space Physics), 108, 1440
- Winterhalter et al. (1994) Winterhalter, D., Smith, E. J., Burton, M. E., Murphy, N., & McComas, D. J. 1994, J. Geophys. Res., 99, 6667
- Yokoyama et al. (2001) Yokoyama, T., Akita, K., Morimoto, T., Inoue, K., & Newmark, J. 2001, ApJ, 546, L69
- Yokoyama & Shibata (2001) Yokoyama, T. & Shibata, K. 2001, ApJ, 549, 1160
- Yuan et al. (2009) Yuan, F., Lin, J., Wu, K., & Ho, L. C. 2009, MNRAS, 395, 2183