An Extragalactic 12CO = 3–2 survey with the Heinrich-Hertz-Telescope
Abstract
We present results of a 12CO = 3–2 survey of 125 nearby galaxies obtained with the 10-m Heinrich-Hertz-Telescope, with the aim to characterize the properties of warm and dense molecular gas in a large variety of environments. With an angular resolution of 22′′, 12CO 3–2 emission was detected in 114 targets. Based on 61 galaxies observed with equal beam sizes the 12CO 3–2/1–0 integrated line intensity ratio is found to vary from 0.2 to 1.9, with an average value of 0.81. No correlations are found for to Hubble type and far infrared luminosity. Possible indications for a correlation with inclination angle and the 60m/100m color temperature of the dust are not significant. Higher ratios than in “normal” galaxies, hinting at enhanced molecular excitation, may be found in galaxies hosting active galactic nuclei. Even higher average values are determined for galaxies with bars or starbursts, the latter being identified by the ratio of infrared luminosity versus isophotal area, log [()/(/kpc2)] 7.25. (U)LIRGs are found to have the highest averaged value. This may be a consequence of particularly vigorous star formation activity, triggered by galaxy interaction and merger events. The nuclear CO luminosities are slightly sublinearly correlated with the global FIR luminosity in both the 12CO = 3–2 and the 1–0 lines. The slope of the log-log plots rises with compactness of the respective galaxy subsample, indicating a higher average density and a larger fraction of thermalized gas in distant luminous galaxies. While linear or sublinear correlations for the 12CO = 3–2 line can be explained, if the bulk of the observed = 3–2 emission originates from molecular gas with densities below the critical one, the case of the 12CO = 1–0 line with its small critical density remains a puzzle.
Subject headings:
galaxies: ISM – galaxies: starburst – galaxies: active – radio lines: galaxies – ISM: molecules – surveys1. Introduction
Low lying rotational transitions of CO are widely used as tracers of molecular hydrogen and are essential to determine dynamical properties and total molecular masses of galaxies. The widespread use of 12CO = 1–0 and 2–1 (hereafter CO(1–0) and CO(2–1)) spectroscopy (e.g. Braine et al., 1993; Young et al., 1995; Chini et al., 1996; Elfhag et al., 1996; Albrecht et al., 2004, 2007) is, however, not sufficiently complemented by systematic surveys in higher rotational CO transitions to constrain the excitation conditions of the dense interstellar medium (ISM). While the = 1 and 2 states of CO are only 5.5 and 17 K above the ground level, the = 3 state is at 33 K and traces a component of higher excitation. The “critical densities”, at which collisional de-excitation matches spontaneous decay in the optically thin limit, is 105 for 12CO = 3–2 (hereafter CO(3–2)) in contrast to 103.5 and 104.3 for the two lower rotational CO transitions. Therefore, the CO(3–2) line is a particularly useful tracer of the molecular gas properties in the central regions of galaxies, where the molecular gas is generally believed to be warmer and denser than in typical galactic disk clouds (e.g., Güsten et al., 1981; Mauersberger & Henkel, 1993). The CO(3–2) to (1–0) line intensity ratio is better suited to constrain the gas temperature and density than the ratio of CO(2–1) to (1–0).
In the local universe, most of the evidence for a higher excited gas phase comes from species other than CO. In many cases, however, such rare molecular species are difficult to detect, particularly in higher excited transitions. To investigate properties (e.g. spatial density, column density, kinetic temperature) of the bulk of the gas for a large sample of galaxies, observations of strong lines are needed. Thus, CO transitions of higher excitation have to be observed. This has been proved to be very successful in the first extragalactic CO(3–2) survey encompassing a significant (29) number of galaxies (Mauersberger et al., 1999), in which CO(3–2) was detected in all of the targets studied.
Encouraged by this result (see also Devereux et al., 1994), we have used the Heinrich Hertz Telescope (HHT) on Mt. Graham (Baars & Martin, 1996) to observe the CO(3–2) line in an extended sample of galaxies. After we started this extended project, additional extragalactic CO(3–2) surveys have been carried out, aiming at different types of galaxies. These include Virgo cluster galaxies (Hafok & Stutzki, 2003), infrared luminous galaxies (Yao et al., 2003; Narayanan et al., 2005), early type galaxies (Vila-Vilaró et al., 2003), compact and dwarf galaxies (Meier et al., 2001; Israel, 2005), double barred galaxies (Petitpas & Wilson, 2003, 2004), nearby galaxies of various types (Bayet et al., 2006), and most recently some nearby spiral and elliptical galaxies with two newly mounted submillimeter telescopes in Chile, APEX and ASTE (Nakanishi et al., 2007; Komugi et al., 2007; Galaz et al., 2008). Some extended CO(3–2) maps were also reported toward a handful of nearby galaxies (e.g., Dumke et al., 2001; Muraoka et al., 2009; Warren et al., 2010). Interferometric CO(3–2) maps of individual galaxies are also feasible thanks to the Submillimeter Array (hereafter SMA; see, e.g., Wilson et al., 2008, 2009). However, the detailed study of warm gas in nearby galaxies is still in its infancy. This is regrettable, in particular because of its crucial role in highly redshifted targets, where not CO(1–0) but higher excited CO lines are commonly observed (e.g., Solomon & Vanden Bout, 2005).
In this paper, we present the results of our survey, which covers the by far largest sample of galaxies measured so far in the CO(3–2) line. The data were obtained in a “coherent” way, making use of a specific telescope/receiver/backend combination. With complementary information from CO(1–0), taken from the literature, we thus present a data base of unprecedented size, providing a suitable basis to check the quality of our data (as well as those reported earlier) and allowing us to tackle a number of astrophysical questions. The data are used for the following main purposes: 1) to provide a large and homogeneous data set of CO(3–2) spectra, which will form an essential basis for future studies, either aiming at higher angular resolution or searching for higher excited CO transitions see, e.g., (Van der Werf et al., 2010) for a pioneering study), 2) to systematically trace the global properties of the warm and dense molecular gas in various galaxies, 3) to test whether there are any correlations between the molecular gas excitation (given by the CO(3–2)/CO(1–0) intensity ratio) and galaxy properties such as Hubble type, nuclear activity, far infrared (FIR:40–400 m) luminosity, 60m/100 color temperature of the dust, and inclination, 4) to evaluate the effect of galaxy interactions on the molecular gas properties, 5) to test whether the CO(3–2) line is a better tracer of star formation than the CO(1–0) line, and 6) to evaluate the Schmidt-Kennicutt law in the light of the new data. We present the sample selection in §2, the observations in §3, the basic results in §4, a systematic analysis of correlations in §5, and the summary in §6.
2. The samples
2.1. Sample selection
Our sample selected for the CO(3–2) survey consists of 125 galaxies which are part of five major partially overlapping sub-samples. Table LABEL:tbl:basic lists all the sample galaxies along with some basic properties mostly drawn from the NED111The NASA/IPAC Extragalactic Database (NED) is operated by the Jet Propulsion Laboratory, California Institute of Technology, under contract with the National Aeronautics and Space Administration. and HyperLEDA222HyperLEDA database: http://leda.univ-lyon1.fr (Paturel et al., 2003).
The first sub-sample consists of 58 nearby galaxies of various types. It contains 22 reobserved sources that were already part of our initial survey (Mauersberger et al., 1999), and is complemented by the remaining IRAS point sources with Jy and (Henkel, Wouterloot & Bally, 1986) as well as sources observed by Braine et al. (1993) in the CO (1–0) and (2–1) transitions (with the IRAM 30-m telescope) if integrated intensities are 10 K .
The second sub-sample consists of 32 galaxies from a volume limited sample (7000 ) of all Seyfert galaxies and low-ionization nuclear emission-line regions (LINERs) in Huchra’s catalog of AGN (Huchra, 1993) or in the Véron-Cetty & Véron (1991) catalog that are also included in the Revised Shapley Ames Catalog (RSA) and that are accessible with the HHT (74 in total).
The third sub-sample consists of 25 early type galaxies from Henkel & Wiklind (1997) with CO(1–0) and/or CO(2–1) lines detected. Observations at radio, optical, and X-ray wavelengths have shown that early-type galaxies contain an interstellar medium (ISM) comprising the same components as found in spiral galaxies, but with different mass fractions of the gas components (see also Henkel & Wiklind 1997 for a review).
The fourth sub-sample consists of clearly identified 11 interacting or merging systems, which are mainly luminous infrared galaxies (LIRGs, 1011 L⊙ 1012 L⊙). The selection is based on their relatively high single dish and/or interferometer CO(1–0) fluxes (see, e.g., Sanders et al., 1991; Gao et al., 1999; Lo et al., 2000, and references therein). These galaxy systems are thought to be at different merging/interaction phases, i.e. at the early (presumably pre-starburst: Arp 303N/S, UGC 8335A/B, NGC 5257/8, Arp 302N/S, Arp 293 and NGC 6670A/B), intermediate (Arp 55, Mrk 848 and NGC 4038/9), or late stages of interaction (NGC 1614, NGC 5256), according to the spatial separation of the respective galaxy pair in each system. The two core positions of five early mergers (not Arp 293) as well as NGC 4038/9 (the Antennae) were measured separately because they are spatially resolved by our 22′′ beam (see §3). Including these double core positions, the fourth sub-sample contains a total of 17 individual sources. For the central position of Arp 302, “Arp 302 center” (Table LABEL:tbl:basic), see also §A.2.
The members of the fifth sub-sample are prominent OH megamaser galaxies, including 4 ultraluminous infrared galaxies (ULIRGs, 1012 L⊙: IRAS 17208-0014, Mrk 231, Mrk 273, and Arp 220) and 2 LIRGs (III ZW 35 and NGC 3690B), all of them being late mergers (following the classification outlined above), except NGC 3690B, which is “early”.
2.2. Sample properties as a whole
2.2.1 The IRAS fluxes
98 of our sample galaxies are part of the Revised Bright Galaxy Sample (RGBS) by Sanders et al. (2003), which provides revised IRAS fluxes. 23 of these were determined with particularly high precision, also profiting from the HIRES imaging reconstruction technique (Surace et al., 2004). With the higher spatial resolution obtained by this technique, four of our galaxy pairs (i.e., Arp 303N/S, NGC 5257/8, UGC 8335A/B, and Arp 302N/S) are resolved and fluxes for each individual galaxy are available. The mid- to far-IR emission of the NGC 4038/9 system (the Antennae) originates predominantly from the overlap region where the disks of two galaxies interact (e.g., Schulz et al., 2007). Flux densities directly obtained from IRAS catalogs, i.e. the IRAS Point Source Catalog (PSC; Joint IRAS Science Working Group, 1988), the IRAS Explanatory Supplement (Beichman et al., 1988), and the IRAS Faint Source Catalog (FSC; Moshir et al., 1992) were taken for the rest of the sample. We then applied the flux densities to calculate the FIR luminosity ( = (40–400 m), following Moshir et al. (1992), and the 60 m/100 m color temperature (), assuming an emissivity that is proportional to the frequency . Two galaxies, IC 750 and NGC 4138, were not observed by IRAS.
2.2.2 Galaxy classifications
With improved observations, galaxy classifications may have to be modified in some cases. We have used the NED classifications from August 2008 as standard throughout the paper. While Seyferts/LINERs can be directly recognized from NED, starbursts are not explicitly indicated. There exists a variety of definitions of the starburst phenomenon in the literature, which have been reviewed by, e.g., Heckman (2005) and Kennicutt et al. (2005). A starburst can be defined in terms of its absolute star forming rate (SFR), its SFR surface density (the SFR per unit area), or if its SFR exceeds an average value from the past by a fixed amount. The situation is further complicated by the choice of the respective SFR tracer like, e.g., the ultraviolet emission, the far infrared emission, or the radio continuum. Spectroscopic tracers like recombination lines (e.g., H) have also been frequently used.
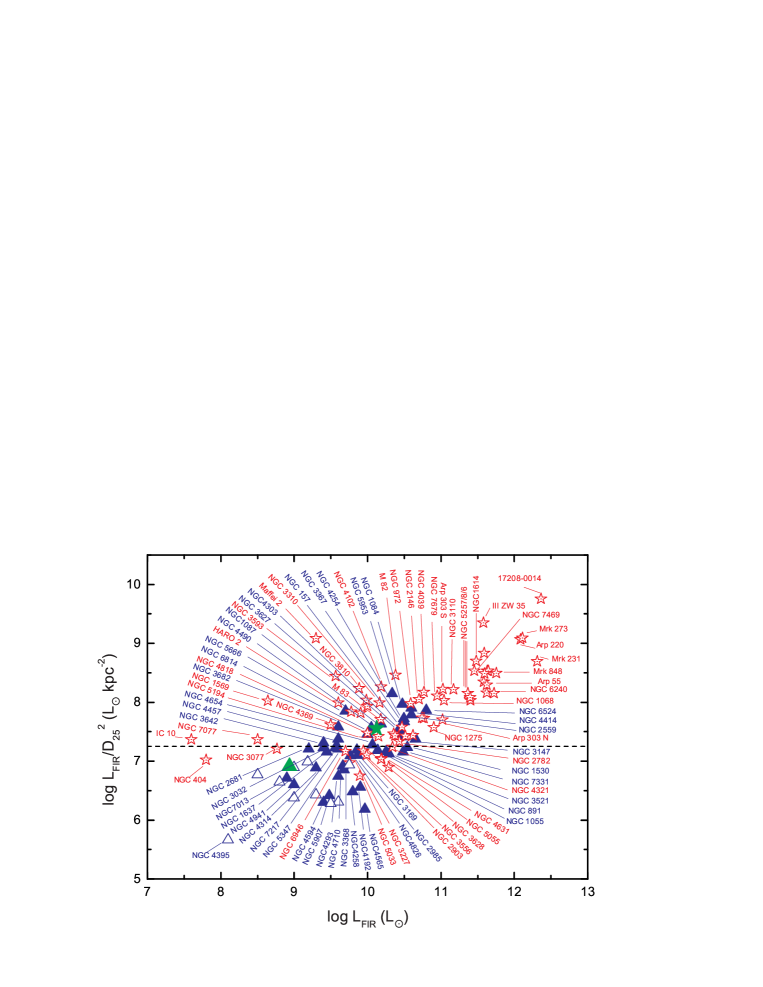
Here we select as the measure of the SFR and define a starburst galaxy in terms of its SFR surface density. Lacking high resolution information, we use with the isophotal diameter the ratio / to determine the SFR surface density and classify targets with log (/) 7.25 L⊙ kpc-2 as starburst galaxies. This parameter is plotted as a function of log in Fig. 1, where the boundary between starburst and non-starburst galaxies is marked by a dashed horizontal line. The borderline was chosen to ensure that most of the well known starburst galaxies are properly classified. Galaxies, which were classified as starbursts in the literature (regardless of the details of the definition), are marked as stars. While all (U)LIRGs and most of the well known starburst galaxies are well above the borderline, there are 19 galaxies that were “misclassified” (following our definition) as non-starbursts and 7 galaxies that were “misclassified” as starbursts. NGC 253, a typical starburst galaxy, and IC 342, a galaxy similar to our Milky Way galaxy, are part of Fig. 1 to ensure that the classification method is correct. Both are located in the expected zone. The starburst sub-sample, selected as such, includes 24 classical starbursts, 16 Seyfert composites, 13 starburst supported LINERs, 3 dwarf starburst galaxies ( –18; e.g., NGC 1569 ), and all 28 (U)LIRGs, or in total 77 galaxies (some of these galaxies have more than two assignments).
Characterized by FIR luminosity and nuclear activity, the entire sample consists of 4 ULIRGs, 24 LIRGs, 45 Seyferts, 45 LINERs, 49 starbursts neither being ULIRGs nor LIRGs, and 11 “normal” galaxies. Note that one object may be part of more than one sub-sample. The sample classification is presented in more detail in Table 2.
The sub-sample of Seyferts is severely biased to Seyfert 2 galaxies, with only 7 galaxies classified as Seyfert 1. Although individually not satisfying the LIRG criterion 1011 L⊙ 1012 L⊙, Arp 303 S and N are both classified as LIRGs since the system as a whole meets the LIRG criterion. There are 16 Seyferts that are also classified as LINERs. Hence there is a total of 74 AGN in our sample. Excluding those overlapping with the starburst and (U)LIRG sub-samples, there remain 35 galaxies which show “pure” AGN activity.
The sample can also be broken down by Hubble types. We observed 42 early-type (including 19 lenticulars, 2 ellipticals, 1 cD, and 20 early-type spirals) and 54 late-type galaxies (5 irregulars and 49 late type spirals), with a Hubble type index of = 3 (or Sb in the RC3, de Vaucouleurs et al., 1991; Paturel et al., 2003) being used as the dividing line ( 3: early type, 3: late type). Because of their peculiar morphology, the 28 (U)LIRGs of our sample have not been included. Concerning the presence and the strength of a bar, the sample covers 42 SA (unbarred), 31 SAB (weakly barred) and 25 SB (barred) galaxies. It also comprises 11 Virgo cluster galaxies and 8 dwarf galaxies ( –18).
2.2.3 The sample distribution
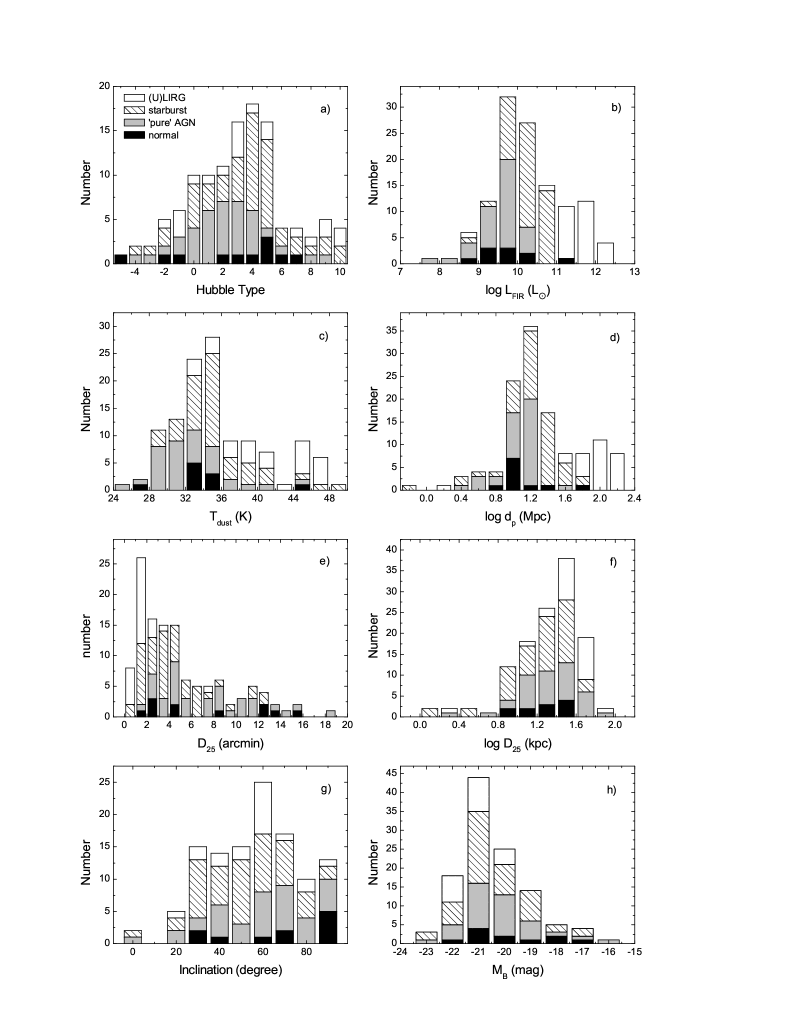
In Fig. 2 we present some basic properties of the entire sample of 125 observed galaxies, i.e. the distribution of Hubble type, FIR luminosity (), 60m/100m dust color temperature (), distance (), optical angular size ( in arcmin), optical linear size ( in kpc), inclination angle (), and absolute B-band magnitude (). Our sub-samples cover almost all types of galaxies, with most of them belonging to Hubble types 3 – 5 (see de Vaucouleurs et al., 1991), corresponding to the revised (de Vaucouleurs) morphological types Sb–Sbc–Sc. The far-infrared luminosity of our sample spans almost 5 orders of magnitude, log(/L⊙) 7.5–12.4, with a median value of log(/L⊙) 10.2, which is very close to the total far-infrared luminosity of the Galaxy (e.g., Beichman, 1987). The dust color temperature , obtained by assuming an emissivity propertional to (see footnote to Table 1), varies between 24 K and 50 K, with a peak at about 35 K. The distance distribution shows a strong peak at 10–20 Mpc, where our beam size of 22′′ (see § 3) corresponds to a linear scale of about 1–2 kpc. These are typical sizes for circumnuclear starbursts. The optical diameter is in a range between 0.4 to 18.6 arcmin on an angular and 1.3 to 78 kpc on a linear scale, with values of 25–40 kpc being most typical. About 70% of our sample galaxies have an optical diameter () smaller than 5 arcmin, and the strong peak at 1–2 arcmin is due to the merging sequence sub-sample (see §2.1). The inclination angle is broadly distributed between 30∘ and 90∘. There are only few galaxies with inclinations below 30∘. Our sample spans a B-band absolute magnitude range from –16.4 to –22.6, the majority having with –20 a high luminosity.
3. Observations
All the CO(3–2) observations were conducted with the 10-m Heinrich-Hertz Telescope (HHT) on Mt. Graham/Arizona with a beamwidth of 22′′ 333The HHT was operated by the Submillimeter Telescope Observatory on behalf of Steward Observatory and the Max-Planck-Institut für Radioastronomie.. Most of our galaxies were observed during Feb., Apr. and Nov. 1999, Jan. and Mar. 2000. The majority of the merging/interacting galaxies was observed in Mar. 2003, Mar. 2004 and Mar. 2005. In all cases, the same dual channel 345 GHz SIS (Superconductor-Insulator-Superconductor) receiver was employed. Spectral profiles were obtained with two acousto-optical spectrometers (AOSs), each with 2048 channels (channel spacing 480 kHz, frequency resolution 930 kHz, corresponding to a velocity resolution of 0.8 km s-1) and a total bandwidth of 1 GHz.
Spectra were taken using a wobbling (2 Hz) secondary mirror with beam throws of 120′′ to 240′′ in azimuth. Scans obtained with reference positions on either side of the source were coadded to ensure flat baselines. Receiver temperatures were of order of 170 K and system temperatures were 900 K on a scale, respectively.
Calibration at submillimeter wavelengths is often difficult, especially for extragalactic observations, and needs to be carefully checked. The receivers were sensitive to both sidebands. Any imbalance in the gains of the lower and upper sideband would thus lead to calibration errors. To account for this, galactic calibration sources (e.g. Orion-KL, IRC+10216, Sgr B2, G34.3, and W51, depending on availability at the time of observation) were observed prior to the target source with the same receiver tuning setup. Published spectral line survey data in the 345 GHz band were used for intensity calibrations, e.g. Schilke et al. (1997) for Orion-KL, Groesbeck et al. (1994) for IRC+10216, Sutton et al. (1991) for Sgr B2, Hatchell et al. (1998) for G34.3, and Wang et al. (1994) for W51. Pointing and focus were carefully checked before the calibration spectra were taken. Nevertheless, the absolute calibration error could be as large as 30% (see § 4.3).
After a first order (or second order in very few cases) baseline subtraction, the antenna temperature was converted to main beam brightness temperature via = (/) (see, Downes, 1989). The main beam efficiency, , was 0.5 at 345 GHz, as obtained from measurements of Saturn, and the forward hemisphere efficiencies, , was 0.9 (see also Mao et al., 2002).
To reduce as much as possible the number of receiver tunings, we used the same tuning setup to observe as many galaxies as possible with similar velocities. Therefore, in some cases the line is detected well outside the center of the spectrum and sometimes even reaches the band edge of the backend, in which case only a zero order baseline subtraction was performed. Additionally, in a few galaxies like Mrk 273, NGC 6240, IRAS 17208-0014, Arp 220, and Arp 302N, the full width to zero power of the line is as wide as 1000 km s-1 (as shown in wide band interferometer data; e.g., Scoville et al., 1997), which exceeds the bandwidth of the backend used for our observations. The intensities in such cases can only be considered as lower limits, unless some concatenated spectra were obtained, as in the case of Arp 220 and Arp 302N.
4. Results
4.1. Spectra and line parameters
Figure 3 shows the CO(3–2) spectra (on a scale) towards all detected galaxies. The line parameters or the upper limits in case of non-detections are given in Table LABEL:tbl:para. The spectra have been smoothed to a velocity resolution of 3–20 in order to show the emission features more prominently. Spectra with the velocity integrated intensity = = larger than three times the r.m.s noise are considered to be detected. We have determined the integrated line intensity, the radial velocity and the line width using either Gaussian fits to the lines, or the moments of the spectra in the case of non-Gaussian line profiles. Spectra of Arp 220 and Arp 302N were concatenated from two different velocity setups to cover the full velocity ranges that exceed the bandwidth of the backend. Of the observed 125 galaxies, 114 were detected, among which CO(3–2) data of 65 galaxies are reported here for the first time. For spectra with a signal to noise ratio of less than 3, an upper limit is derived using ()1/2, where is the r.m.s noise in for a single channel, and 10 represents the full linewidth taken from the FCRAO CO(1–0) survey results (Young et al., 1995; Kenney et al., 1988) or arbitrarily set to 400 if there was no CO(1–0) data available. denotes the channel spacing.
The CO(3–2) luminosity, in units of K pc2, is calculated within our 22′′ beam by
| (1) |
where = 22′′ = 1.06710-4 rad is the full width to half maximum (FWHM) main beam size of the HHT at 345 GHz, = (1+) is the luminosity distance in pc (: proper distance in pc, see footnote to Table), and = /c denotes the redshift. The CO(1–0) luminosity is derived similarly (see footnotes in Table LABEL:tbl:para). Because of identical beam sizes (22′′), the averaged intensity ratio between the =3–2 and 1–0 CO lines, = /, is calculated for galaxies with available IRAM-30m CO(1–0). For galaxies with CO(1–0) data from other telescopes, upper or lower limits are given for , depending on the CO(1–0) beam size.
4.2. Detection rates and non-detections
Our CO(3–2) detection rates are 91% (10/11), 86% (64/74), 100% (49/49), and 100% (28/28) in normal, Seyfert/LINER, starburst galaxies, and (U)LIRGs, respectively, or about 90% in total. Fortuitously, both the total number and the detection rate, 89% (39/45), are the same for the Seyferts and LINERs. Those sample galaxies that are known to host 22 GHz H2O and/or 18 cm OH masers are all detected in CO(3–2). For the Virgo Cluster galaxies, dwarf galaxies, early type and late-type galaxies (see § 2.2.2) the detection rates are 82% (9/11), 75% (6/8), 78% (18/23) and 94% (46/49), respectively. Note again that we adopted the NED based classification, which may suffer in some cases from ambiguities.
Eleven of our sample galaxies were not detected in CO(3–2) according to our detection criteria mentioned above. Their CO(1–0) intensity is weak on average ( 20), with the only exception of NGC 4438 where a relatively strong (70 ) CO(1–0) intensity was reported. NGC 4438, together with NGC 2841 and NGC 5866 were, however, observed at poor weather conditions. NGC 7077 is considered to be a tentative detection, since the central velocity differs by about 140 from that of the CO(1–0) line, while its integrated intensity marginally satisfies the detection criteria with an S/N ratio of 4. One of our non-detections, NGC 855, a dwarf elliptical, was detected by Nakanishi et al. (2007) after a deep integration. The reported intensity is below our 2 level and therefore well below our detection limit.
It is interesting to note that, except for one dwarf elliptical (NGC 855), all the rest of the non-detections are AGN hosts (either Seyferts or LINERs), and are mostly early type galaxies (7 lenticulars and 3 spirals). This is suggestive of a possible destruction of molecular gas reservoirs by AGN feedback, and consequently a suppression of star formation in early type galaxies (see, e.g., Schawinski et al., 2007). Except for 3 SAB galaxies, the non-detections were all obtained from unbarred galaxies.
4.3. Consistency of the observed CO intensities
As already mentioned in §3, calibration uncertainties may rise up to 30%. Furthermore, with a 22′′ beam, any shift 5′′ could yield significant discrepancies in both line shape and intensity. This could further increase the uncertainties of measured absolute intensities and requires a detailed comparison with data from previous surveys with respect to both intensity and line shape. The large sample analyzed here brings us into the unique position to test not only the quality of our own data but also that of previously studied samples. The comparison of spectroscopic results is given in the Appendix and starts with previous measurements also obtained with a 10-m sized telescope (§A.1) and continues with the inclusion of data from the James Clerk Maxwell 15-m telescope (JCMT, §A.2).
In general, our results are consistent with published data. The inconsistencies found for a few individual sources can be attributed to errors of pointing, calibration and baseline subtraction (especially for broad spectra) which are difficult to quantify. A typical error of 30% is not unusual even for millimeter observations. Therefore, the inconsistencies shown in the Appendix are within expected ranges, still leaving space for significant improvements, possibly obtained by mapping the galaxy cores. Among the sources with large discrepancies in intensities ( 50%), four (NGC 891, NGC 3079, M 83, and Arp 220) have been reported with both weaker and stronger intensities in the literature, leaving our intensities close to the medium values. Among galaxies with published CO(3–2) maps available, large discrepancies are found for four out of a total of twelve sources (NGC 891, NGC 2146, NGC 3593, and NGC 4631). Skewed profiles appear in a few spectra of Fig. 3 and are most likely caused by pointing errors. Some galaxies show, however, off-centered CO emission, and the profiles from the nuclear regions are thus not necessarily symmetric. Considering all these uncertainties and also to keep the uniformity of the data set, we will exclusively use our data for the following discussion. Given the large sample, a few galaxies with relatively large calibration errors should not affect the overall correlations (see also § 5.2.2).
5. Discussion
5.1. The CO(3–2)/(1–0) Line Intensity Ratio
The beam averaged integrated intensity ratio, = /, can serve as an indicator of the molecular gas excitation since the ratio is sensitive to the temperature and density of the molecular gas (e.g., Mauersberger et al., 1999). Although the excitation status of the molecular gas cannot be accurately determined with only two optically thick transitions, i.e. CO(3–2) and (1–0), we can use to constrain the molecular gas temperature and density with either Large Velocity Gradient (LVG) or Photon-Dominated Region (PDR) models. While it is likely that is varying within the region observed (see, e.g., Dumke et al. 2001, who find that CO(3–2) is more centrally concentrated), our values provide a representative average over the size of the beam.
5.1.1 Molecular Gas Excitation Traced by
Considering = [(CO)/(H2)]/(d/d) = 10-4 and 10-5 (km s-1/pc)-1, consistent with Mauersberger et al. (1999), one-component LVG calculations (c.f. Scoville & Solomon, 1974; Henkel et al., 1980; Mao et al., 2000) with the recent collision rates of Flower (2001) show that 1 corresponds to 60 K and an H2 density of (H2) 103.5 . Both of these values are larger than those given in Mauersberger et al. (1999), where old collision rates were used. For the extreme case of = 1.9, a gas temperature of at least 200 K is required. A ratio of = 0.2 would instead indicate (H2) 300 for = 10-4 (km s-1/pc)-1, or (H2) 2500 for = 10-5 (km s-1/pc)-1 if = 20 – 60 K.
The thermal budget of the interstellar molecular gas in starburst regions can be described predominantly in terms of a PDR scenario (see, e.g., Hollenbach & Tielens, 1997; Mao et al., 2000; Schulz et al., 2007). If we take a typical strength of the incident far-ultraviolet (FUV) radiation field, 102.8-3.9 (in units of the local galactic flux, 1.610-3 erg s-1 cm-2, c.f. Mao et al., 2000, and references therein), as for the starburst in M82, the standard PDR model (Kaufman et al., 1999) results in (H2) = 103.9-4.9 and cloud surface temperatures of 300 – 600 K for = 1.0 – 1.6.
Among our 114 galaxies with detected CO(3–2) emission, 68 have published IRAM-30m CO(1–0) data. These are the best candidates for a comparison (c.f. § 4.1) because of matching beam sizes (22′′). Seven of these galaxies (marked with a superscript in Col.(10) of Table LABEL:tbl:para) have been excluded because of a positional discrepancy by 5′′ (for the coordinates used by us, see Table LABEL:tbl:basic). Therefore, there remain 61 sources for our analysis. For those galaxies with no available IRAM-30m CO(1–0) data but with measurements from other telescopes (i.e. NRAO-12m, FCRAO-14m, SEST-15m, Onsala-20m and NRO-45m), upper or lower limits were estimated. The results are listed in Table LABEL:tbl:para.
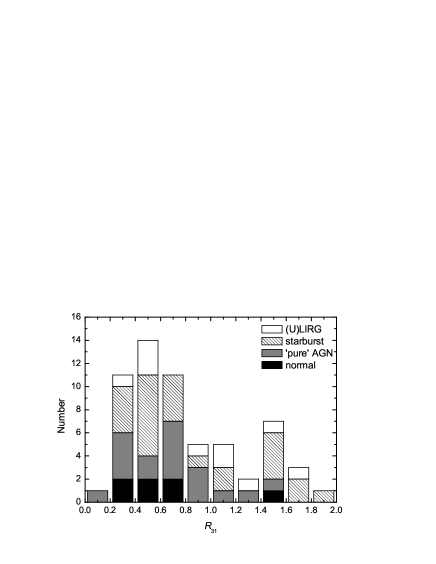
Figure 4 shows the distribution of the ratio of the 61 sources. The distribution has a prominent peak around 0.5, which is the typical value in the spiral arms of the Galactic disk (e.g., Oka et al., 2007), and an additional minor excess at about 1.5, which is a sign of highly excited gas as found in the Central Molecular Zone (CMZ) of the Galaxy (for the Sgr A region see, e.g., Oka et al., 2007). The values of range widely from 0.2 to 1.9 with a mean of 0.81 0.06 (cf. Mauersberger et al. 1999; Yao et al. 2003), the error being the standard error of the mean. The distribution is deviating from a normal one, so that (following Chebyshev’s inequality) probabilities within a given range of standard deviations are expected to be moderately lower than those in the case of a normal distribution.
There are 18 sources with 1, indicative of very high excitation combined with low optical depth. As expected, these are mostly starbursts or (U)LIRGs, since such high ratio gas may arise predominantly from UV-irradiated surfaces of molecular clouds or shocked regions, possibly generated by the interaction with supernova expansion waves (Oka et al., 2007, and references therein), which are fairly common in starburst regions.
NGC 3310, a starburst galaxy with an exceptionally high CO(2–1)/(1–0) intensity ratio (2.60.6) as found by Braine & Combes (1992), shows also the highest ratio (1.90.52), confirming the peculiar physical conditions of the molecular gas in its central region. Enhanced massive star formation triggered by a recent merging event with a gas-rich galaxy (e.g Balick & Heckman, 1981; Kregel & Sancisi, 2001) is most likely responsible for this peculiar value.
Molecular gas with a high ratio does not always need high excitation and has also been found in the Galactic interarm regions where low density gas dominates (Oka et al., 2007). However, such interarm regions should not dominate the overall CO emission of a spiral galaxy. Alternatively, a warm opaque cloud veiled by a cool foreground layer of low density, which absorbs the CO(1–0) but not the CO(3–2) emission, could also raise the ratio to an exceptional level without participation of highly excited gas of low opacity (see below).
Table 4 summarizes the results related to for the different galaxy types outlined in § 2.1. In the following, we will discuss which properties of the galaxies observed may most efficiently affect the determined ratios.
5.1.2 Correlations between and galaxy properties
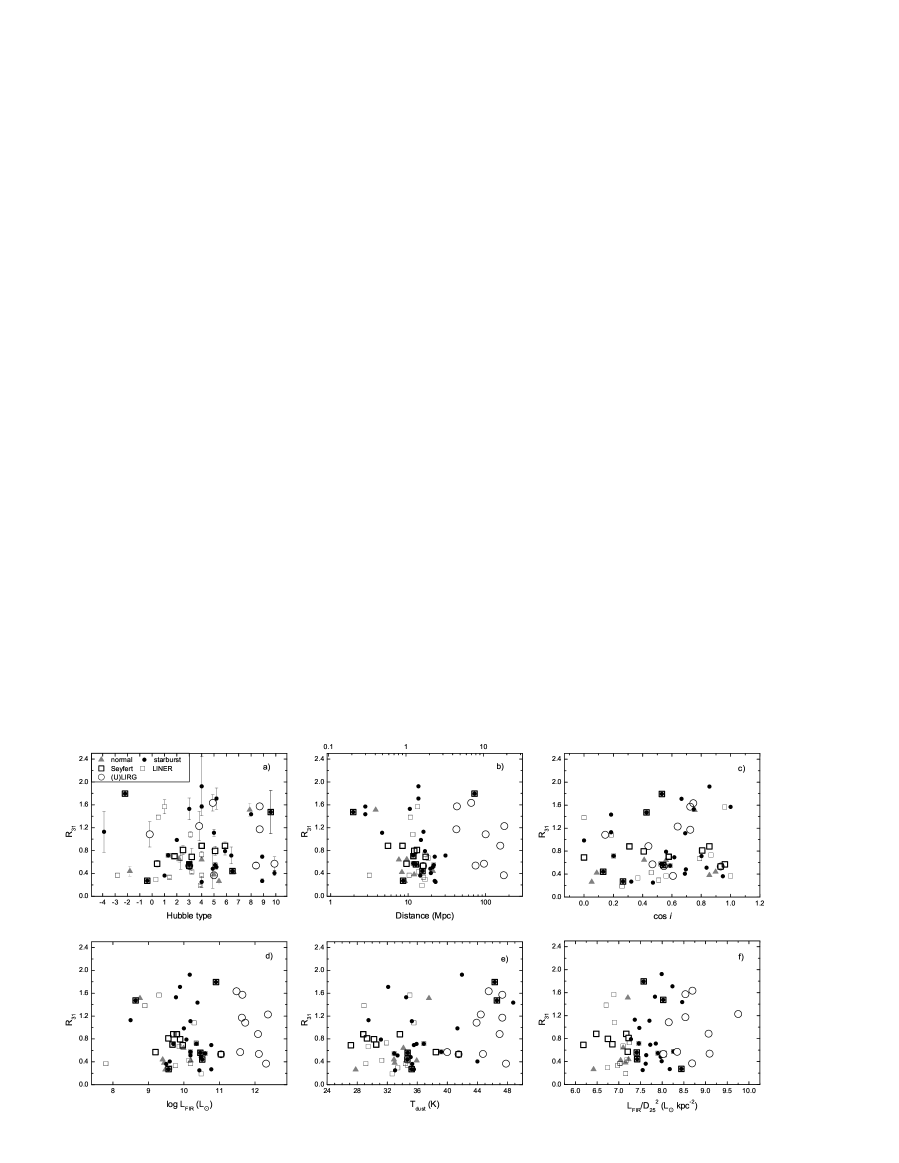
In Fig. 5, is shown as a function of Hubble type, distance (or linear beam size), inclination, FIR luminosity, 60m/100m dust color temperature, and optical size ().
1) Hubble type – There is no correlation between and Hubble type (Fig. 5a, but see Nakanishi et al. 2007 for elliptical galaxies). The bulk of the CO emission in the majority of galaxies arises from the central region, which is largely decoupled from the Hubble type and the shape of the large scale disks (Kennicutt, 1998).
2) Projected beam size – Fig. 5b shows no correlation, agreeing with Yao et al. (2003) on a similar analysis for their sample. Such a lack of correlation also holds within a given Hubble type of galaxies. It may imply that toward the nearby galaxies we see exclusively the nuclear region, while in the more distant more luminous galaxies the central regions become so dominant that the larger projected beam size is not important any more.
3) Inclination – Inclination may affect the observed , since we tend to include more low excitation gas from the outer disk into the observing beam for galaxies seen more edge-on, thus lowering . Nevertheless, Fig. 5c shows no strong trend between and the cosine of the inclination. However, the upper envelope of the distribution as well as the number of sources with high increase with decreasing inclination. While this agrees with the expected trend, the correlation is not significant.
4) FIR luminosity and color temperature of the dust – The FIR luminosity and the temperature of the dust are expected to be correlated with the molecular gas excitation, if dust and gas are coupled. In Figs. 5d and e we therefore correlate with and the 60m/100m dust color temperature (). Although there may be a weak trend with , similar to that mentioned above for the inclination, no significant correlation is evident. This could be partially attributed to the fact that we plot the global dust properties against the rather localized line ratio emphasizing the nuclear regions. In Fig. 5f we also plot as a function of /, a measure of the SFR per unit area, but again there is no convincing correlation (see also Yao et al. 2003). This can be interpreted in the sense that star formation is a locally confined activity.
5) Nuclear activity – In addition to star formation, AGN may also provide a source of heating for the surrounding molecular gas (see, e.g., Matsushita et al., 2004). As summarized in Table 4, the average ratios are 0.650.08 and 0.820.12 for LINERs and Seyferts, respectively, or 0.780.09 for “pure” AGN. Although being larger than in normal galaxies (0.610.16), these values are similar to or lower than the mean value of the entire sample (0.810.06). This may be caused by the fact that AGN activity is spatially too much confined for the currently achieved angular resolution.
On the other hand, starbursts and (U)LIRGs do show higher average ratios (0.890.11 and 0.960.14, respectively). Among the 18 galaxies with in excess of unity, 14 belong to starbursts. This indicates that the presence of a nuclear starburst is a major reason for a high, beam averaged value.
6) Bars – Bars are expected to enhance the gas flow toward the center of galaxies, building up the nuclear gas reservoir to maintain nuclear activity and affecting the molecular gas excitation. We find that R31 is higher in barred SB and SAB galaxies (0.88 0.15 and 0.80 0.11, respectively) than in non-barred SA galaxies (0.62 0.10). This and the fact that there are no SB galaxies and only three SAB galaxies among our 11 CO(3–2) non-detections, indicates that the presence of bars can not only enhance the CO gas excitation, but is also increasing the central molecular gas reservoir.
7) The merging sequence – Most of the galaxies in the merging sequence sub-sample have no corresponding IRAM CO(1–0) data. However, in one of the intermediate mergers, the Antennae, we do not see a significant enhancement of CO(3–2), with being 0.7, 0.3 and 0.8 for NGC 4038, NGC 4039 and the overlap region, while the mean ratio of the “late” mergers NGC 1614, Mrk 231, Arp 220, and IRAS 17208–0014 is 1.00.2. This is consistent with the result of Leech et al. (2010) who find a weak correlation based on CO(3–2) data from the JCMT.
In summary, while there is significant dispersion between individual objects of a given type, targets hosting an AGN may show higher values than “normal” galaxies, while ratios are highest in starburst and barred galaxies. Surprisingly, significant correlations of with other galaxy properties are not found.
5.2. FIR-to-CO luminosity correlations and star formation laws
The FIR luminosity (as a measure of the SFR in galaxies) is correlated with the CO luminosity (a measure of the total molecular content). Based on the scaling relation SFR , this can be expressed in terms of the so-called Kennicutt-Schmidt law (hereafter KS law; Schmidt, 1959; Kennicutt, 1998), which connects the SFR per area with the total gas surface density, i.e. , with = 1.40.15. The empirical evaluation of the molecular KS law is, however, tracer-dependent, and molecular line tracers with different critical densities may give different correlations with sub-linear (1), linear (=1), or super-linear (1) correlation indices, which differ from (e.g, Kennicutt, 1998; Gao & Solomon, 2004a, b; Baan et al., 2008; Bussmann et al., 2008).
Recent models to interpret the various observed correlation indices in a uniform way (Krumholz & Thompson, 2007; Narayanan et al., 2008) assume that depends on the cloud’s gas mass above the critical density of the observed molecular transition. The super-linear SFR– correlation is caused by the fact that the gas density is on average higher than the CO(1–0) line’s critical density, thermalizing most of the CO(1–0) emission. The sub-linear SFR– correlation (Bussmann et al., 2008) is a result of a small fraction of thermal emission as the critical density of the HCN =3–2 transition is high ((H2) 107 cm-3). Observational support for such models is, however, still fragile given the large uncertainties in (sub)millimeter molecular line calibration (§A.1 and A.2) and additional problems mentioned below. In the following, we will first address some of these problems and will then derive the corresponding correlations from our data.
5.2.1 Possible problems in the correlation analysis
For pointed CO observations, as in our case, a direct power law correlation of the nuclear CO luminosity with the global FIR luminosity could be misleading because these two quantities refer to different spatial scales. To evade such a situation, one should ideally obtain extended CO maps to measure the entire molecular gas content for a large sample of galaxies with various Hubble types and FIR luminosity ranges. Full maps of such a large sample of galaxies in CO(3–2) are, however, not yet available.
Yao et al. (2003) employed an alternative way in scaling down the total FIR luminosity as obtained by the IRAS data to the volume marked by the angular size of the CO observations. The scaling factor is determined by the peak-to-total flux density ratio derived from the corresponding 850 m submillimeter continuum images. The basic assumption for such a technique to be applicable is that the FIR brightness distribution is similar to that of the 850 m submillimeter continuum. This is, however, most likely not the case since the FIR emission measured by the IRAS satellite is only sensitive to warm dust ( 30 K), while the submillimeter continuum also traces dust at cooler color temperatures. In most galaxies, this cooler component dominates. Therefore, the FIR emission is expected to be much more centrally concentrated than the submillimeter emission, especially in the case of nuclear starbursts. Indeed, even the 200 m continuum emission has already shown significant cold dust at large galactocentric radii (e.g., Alton et al., 1998; Kramer et al., 2010).
Another important aspect is the linear regression fit itself. Published correlation studies sometimes use - and sometimes -. Caution has to be exercised, however, in comparing these two approaches. Simply taking an inverse slope (i.e., 1/ instead of ) is not appropriate because the standard linear regression fit assumes that values are exactly correct, and that errors or variability only affect the values. Hence the regression of on is different from the regression of on . To determine the line dependent parameter in analogy to (§5.2), line luminosities and FIR luminosities must be plotted along the x- and y-axes, respectively. Standard regression fits from figures with inverted axes (as, e.g., displayed by Yao et al. 2003; Baan et al. 2008) cannot be used. There is, however, a way to account for errors along both axes. For this, the publicly available Monte Carlo Markov Chain fitting packages of Kelly (2007) have been developed.
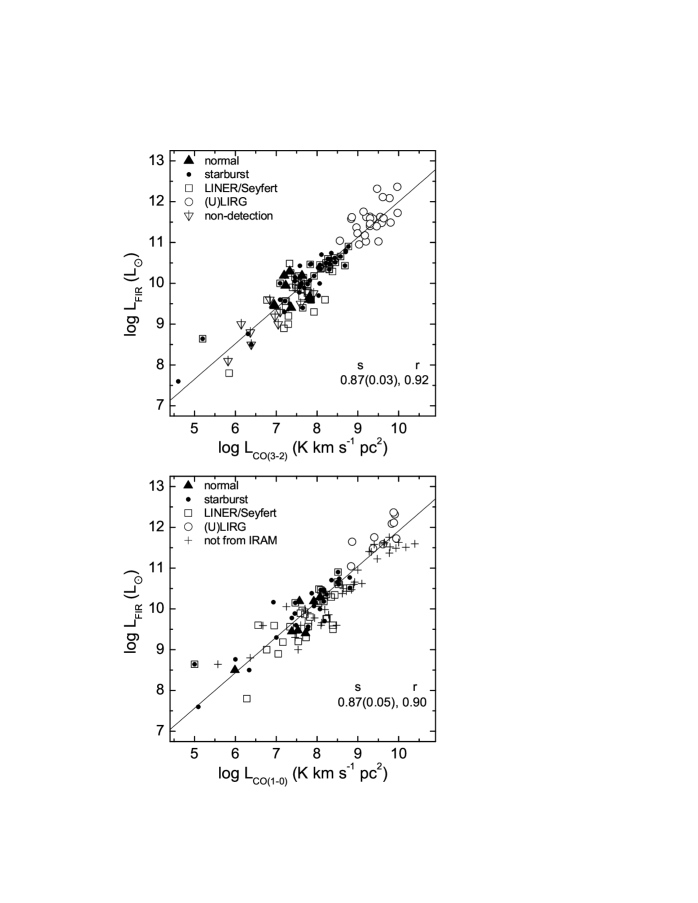
5.2.2 The FIR-to-CO correlation
In Fig. 6, we present the correlation between the nuclear CO line luminosity and the global FIR luminosity . We performed the fit in both ways, with and without the method introduced by Kelly (2007), considering uncertainties along both axes in the latter case. However, slopes derived with the Kelly packages are (within a percent) the same as those obtained with the unweighted linear regression fits. This is perhaps due to the large number and small intrinsic scatter of our data along both axes in the log-log plots. In the following we will therefore use the unweighted linear regression fits.
Intriguingly, both nuclear CO(3–2) and CO(1–0) line luminosities are tightly correlated to the global FIR luminosity, and our unweighted linear regression fits result in almost identical slopes slightly below unity, = 0.87 0.03 and 0.87 0.05 for CO(3–2) and CO(1–0), respectively. To account for the fitting problems when exchanging CO and FIR luminosities (§ 5.2.1), we note that the unweighted linear regression fit for - results in slopes of 0.96 0.04 and 0.94 0.06 for the CO(3–2) and CO(1–0) luminosities. Both slopes related to CO(3–2) are smaller than unity, and are not simply reciprocal values.
To avoid a bias by a single discrete data point, IC 10, with its by far lowest and values, is not included in the fits of Fig. 6. Fits including IC 10 give, however, similar slopes of 0.880.03 and 0.860.04 for CO(3–2) and (1–0), respectively. A fit is also performed replacing four questionable CO(3–2) intensities by the corresponding peak intensities obtained from maps (see the discussion of the mapped sources in §A.1). The new fit gives the same slope, = 0.87 0.04. This is not unexpected because the number of these galaxies is small with respect to that of the entire sample.
Our slopes are consistent with that derived from 14 local (U)LIRGs (Iono et al., 2009) but differ from those of Yao et al. (2003), who obtained (y-axis)-(x-axis) slopes with scaled FIR luminosities (§5.2.1) well below unity (0.70 and 0.58 for CO(3–2) and (1–0), respectively; see also their Fig. 2). However, using instead the uncorrected FIR luminosities, the slopes become 1.00 and 0.94, respectively, very close to our results.
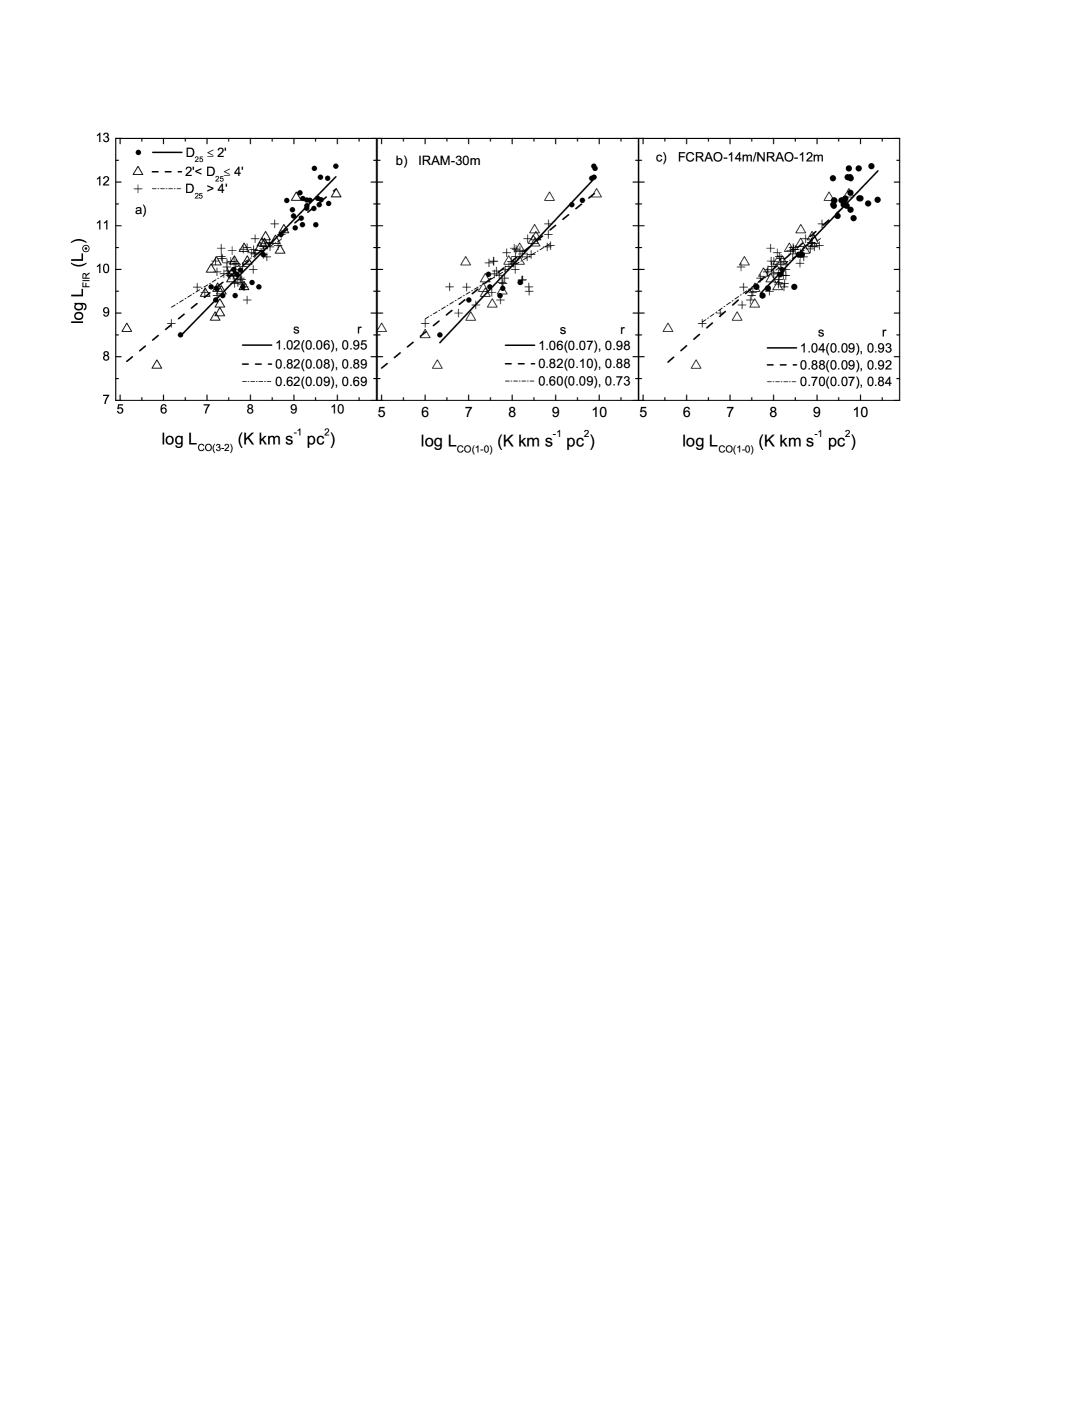
5.2.3 On the angular size dependence of the correlation
Instead of following Yao et al. (2003) and scaling down the FIR fluxes to the area of the CO observations, we can also test our results by defining different ranges, assuming that galaxies with similar optical angular sizes have similar central (22′′) to total integrated CO intensity ratios. This assumption is based on the fact that the diameter of the CO(1–0)-emitting region is found to be correlated with the optical diameter as (Young et al., 1995). The CO(3–2) emission may be more centrally concentrated than the CO(1–0) emission (Dumke et al., 2001) but may follow a similar relation. In Fig. 7 we compare correlations of CO-to-FIR luminosities with our CO(3–2) data (panel a)) as well as the CO(1–0) data from the IRAM-30m telescope (panel b)) and from the FCRAO-14m/NRAO-12m antennas (panel c)) dividing our sample galaxies into three groups: 1) 2′ (filled circles), 2) 2′ 4′ (empty triangles) and 3) 4′ 18′ (crosses). Corresponding slopes () and correlation coefficients () of linear regression fits are also given. For a constant ratio the resulting slopes should be close to the case of FIR and CO emission arising from the same region.
The three groups of galaxies show different correlations, irrespective of the CO transition studied. The compact galaxies show slopes of order 1.0–1.1, the intermediate sample is characterized by 0.8–0.9, and the extended sources have slopes of 0.6–0.7, all with uncertainties in the range 0.05–0.10. For galaxies in the first group, which includes most of the (U)LIRGs and some other galaxies at large distance, most of the CO emission is expected to be covered by the observing beam. For galaxies in the second and third group, the CO(3–2) emission should be somewhat or much more extended but within a given group the scaling factor of the total-to-central (22′′) integrated intensities is expected to be similar.
In summary, and without having to assume equal spatial distributions of the CO(3–2) and (1–0) emission, we obtain rising slopes with increasing compactness of the observed targets. This can be interpreted in terms of the relationship between molecular line emission and gas density, anchored by the underlying KS law (Gao & Solomon, 2004b; Krumholz & Thompson, 2007; Narayanan et al., 2008; Bussmann et al., 2008) as outlined in §5.2. The distant more compact galaxies, many of them (U)LIRGs, possess in the average denser gas than the more nearby targets, so that their emission is more thermalized, yielding a higher slope. Nevertheless, the roughly linear or sublinear correlations are indicative of a significant fraction of molecular gas with densities lower than the critical density of the tracer used. This is comprehensible in the case of CO(3–2) with its high critical density of 105 cm-3, as the bulk of the nuclear CO emission should arise from a more diffuse medium ((H2) 103-4 cm-3; e.g., Mauersberger et al. 1999; Mao et al. 2000). It is, however, difficult to interpret the correlation in the same way with CO(1–0) because the density of the bulk of the nuclear molecular gas may not be lower than 103.5 cm-3. Clearly, this deserves further study. More beam matching CO(1–0) data, more maps providing a measure of the entire CO(3–2) emission of a galaxy, data from more than two CO transitions, and infrared data of high angular resolution would thus be helpful.
6. Conclusions
1. CO(3–2) spectra from the central region of a sample of 125 galaxies are presented. With an angular resolution of 22′′, CO(3–2) emission is detected in 114 targets. Our survey significantly increases the number of available CO(3–2) data from galaxies and provides a reliable data base for future surveys with higher angular resolution, establishing a bridge to the high lines observed toward redshifted targets.
2. The CO(3–2)/(1–0) integrated line intensity ratio varies widely from 0.2 to 1.9. The line ratio appears to be independent of galaxy properties such as Hubble type and FIR luminosity and only shows tentative, not significant correlations with 60m/100m dust color temperature and inclination angle.
3. To be consistent with common designations but to use at the same time a clear definition, we have specified the term “starburst galaxy” by the condition log [(/L⊙)/(/kpc2)] 7.25. 77 of our sample galaxies show this property, which is a measure of star formation activity per surface area.
4. The average ratios are found to be larger in galaxies with nuclear activity (AGN and starbursts) or with bars than in those without. Apparently, these are the galaxies showing enhanced molecular excitation. Most galaxies with a line ratio of 1 are starbursts. (U)LIRGs have the highest average value, which may be caused by particularly vigorous activity triggered by galaxy interaction and merging.
5. The nuclear CO luminosities show a slightly sublinear correlation with the global FIR luminosity in both the CO(3–2) and the (1–0) lines. Subdividing our sample into several bins with different angular sizes to compensate for the different size of the regions from where CO and FIR emission have been measured reveals significant differences. Compact and thus mostly distant luminous galaxies show the largest slopes, possibly a consequence of relatively high overall molecular densities, yielding larger fractions of thermalized gas. A similar trend for CO(1–0) is more difficult to explain, because this would require densities below 103.5 cm-3.
acknowledgement
We wish to thank an anonymous referee for critically reading the manuscript. We also wish to thank the HHT staff for their enthusiastic support of the project and for their flexibility in changing schedules according to variable weather conditions. We also thank Dr. Jiangshui Zhang for his help in preparing some of the tables and Dr. B. Kelly for a latest version of his software package. We acknowledge useful discussions with Drs. M. Dumke and A. Weiß. RQM is partly supported by NSFC under grants 10373025 and 10733030.
Appendix
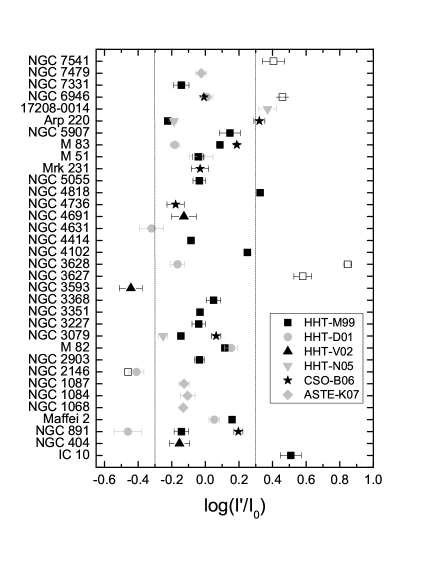
A.1. Comparison of CO(3–2) spectra taken with the same angular resolution
-
1)
A comparison of 22 galaxies with the data by Mauersberger et al. (1999, HHT-M99) shows good agreement within the errors. Eight sources were re-observed at different positions, four of them at positions displaced by more than 10′′ (NGC 3627, NGC 3628, NGC 6946, and NGC 7541), with the new data showing more symmetric profiles and stronger intensities. The significant difference in observed line shapes toward NGC 2146 is likely due to a position offset of 6′′, and the flat-topped profile of Mauersberger et al. (1999) looks more like a line from the center of the galaxy than our sharply peaked profile. For most of the other galaxies (NGC 3227, NGC 3351, NGC 3368, NGC 4414, NGC 4818), our new data show higher quality profiles although the integrated intensities are quite consistent.
-
2)
Dumke et al. (2001, HHT-D01) presented extended CO(3–2) maps toward nine of our sample galaxies where we can check the pointing by comparing our line profile with their individual spectra. For Maffei 2, M 82, M 51, and NGC 6946, Dumke et al. (2001) present spectra, which are consistent with ours with respect to both lineshape and intensity. For NGC 3628 and M 83, our profiles and intensities resemble theirs at the (10′′,0′′) and (–10′′,0′′) offsets, respectively, where the line intensities are about 30% weaker than the peak intensities at their (0′′,0′′) positions. Relatively large discrepancies exist for three sources. The line shape of NGC 4631 resembles that given by Dumke et al. (2001) but their intensity is about twice as high. The other two are observed at positions slightly different from the nominal position used by Dumke et al. (2001). Our position of NGC 891 corresponds to their (–6′′,–7′′) offset position, where their integrated intensity of about 50 is tripling our value (17.3 ). The position we observed for NGC 2146 is 5′′ east of their reference position, but our spectrum looks more like theirs at the (10′′,–10′′) offset position. At this position, their intensity is about twice as strong as ours. The spectrum by Mauersberger et al. (1999) is consistent with Dumke et al. (2001) with respect to both line shape and intensity, although the nominal positions differ by about 10′′. Our observations of all these three source seem to suffer from large calibration errors, and NGC 2146 may suffer from an additional pointing error.
-
3)
Vila-Vilaró et al. (2003, HHT-V02) covered five early type galaxies of our sample, with NGC 404 and NGC 4691 being slightly stronger (by 25% and 5%, respectively than our spectra. NGC 855 and NGC 5666 are non-detections in both data sets (NGC 5666 was a tentative detection in their paper). Our spectrum of NGC 3593 looks more like that of their (10′′,0′′) position which gives an intensity twice as strong as ours.
-
4)
Narayanan et al. (2005, HHT-N05) observed three of our sample galaxies. While their integrated intensities for NGC 3079 and Arp 220 are about twice as large as our values, IRAS 17208-0014 shows less than half of the strength we got. A detailed check is not possible, however, since their given positions (their Table 1) are erroneous.
-
5)
For the six common sources also observed by Bayet et al. (2006, CSO-B06) with the CSO-10m telescope, we find consistent results for NGC 3079, NGC 6946 and the Antennae system. Our intensities of Mrk 231, M83, and Arp 220 are, however, all about twice as large as theirs. Their CO(3–2) spectrum of NGC 4736 looks more symmetric than ours and has an intensity, which is 40% higher.
-
6)
Among the five common sources also observed by Komugi et al. (2007, ASTE-K07) with the ASTE-10m telescope, four galaxies (NGC 1068, NGC 1084, NGC 1087 and NGC 7479) were observed at similar (offsets 6′′) positions and show quite consistent results. The large discrepancy in the case of NGC 157 is due to a position offset of about one telescope beam (22′′). Our spectra show generally better baselines thanks to the backend, which is twice as wide as theirs.
To evaluate consistencies on a quantitative basis, we define a relative intensity deviation as log(), where is the integrated CO(3–2) intensity obtained from the literature and is from this work. Figure 8 shows the relative intensity deviations for galaxies with CO(3–2) data available in the articles mentioned above. About 80% of the data points, excluding those observed at nominal position offsets 5′′ (open squares in Fig. 8), are falling into the 0.3 dex deviation limits.
A.2. Comparison of CO(3–2) spectra taken with different angular resolution
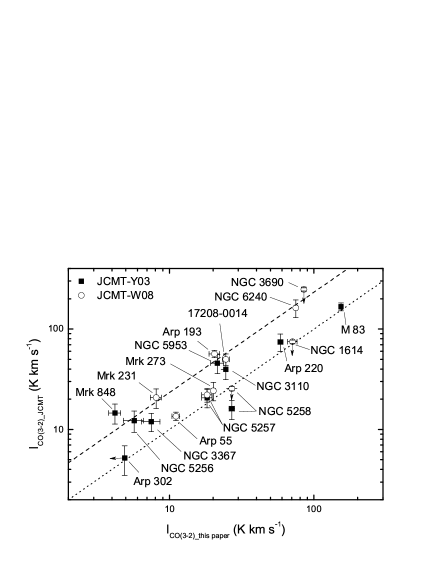
Comparisons with observations at different angular resolution are not straightforward and need to be treated with utmost caution, since the molecular gas is rarely smoothly distributed in galaxies, and any simple scaling could easily become artificial. For the galaxies with more or less known structure, comparisons of line profiles and intensities can, however, still be helpful to check consistency.
In Fig. 9, we compare our results with published CO(3–2) data taken with the JCMT-15m telescope by Yao et al. (2003, JCMT-Y03) and Wilson et al. (2008, JCMT-W08). Two straight lines denote the theoretical relationship of intensities obtained with the JCMT and HHT assuming point-like (dashed) and uniformly-extended (dotted) structures with respect to the observing beams. Most of the sources are located between these two lines, as expected in case of well calibrated intensities. In general, the JCMT-15m CO(3–2) data tend to yield higher intensities, as expected, given their higher angular resolution. This also holds for M 83 (Muraoka et al., 2009) and NGC 3521 and NGC 3627 (Warren et al., 2010), with the former two galaxies revealing integrated CO(3–2) intensity compatible with our values, while their CO(3–2) emission peak toward the latter is stronger by a factor of 2.5.
Toward the interacting Arp 302 N/S system, Yao et al. (2003) observed a position in between the pair of nuclei, where the CO emission is weak and where we only obtained an upper limit (indicated by the arrow pointing towards the left). This refers to “Arp 302 center” in Tables LABEL:tbl:basic and LABEL:tbl:para. We also observed this system at the positions of its two nuclei (i.e., Arp 302 N/S), where emission is stronger. Sources, where JCMT CO(3–2) intensities were derived from maps, are labeled by arrows pointing downwards. Our CO(3–2) intensity of NGC 3690 (or Arp 299 in Wilson et al. 2008) is a sum of NGC 3690 A and B. Differences between the JCMT and our HHT integrated intensities are most pronounced toward Mrk 848 and NGC 5258. While in the case of Mrk 848 this may be due to differences in calibration, the results from NGC 5258 may be caused by an unusual gas morphology (see also Wilson et al., 2008).
References
- Albrecht et al. (2004) Albrecht, M., Chini, R., Krügel, E., Müller, S. A. H., & Lemke, R. 2004, A&A, 414, 141
- Albrecht et al. (2007) Albrecht, M., Krügel, E., & Chini, R. 2007, A&A, 462, 575
- Alton et al. (1998) Alton, P. B., et al. 1998, A&A, 335, 807
- Baan et al. (2008) Baan, W. A., Henkel, C., Loenen, A. F., Baudry, A., & Wiklind, T. 2008, A&A, 477, 747
- Baars & Martin (1996) Baars, J. W. M., & Martin, R. N. 1996, Rev. Mod. Astro., 9, 111
- Balick & Heckman (1981) Balick, B., & Heckman, T. 1981, A&A, 96, 271
- Bayet et al. (2006) Bayet, E., Gerin, M., Phillips, T. G., & Contursi, A. 2006, A&A, 460, 467
- Beichman (1987) Beichman, C. A. 1987, ARA&A, 25, 521
- Beichman et al. (1988) Beichman, C. A., Neugebauer, G., Habing, H. J., Clegg, P. E., & Chester, T. J., eds. 1988, IRAS Catalogs and Atlases Explanatory Supplement (NASA RP-1190) (Washington, DC: GPO)
- Benedict et al. (2002) Benedict, G. F., Howell, D. A., Jørgensen, I., Kenney, J. D. P., & Smith, B. J. 2002, AJ, 123, 1411
- Braine & Combes (1992) Braine, J., & Combes, F. 1992, A&A, 264, 433
- Braine et al. (1993) Braine, J., Combes, F., Casoli, F., Dupraz, C., Gerin, M., Klein, U., Wielebinski, R., & Brouillet, N. 1993, A&AS, 97, 887
- Brunthaler et al. (2009) Brunthaler, A., Castangia, P., Tarchi, A., Henkel, C., Reid, M. J., Falcke, H., & Menten, K. M. 2009, A&A, 497, 103
- Bussmann et al. (2008) Bussmann, R. S., et al. 2008, ApJ, 681, L73
- Casoli et al. (1989) Casoli, F., Combes, F., Augarde, R., Figon, P., & Martin, J. M. 1989, A&A, 224, 31
- Chini et al. (1996) Chini, R., Krügel, E., & Lemke, R. 1996, A&AS, 118, 47
- Chini et al. (1992) Chini, R., Krügel, E., & Steppe, H. 1992, A&A, 255, 87
- Combes et al. (1991) Combes, F., Casoli, F., Encrenaz, P., Gerin, M., & Laurent, C. 1991, A&A, 248, 607
- Combes et al. (2007) Combes, F., Young, L. M. & Bureau M. 2007, MNRAS, 377, 1795
- Dahlem et al. (1996) Dahlem, M., Heckman, T. M., Fabbiano, G., Lehnert, M. D., & Gilmore, D. 1996, ApJ, 461, 724
- de Vaucouleurs et al. (1991) de Vaucouleurs, G., de Vaucouleurs, A., Corwin, H. G., Jr., Buta, R. J., Paturel, G., & Fouque, P. 1991, Third Reference Catalogue of Bright Galaxies (New York: Springer)
- Devereux et al. (1994) Devereux, N., Taniguchi, Y., Sanders, D. B., Nakai, N., & Young, J. S. 1994, AJ, 107, 2006
- Downes (1989) Downes D. 1989, Evolution of Galaxies: Astronomical Observations, Lecture Notes in Physics 333, eds. I. Appenzeller, H. Habing, P. Léna, Springer Verlag, Berlin, p353
- Downes et al. (1992) Downes, D., Radford, S. J. E., Guilloteau, S., Guelin, M., Greve, A., & Morris, D. 1992, A&A, 262, 424
- Dumke et al. (2001) Dumke, M., Nieten, C., Thuma, G., Wielebinski, R., & Walsh, W. 2001, A&A, 373, 853
- Elfhag et al. (1996) Elfhag, T., Booth, R. S., Hoeglund, B., Johansson, L. E. B., & Sandqvist, A. 1996, A&AS, 115, 439
- Flower (2001) Flower, D. R. 2001, Journal of Physics B Atomic Molecular Physics, 34, 2731
- Galaz et al. (2008) Galaz, G., Cortés, P., Bronfman, L., & Rubio, M. 2008, ApJ, 677, L13
- Gao et al. (1999) Gao, Y., & Solomon, P. M. 1999, ApJ, 512, L99
- Gao & Solomon (2004a) Gao, Y., & Solomon, P. M., 2004a, ApJ, 606, 271
- Gao & Solomon (2004b) Gao, Y., & Solomon, P. M., 2004b, ApJS, 152, 63.
- Gerin et al. (2000) Gerin, M., & Phillips, T. G. 2000, ApJ, 537, 644
- Golla & Wielebinski (1993) Golla, G., & Wielebinski, R. 1994, A&A, 286, 733
- Graciá-Carpio et al. (2006) Graciá-Carpio, J., García-Burillo, S., Planesas, P., & Colina, L. 2006, ApJ, 640, L135
- Greve et al. (1996) Greve, A., Becker, R., Johansson, L. E. B., & McKeith, C. D. 1996, A&A, 312, 391
- Groesbeck et al. (1994) Groesbeck, T. D., Phillips, T. G., & Blake, G. A. 1994, ApJS, 94, 147
- Güsten et al. (1981) Güsten, R., Walmsley, C. M., & Pauls, T. 1981, A&A, 103, 197
- Hafok & Stutzki (2003) Hafok, H., & Stutzki, J. 2003, A&A, 398, 959
- Handa et al. (1990) Handa, T., Nakai, N., Sofue, Y., Hayashi, M., & Fujimoto, M. 1990, PASJ, 42, 1
- Hatchell et al. (1998) Hatchell, J., Thompson, M. A., Millar, T. J., & MacDonald, G. H. 1998, A&AS, 133, 29
- Heckman et al. (1989) Heckman, T. M., Blitz, L., Wilson, A. S., Armus, L., & Miley, G. K., 1989, ApJ, 342, 735
- Heckman (2005) Heckman, T. M. 2005, in Astrophys. Space Sci. Library 329, Starbursts: From 30 Doradus to Lyman Break Galaxies, eds. R. de Grijs & R. M. González Delgado (Dordrecht: Springer), 3
- Henkel et al. (1980) Henkel, C., Walmsley, C. M., & Wilson, T. L. 1980, A&A, 82, 41
- Henkel & Wiklind (1997) Henkel, C., & Wiklind, T. 1997, Space Science Reviews, 81, 1
- Henkel, Wouterloot & Bally (1986) Henkel, C., Wouterloot, J. G. A., & Bally, J. 1986, A&A, 155, 193
- Hollenbach & Tielens (1997) Hollenbach, D. J., & Tielens, A. G. G. M. 1997, ARA&A, 35, 179
- Huchra (1993) Huchra, J. 1993, electronic version of “Catalogue of Seyfert Galaxies and Other Bright AGN”
- Iono et al. (2009) Iono, D. et al. 2009, ApJ, 695, 1537
- Israel (2005) Israel, F. P. 2005, A&A, 438, 855
- Joint IRAS Science Working Group (1988) Joint IRAS Science Working Group. 1988. IRAS Catalogs and Atlases: The Point Source Catalog, Version 2.0 (NASA RP-1190) (Washington, DC: GPO) (PSC)
- Kaufman et al. (1999) Kaufman, M. J., Wolfire, M. G., Hollenbach, D. J., & Luhman, M. L. 1999, ApJ, 527, 795
- Kelly (2007) Kelly, B. C. 2007, ApJ, 665, 1489
- Kenney et al. (1988) Kenney, J. D. & Young, J. S. 1988, ApJS, 66, 261
- Kennicutt (1998) Kennicutt, R. C., Jr. 1998, ARA&A, 36, 189
- Kennicutt et al. (2005) Kennicutt, R. C., Jr., Lee, J. C., Funes, J. G., Sakai, S., & Akiyama, S. 2005, in Astrophys. Space Sci. Library 329, Starbursts: From 30 Doradus to Lyman Break Galaxies, ed. R. de Grijs & R. M. González Delgado (Dordrecht: Springer), 187
- Komugi et al. (2007) Komugi, S., Kohno, K., Tosaki, T., Nakanishi, H., Onodera, S., Egusa, F., & Sofue, Y. 2007, PASJ, 59, 55
- Komugi et al. (2008) Komugi, S., Sofue Y., Kohno K., Nakanishi H., Onodera S., Egusa F., & Muraoka K. 2008, ApJS, 178, 225
- Kramer et al. (2010) Kramer, C. et al. 2010, A&A, 518, L67
- Kregel & Sancisi (2001) Kregel, M., & Sancisi, R. 2001, A&A, 376, 59
- Krumholz & Thompson (2007) Krumholz, M. R., & Thompson, T. A. 2007, ApJ, 669, 289
- Kuno et al. (2007) Kuno, N., et al. 2007, PASJ, 59, 117
- Leech et al. (2010) Leech, J., Isaak, K. G., Papadopoulos, P. P., Gao, Y., & Davis, G. R. 2010,MNRAS, 406, 1364
- Lo et al. (2000) Lo, K. Y., Hwang, C. Y., Lee, S. W., Kim, D.-C., Wang, W. H., Lee, T. H., Gruendl, R., & Gao, Y. 2000, in ASP Conf. Ser. 197, Dynamics of Galaxies: from the Early Universe to the Present, ed. F. Combes, G. A. Mamon & V. Charmandaris (San Francisco, CA:ASP), 279
- Mao et al. (2000) Mao, R. Q., Henkel, C., Schulz, A., Zielinsky, M., Mauersberger, R., Störzer, H., Wilson, T. L., & Gensheimer, P. 2000, A&A, 358, 433
- Mao et al. (2002) Mao, R. Q., Yang, J., Henkel, C., & Jiang, Z. B. 2002, A&A, 389, 589
- Matsushita et al. (2004) Matsushita, S., et al. 2004, ApJ, 616, L55
- Mauersberger & Henkel (1993) Mauersberger, R., & Henkel, C. 1993, Rev. M.A., 6, 69
- Mauersberger et al. (1999) Mauersberger, R., Henkel, C., Walsh, W., & Schulz, A. 1999, A&A, 341, 256
- Mei et al. (2007) Mei, S., et al. 2007, ApJ, 655, 144
- Meier et al. (2001) Meier, D. S., Turner, J. L., Crosthwaite, L. P., & Beck, S. C. 2001, AJ, 121, 740
- Meier et al. (2001) Meier, D. S., Turner, J. L., & Beck, S. C. 2001, AJ, 122, 1770
- Moshir et al. (1992) Moshir, M., Kopman, G., & Conrow, T. A. O. 1992, IRAS Faint Source Survey, Explanatory Supplement, version 2 (Pasadena, CA: Infrared Processing and Analysis Center, Cal. Tech.)
- Muraoka et al. (2009) Muroaka, K. et al. 2009, ApJ, 706, 1213
- Nakanishi et al. (2007) Nakanishi, H., Tosaki, T., Kohno, K., Sofue, Y., & Kuno, N. 2007, PASJ, 59, 61
- Narayanan et al. (2008) Narayanan, D., Cox, T. J., Shirley, Y., Davé, R., Hernquist, L., & Walker, C. K. 2008, ApJ, 684, 996
- Narayanan et al. (2005) Narayanan, D., Groppi, C. E., Kulesa, C. A., & Walker, C. K. 2005, ApJ, 630, 269
- Nishiyama et al. (2001) Nishiyama, K., & Nakai, N. 2001, PASJ, 53, 713
- Oka et al. (2007) Oka, T., Nagai, M., Kamegai, K., Tanaka, K., & Kuboi, N. 2007, PASJ, 59, 15
- Paturel et al. (2003) Paturel, G., Petit, C., Prugniel, P., Theureau, G., Rousseau, J., Brouty, M., Dubois, P., & Cambrésy, L. 2003, A&A, 412, 45
- Petitpas & Wilson (2003) Petitpas, G. R., & Wilson, C. D. 2003, ApJ, 587, 649
- Petitpas & Wilson (2004) Petitpas, G. R., & Wilson, C. D. 2004, ApJ, 603, 495
- Radford et al. (1991) Radford, S. J. E., Downes, D., & Solomon, P. M. 1991, ApJ, 368, L15
- Reuter et al. (1993) Reuter, H. P., Pohl, M., Lesch, H., & Sievers, A. W. 1993, A&A, 277, 21
- Reuter et al. (1996) Reuter, H.-P., Sievers, A. W., Pohl, M., Lesch, H., & Wielebinski, R. 1996, A&A, 306, 721
- Sage et al. (1992) Sage, L. J., Salzer, J. J., Loose, H.-H., & Henkel, C. 1992, A&A, 265, 19
- Salome et al. (2006) Salomé, P., et al. 2006, A&A, 454, 437
- Sanders et al. (2003) Sanders, D. B., Mazzarella, J. M., Kim, D.-C., Surace, J. A., & Soifer, B. T. 2003, AJ, 126, 1607
- Sanders et al. (1991) Sanders, D. B., Scoville, N. Z., & Soifer, B. T. 1991, ApJ, 370, 158
- Sanders et al. (1986) Sanders, D. B., Scoville, N. Z., Young, J. S., Soifer, B. T., Schloerb, F. P., Rice, W. L., & Danielson, G. E. 1986, ApJ, 305, L45
- Sarzi et al. (2007) Sarzi, M., Allard, E. L., Knapen, J. H., & Mazzuca, L. M. 2007, MNRAS, 380, 949
- Sawada et al. (2001) Sawada, T. et al. 2001, ApJS, 136, 189
- Schawinski et al. (2007) Schawinski, K., Thomas, D., Sarzi, M., Maraston, C., Kaviraj, S., Joo, S.-J., Yi, S. K., & Silk, J. 2007, MNRAS, 382, 1415
- Schilke et al. (1997) Schilke, P., Groesbeck, T. D., Blake, G. A., & Phillips, T. G. 1997, ApJS, 108, 301
- Schmidt (1959) Schmidt, M. 1959, ApJ, 129, 243
- Schulz et al. (2007) Schulz, A., Henkel, C., Muders, D., Mao, R. Q., Röllig, M., & Mauersberger, R. 2007, A&A, 466, 467
- Scoville & Solomon (1974) Scoville, N. Z., & Solomon, P. M. 1974, ApJ, 187, L67
- Scoville et al. (1997) Scoville, N. Z., Yun, M. S., & Bryant, P. M. 1997, ApJ, 484, 702
- Sil’chenko & Afanasiev (2002) Sil’chenko, O. K., & Afanasiev, V. L. 2002, A&A, 385, 1
- Solomon et al. (1992) Solomon, P. M., Downes, D., & Radford, S. J. E. 1992, ApJ, 387, L55
- Solomon et al. (1997) Solomon, P. M., Downes, D., Radford, S. J. E., & Barrett, J. W. 1997, ApJ, 478, 144
- Solomon & Vanden Bout (2005) Solomon, P. M., & Vanden Bout, P. A. 2005, ARA&A, 43, 677
- Surace et al. (2004) Surace, J. A., Sanders, D. B., & Mazzarella, J. M. 2004, AJ, 127, 3235
- Sutton et al. (1991) Sutton, E. C., Jaminet, P. A., Danchi, W. C., & Blake, G. A. 1991, ApJS, 77, 255
- Van der Werf et al. (2010) Van der Werf, P. et al. 2010, A&A, 518, L42
- Véron-Cetty & Véron (1991) Véron-Cetty, M. P., & Véron, P. 1991, electronic version of “A Catalog of Quasars and Active Nuclei” (5th ed.; Garching: ESO Sci. Rep. No. 10)
- Vila-Vilaró et al. (2003) Vila-Vilaró, B., Cepa, J., & Butner, H. M. 2003, ApJ, 594, 232
- Vila-Vilaró et al. (1998) Vila-Vilaró, B., Taniguchi, Y., & Nakai, N. 1998, AJ, 116, 1553
- Wang et al. (1994) Wang, Y., Jaffe, D. T., Graf, U. U., & Evans, N. J., II 1994, ApJS, 95, 503
- Warren et al. (2010) Warren, B. E. et al. 2010, ApJ, 714, 571
- Wiklind et al. (1995) Wiklind, T., Combes, F., & Henkel, C. 1995, A&A, 297, 643
- Wiklind & Henkel (1989) Wiklind, T., & Henkel, C. 1989, A&A, 225, 1
- Wilson et al. (2008) Wilson, C. D., et al. 2008, ApJS, 178, 189
- Wilson et al. (2009) Wilson, C. D., et al. 2009, ApJ, 693, 1736
- Yao et al. (2003) Yao, L., Seaquist, E. R., Kuno, N., & Dunne, L. 2003, ApJ, 588, 771
- Young et al. (1995) Young, J. S., et al. 1995, ApJS, 98, 219
| No. | SOURCE | R.A.2000 | DEC2000 | MB | log | Classification | |||||||
|---|---|---|---|---|---|---|---|---|---|---|---|---|---|
| ( h m s) | ( ∘ ′ ′′) | () | (Mpc) | (′) | (deg) | (mag) | (L⊙) | (K) | |||||
| (1) | (2) | (3) | (4) | (5) | (6) | (7) | (8) | (9) | (10) | (11) | (12) | (13) | (14) |
| 1 | IC 10 | 00 20 27.4 | +59 17 15 | –348 | 0.7a | 6.8 | 31 | 7.6 | 32.9c | S | 9.9 | dIrr IV/BCD | |
| 2 | NGC 157 | 00 34 45.3 | –08 23 51 | 1652 | 22.6 | 4.2 | 62 | –21.3 | 10.4 | 33.1 | S | 4.0 | SAB(rs)bc HII |
| 3 | NGC 404 | 01 09 27.7 | +35 43 08 | –48 | 3.1a | 2.67 | 0 | –16.3 | 7.8 | 34.4c | –2.8 | SA(s)0-: LINER | |
| 4 | NGC 660 | 01 43 02.4 | +13 38 45 | 850 | 11.6 | 8.3 | 78 | –19.1 | 10.4 | 36.9 | S | 1.3 | SB(s)a pec;HII LINER |
| 5 | III ZW 35 | 01 44 30.7 | +17 06 09 | 8225 | 112.0 | 0.4 | 11.6 | 45.3 | L | LIRG Sy2 | |||
| 6 | NGC 855 | 02 14 03.8 | +27 52 38 | 595 | 9.7a | 2.6 | 90 | –16.9 | 8.5 | 35.6c | N | –4.6 | E |
| 7 | NGC 891 | 02 22 32.5 | +42 20 48 | 528 | 9.8a | 13.5 | 88 | –20.1 | 10.3 | 32.0 | N | 3.0 | SA(s)b? sp HII |
| 8 | NGC 972 | 02 34 13.1 | +29 18 43 | 1543 | 21.1 | 3.3 | 66 | –20.4 | 10.6 | 36.7 | S | 2.0 | Sab HII |
| 9 | MAFFEI 2 | 02 41 55.2 | +59 36 11 | –17 | 2.8a | 1.57 | 0 | 9.3 | 32.8c | S | 4.0 | SAB(rs)bc | |
| 10 | NGC 1055 | 02 41 45.2 | +00 26 39 | 994 | 13.6 | 7.6 | 63 | –19.6 | 10.1 | 31.3 | 3.2 | SBb: sp LINER2 | |
| 11 | NGC 1068 | 02 42 40.8 | –00 00 47 | 1137 | 15.6 | 7.1 | 21 | –21.3 | 11.0 | 41.5 | L | 3.0 | (R)SA(rs)b;Sy1 Sy2 |
| 12 | NGC 1084 | 02 46 00.1 | –07 34 38 | 1407 | 19.3 | 3.2 | 46 | –20.5 | 10.5 | 35.1 | S | 4.9 | SA(s)c HII |
| 13 | NGC 1087 | 02 46 25.1 | –00 29 53 | 1517 | 20.8 | 3.12 | 33 | –20.5 | 10.2 | 33.4 | S | 5.2 | SAB(rs)c |
| 14 | NGC 1275 | 03 19 48.2 | +41 30 42 | 5264 | 71.9 | 2.2 | 58 | –22.5 | 10.9 | 46.3 | S | –2.2 | cD;pec;NLRG Sy2 |
| 15 | NGC 1530 | 04 23 26.6 | +75 17 43 | 2461 | 33.7 | 4.6 | 58 | –21.4 | 10.5 | 32.0 | N | 3.1 | SB(rs)b |
| 16 | NGC 1569 | 04 30 46.5 | +64 51 01 | –104 | 2.0a | 3.6 | 65 | –16.6 | 8.6 | 46.6 | S | 9.6 | IBm;Sbrst Sy1 |
| 17 | NGC 1614p | 04 34 00.0 | –08 34 44 | 4778 | 65.2 | 1.3 | 42 | –21.3 | 11.5 | 45.5 | L | 4.9 | SB(s)c pec;HII:Sy2 |
| 18 | NGC 1637 | 04 41 28.3 | –02 51 28 | 717 | 12.0a | 4 | 31 | –18.4 | 9.4 | 33.0 | N | 5.0 | SAB(rs)c |
| 19 | NGC 2146 | 06 18 39.6 | +78 21 19 | 893 | 12.2 | 6 | 54 | –21.0 | 10.7 | 41.3 | S | 2.3 | SB(s)ab pec HII |
| 20 | NGC 2559 | 08 17 06.1 | –27 27 27 | 1559 | 21.3 | 4.13 | 64 | –21.0 | 10.6 | 32.3c | S | 4.5 | SB(s)bc pec: |
| 21 | NGC 2655 | 08 55 38.8 | +78 13 28 | 1400 | 19.2 | 4.9 | 66 | –21.1 | 9.3 | 29.6c | 0.1 | SAB(s)0/a Sy2 | |
| 22 | NGC 2681 | 08 53 33.0 | +51 18 53 | 692 | 9.5 | 3.6 | 16 | –19.3 | 9.2 | 38.5 | 0.4 | (R’)SAB(rs)0/a Sy3 | |
| 23 | NGC 2768 | 09 11 37.7 | +60 02 22 | 1373 | 18.8 | 8.1 | 90 | –21.1 | 9.6 | 44.0c | –4.3 | S0_1/2_ LINER | |
| 24 | Arp 55p | 09 15 54.7 | +44 19 49 | 11782 | 160.1 | 1 | 59 | –21.6 | 11.6 | 37.3 | L | 5.2 | LINER;LIRG HII |
| 25 | NGC 2782 | 09 17 15.7 | +39 54 14 | 2543 | 34.8 | 3.5 | 45 | –20.8 | 10.4 | 39.2 | S | 1.1 | SAB(rs)a;Sy1 Sbrst |
| 26 | NGC 2841 | 09 22 02.7 | +50 58 36 | 638 | 8.7 | 8.1 | 68 | –20.7 | 9.0 | 25.3c | 3.0 | SA(r)b:;LINER Sy1 | |
| 27 | NGC 2903 | 09 32 09.7 | +21 30 07 | 556 | 7.6 | 12.6 | 56 | –20.8 | 10.0 | 34.2 | N | 4.0 | SB(s)d HII |
| 28 | Arp 303Sp | 09 46 20.3 | +03 02 44 | 6002 | 81.9 | 1.06 | 73 | –20.5 | 10.7b | 32.7b | L | 2.0 | SB(r)ab:pec |
| 29 | Arp 303Np | 09 46 21.1 | +03 04 17 | 5990 | 81.7 | 1.92 | 77 | –21.6 | 10.8b | 34.3b | L | 6.8 | SA(s)cd? pec VLIRG |
| 30 | NGC 2985 | 09 50 20.9 | +72 16 44 | 1322 | 18.1 | 4.6 | 38 | –20.7 | 9.9 | 29.5 | 2.3 | (R’)SA(rs)ab LINER | |
| 31 | NGC 3032 | 09 52 08.2 | +29 14 29 | 1533 | 21.0 | 2 | 26 | –18.8 | 9.4 | 32.9c | N | –1.8 | SAB(r)0∧0∧ HII |
| 32 | NGC 3034 | 09 55 52.6 | +69 40 47 | 203 | 2.8 | 11.2 | 79 | –18.0 | 10.4 | 48.8 | S | 8.0 | I0;Sbrst HII |
| 33 | NGC 3079 | 10 01 58.2 | +55 40 43 | 1116 | 15.3 | 7.9 | 83 | –21.4 | 10.5 | 34.7 | S | 6.5 | SB(s)c;LINER Sy2 |
| 34 | NGC 3077 | 10 03 21.1 | +68 44 02 | 14 | 3.8a | 5.4 | 41 | –17.8 | 8.8 | 37.6 | 7.9 | I0 pec HII | |
| 35 | NGC 3110 | 10 04 01.9 | –06 28 29 | 5054 | 69.0 | 1.5 | 65 | –21.8 | 11.2 | 35.2 | L | 3.3 | SB(rs)b pec; HII LIRG |
| 36 | NGC 3166 | 10 13 44.9 | +03 25 31 | 1345 | 18.4 | 4.8 | 56 | –20.1 | 9.8 | 33.4 | 0.2 | SAB(rs)0/a LINER | |
| 37 | NGC 3169 | 10 14 15.0 | +03 27 57 | 1238 | 16.9 | 4.4 | 57 | –20.2 | 9.9 | 31.2 | 1.2 | SA(s)a pec LINER | |
| 38 | NGC 3147 | 10 16 53.6 | +73 24 03 | 2820 | 38.6 | 3.9 | 30 | –22.1 | 10.7 | 28.8 | S | 3.9 | SA(rs)bc Sy2 |
| 39 | NGC 3227 | 10 23 30.6 | +19 51 54 | 1157 | 15.8 | 5.4 | 68 | –20.0 | 9.8 | 34.7 | 1.4 | E2: pec LINER | |
| 40 | HARO 2 | 10 32 32.0 | +54 24 03 | 1430 | 19.6 | 1.12 | 46 | –18.8 | 9.6 | 44.0c | S | 9.9 | Im pec HII |
| 41 | NGC 3310 | 10 38 46.1 | +53 30 08 | 993 | 13.6 | 3.1 | 31 | –20.0 | 10.2 | 41.9 | S | 4.0 | SAB(r)bc pec HII |
| 42 | NGC 3351 | 10 43 57.3 | +11 42 16 | 778 | 10.5a | 3.07 | 42 | –20.1 | 9.8 | 34.5 | S | 3.0 | SB(r)b;HII Sbrst |
| 43 | NGC 3367 | 10 46 34.4 | +13 45 09 | 3040 | 41.6 | 2.02 | 37 | –21.3 | 10.5 | 34.5 | S | 5.2 | SB(rs)c;LINER Sy |
| 44 | NGC 3368 | 10 46 45.7 | +11 49 11 | 897 | 11.7a | 7.6 | 55 | –20.8 | 9.7 | 30.5 | 1.8 | SAB(rs)ab;Sy LINER | |
| 45 | NGC 3521 | 11 05 48.9 | –00 02 15 | 801 | 11.0 | 11 | 66 | –21.0 | 10.3 | 32.5 | 4.0 | SAB(rs)bc;HII LINER | |
| 46 | NGC 3556 | 11 11 31.8 | +55 40 15 | 699 | 9.6 | 8.7 | 68 | –20.6 | 9.9 | 33.1 | N | 6.0 | SB(s)cd HII |
| 47 | NGC 3593 | 11 14 37.1 | +12 49 03 | 628 | 8.6 | 1.46 | 75 | –18.2 | 9.6 | 35.3 | S | –0.4 | SA(s)0/a;HII Sy2 |
| 48 | NGC 3627 | 11 20 15.4 | +12 59 42 | 727 | 12.6a | 9.1 | 57 | –21.1 | 10.5 | 34.7 | S | 3.0 | SAB(s)b;LINER Sy2 |
| NGC 3627A | 11 20 15.0 | +12 59 30 | –21.1 | ||||||||||
| 49 | NGC 3628 | 11 20 17.0 | +13 35 20 | 843 | 11.5 | 14.8 | 79 | –21.3 | 10.3 | 35.5 | 3.1 | SAb pec sp;HII LINER | |
| 50 | NGC 3642 | 11 22 18.4 | +59 04 34 | 1588 | 21.7 | 1.76 | 32 | –20.5 | 9.4 | 30.6c | S | 4.0 | SA(r)bc: LINER Sy3 |
| 51 | NGC 3682 | 11 27 42.7 | +66 35 25 | 1515 | 20.7 | 1.7 | 52 | –18.8 | 9.6 | 33.6c | S | 0 | SA(s)0/a:? |
| 52 | NGC 3690Ap | 11 28 30.9 | +58 33 44 | 3064 | 41.9 | 2.9 | 44 | –20.1 | 11.6 | 47.3 | L | 8.7 | IBm pec HII |
| 53 | NGC 3690Bp | 11 28 33.6 | +58 33 46 | 3121 | 42.7 | 2.9 | 44 | –20.1 | 11.6 | 47.3 | L | 8.7 | SBm? pec HII |
| 54 | NGC 3810 | 11 40 58.9 | +11 28 20 | 993 | 13.6 | 1.69 | 48 | –20.0 | 9.9 | 32.1 | S | 5.2 | SA(rs)c HII |
| 55 | NGC 3982 | 11 56 28.1 | +55 07 30 | 1109 | 22.0a | 1.69 | 30 | –19.8 | 10.0 | 33.6 | S | 3.2 | SAB(r)b: Sy2 |
| 56 | IC 750 | 11 58 51.4 | +42 43 24 | 701 | 9.6 | 2.48 | 66 | –18.1 | c | N | 2.2 | Sab: sp | |
| 57 | NGC 4038p | 12 01 53.0 | –18 52 03 | 1642 | 22.0a | 5.2 | 52 | –21.3 | S | 8.9 | SB(s)m pec | ||
| NGC 4038/9 | 12 01 55.1 | –18 53 00 | 22.0a | 10.8b | 36.3b | (the overlap region) | |||||||
| 58 | NGC 4039p | 12 01 53.6 | –18 53 11 | 1641 | 22.0a | 3.1 | 71 | –21.3 | S | 8.9 | SA(s)m pecLINERSbrst | ||
| 59 | NGC 4102 | 12 06 22.6 | +52 42 39 | 846 | 11.6 | 2.7 | 58 | –19.2 | 10.2 | 39.2 | S | 3.0 | SAB(s)b?;HII LINER |
| 60 | NGC 4138 | 12 09 30.7 | +43 41 16 | 888 | 12.2 | 2.6 | 64 | –18.7 | –0.8 | SA(r)0+ Sy1.9 | |||
| 61 | NGC 4192v | 12 13 48.3 | +14 54 01 | –142 | 16.5a | 9.8 | 78 | –21.5 | 9.9 | 30.6 | 2.5 | SAB(s)ab;HII Sy | |
| 62 | NGC 4254v | 12 18 49.5 | +14 25 03 | 2407 | 32.9 | 5.4 | 32 | –22.5 | 10.5 | 32.6 | S | 5.2 | SA(s)c |
| 63 | NGC 4258 | 12 18 57.5 | +47 18 14 | 448 | 8.4a | 18.6 | 72 | –20.7 | 9.8 | 28.8c | 4.0 | SAB(s)bc;LINER Sy1.9 | |
| 64 | NGC 4293v | 12 21 12.9 | +18 22 58 | 893 | 12.2 | 5.6 | 59 | –20.0 | 9.6 | 33.4c | 0.3 | (R)SB(s)0/a LINER | |
| 65 | NGC 4303v | 12 21 54.7 | +04 28 20 | 1566 | 16.5a | 6.5 | 18 | –21.7 | 10.5 | 34.4 | S | 4.0 | SAB(rs)bc;HII Sy2 |
| 66 | NGC 4314 | 12 22 32.0 | +29 53 43 | 963 | 13.2 | 4.2 | 16 | –19.7 | 9.3 | 35.0c | 1.0 | SB(rs)a LINER | |
| 67 | NGC 4321v | 12 22 55.2 | +15 49 22 | 1571 | 16.5a | 7.4 | 30 | –22.0 | 10.3 | 31.9 | 4.0 | SAB(s)bc;LINER HII | |
| 68 | NGC 4369 | 12 24 35.9 | +39 22 56 | 1045 | 14.3 | 2.1 | 19 | –18.9 | 9.5 | 35.3 | S | 1.0 | (R)SA(rs)a HII |
| 69 | NGC 4395 | 12 25 50.1 | +33 32 45 | 319 | 4.3a | 13.2 | 90 | –17.2 | 8.1 | 31.1c | 8.8 | SA(s)m:;LINER Sy1.8 | |
| 70 | NGC 4414 | 12 26 27.1 | +31 13 22 | 716 | 21.4a | 3.6 | 54 | –19.9 | 10.6 | 32.9 | S | 5.1 | SA(rs)c?;HII LINER |
| 71 | NGC 4438v | 12 27 45.8 | +13 00 30 | 71 | 16.5a | 8.5 | 73 | –20.7 | 9.5 | 31.9 | 0.7 | SA(s)0/a pec: LINER | |
| 72 | NGC 4457v | 12 28 59.3 | +03 34 16 | 882 | 16.5a | 2.7 | 35 | –19.0 | 9.6 | 34.8 | S | 0.4 | (R)SAB(s)0/a LINER |
| 73 | NGC 4490 | 12 30 36.6 | +41 38 12 | 565 | 9.6a | 6.3 | 47 | –21.6 | 10.1 | 35.8 | S | 7.0 | SB(s)d pec |
| 74 | NGC 4527v | 12 34 08.7 | +02 39 11 | 1736 | 16.5a | 6.2 | 70 | –21.4 | 10.4 | 34.5 | S | 4.0 | SAB(s)bc;HII LINER |
| 75 | NGC 4565 | 12 36 20.8 | +25 59 16 | 1230 | 16.8 | 15.9 | 90 | –22.4 | 10.0 | 27.2 | 3.2 | SA(s)b? sp Sy3 Sy1.9 | |
| 76 | NGC 4594 | 12 39 58.8 | –11 37 28 | 1024 | 14.0 | 8.7 | 79 | –22.1 | 9.4 | 28.4c | 1.1 | SA(s)a;LINER Sy1.9 | |
| 77 | NGC 4631 | 12 42 07.6 | +32 32 28 | 606 | 8.3 | 15.5 | 85 | –22.1 | 10.2 | 35.9 | N | 6.6 | SB(s)d |
| 78 | NGC 4639v | 12 42 52.4 | +13 15 26 | 1018 | 13.9 | 2.8 | 52 | –19.1 | 9.0 | 29.9c | 3.5 | SAB(rs)bc Sy1.8 | |
| 79 | NGC 4654v | 12 43 56.1 | +13 07 43 | 1046 | 16.5a | 5.17 | 56 | –20.5 | 10.1 | 31.2 | S | 5.9 | SAB(rs)cd |
| 80 | NGC 4666 | 12 45 08.9 | –00 27 38 | 1520 | 20.8 | 4.6 | 70 | –21.0 | 10.5 | 33.3 | S | 4.9 | SABc: LINER |
| 81 | NGC 4691 | 12 48 13.4 | –03 19 58 | 1100 | 15.1 | 2.52 | 39 | –19.5 | 9.9 | 38.4 | S | 0.4 | (R)SB(s)0/a pecHII |
| 82 | NGC 4710v | 12 49 39.0 | +15 09 55 | 1125 | 16.5a | 4.9 | 90 | –19.7 | 9.7 | 33.7 | N | –0.8 | SA(r)0+? sp HII |
| 83 | NGC 4736 | 12 50 53.5 | +41 07 10 | 308 | 4.7a | 11.2 | 35 | –19.9 | 9.6 | 37.4 | 2.4 | (R)SA(r)ab;Sy2 LINER | |
| 84 | MRK 231 | 12 54 04.8 | +57 08 38 | 12642 | 171.7 | 1.3 | 53 | –22.3 | 12.3 | 47.8 | U | 5.0 | SA(rs)c? pec Sy1 |
| 85 | NGC 4818 | 12 56 48.8 | –08 31 26 | 1065 | 14.6 | 4.3 | 90 | –19.6 | 10.0 | 41.3 | S | 2.0 | SAB(rs)ab pec: Sbrst |
| 86 | NGC 4826 | 12 56 44.2 | +21 41 05 | 408 | 7.5a | 10 | 60 | –20.5 | 9.8 | 33.8 | 2.4 | (R)SA(rs)ab;HII Sy2 | |
| 87 | NGC 4941 | 13 04 12.9 | –05 33 07 | 1108 | 15.1 | 3.6 | 36 | –19.3 | 9.0 | 30.4c | 2.4 | (R)SAB(r)ab: Sy2 | |
| 88 | NGC 5033 | 13 13 27.4 | +36 35 39 | 875 | 12.0 | 10.7 | 66 | –20.8 | 9.9 | 30.2 | 5.1 | SA(s)c Sy1.9 | |
| 89 | NGC 5055 | 13 15 49.1 | +42 02 06 | 504 | 10.3a | 12.6 | 56 | –21.1 | 10.2 | 29.1 | S | 4.0 | SA(rs)bc HII/LINER |
| 90 | UGC 8335Ap | 13 15 30.8 | +62 07 45 | 9230 | 125.6 | 0.85 | L | SC; LINER HII | |||||
| 91 | UGC 8335Bp | 13 15 35.0 | +62 07 29 | 9313 | 126.8 | 1.47 | 11.6b | 44.4b | L | SC HII | |||
| 92 | Arp 193p | 13 20 35.3 | +34 08 25 | 6985 | 95.2 | 1.5 | 62 | –20.5 | 11.6 | 40.0 | L | 9.9 | Im: pec;HII LINER |
| 93 | NGC 5194 | 13 29 52.5 | +47 11 53 | 463 | 7.1a | 11.2 | 30 | –20.4 | 10.1 | 33.5 | S | 4.0 | SA(s)bc pec;HIISy2.5 |
| 94 | M 83 | 13 37 00.7 | –29 51 59 | 513 | 4.6a | 12.9 | 46 | 10.2 | 35.3 | S | 5.0 | SAB(s)c;HII Sbrst | |
| 95 | NGC 5256p | 13 38 17.5 | +48 16 37 | 8353 | 113.8 | 1.22 | 11.4 | 40.4 | L | Pec;Sy2;LIRG Sbrst | |||
| 96 | NGC 5257p | 13 39 52.9 | +00 50 24 | 6798 | 92.7 | 1.8 | 62 | –21.8 | 11.3b | 37.4b | L | 3.1 | SAB(s)b pec;HII LIRG |
| 97 | NGC 5258p | 13 39 57.7 | +00 49 51 | 6757 | 92.1 | 1.7 | 34 | –21.3 | 11.0b | 36.1b | L | 3.1 | SA(s)b pec;HII LINER |
| 98 | NGC 5273 | 13 42 08.3 | +35 39 15 | 1064 | 14.6 | 2.8 | 57 | –18.8 | 8.8 | 40.4c | –1.9 | SA(s)0∧0∧ Sy1.9 | |
| 99 | MRK 273 | 13 42 51.6 | +56 08 13 | 11326 | 154.6 | 0.72 | 64 | –20.8 | 12.1 | 47.0 | U | Ring galaxy;Sy2 LINER | |
| 100 | NGC 5347 | 13 53 17.8 | +33 29 27 | 2335 | 31.9 | 1.7 | 45 | –19.6 | 9.6 | 35.9c | 2.0 | (R’)SB(rs)ab Sy2 | |
| 101 | NGC 5666 | 14 33 09.5 | +10 30 37 | 2221 | 30.4 | 0.95 | 37 | –19.2 | 9.7 | 35.9c | S | 6.4 | S? |
| 102 | Arp 302Sp | 14 57 00.3 | +24 36 25 | 10029 | 136.4 | 0.6 | 11.0b | L | SC HII | ||||
| Arp 302 center | 14 57 00.5 | +24 36 44 | 10103 | 137.4 | DBL SYS | ||||||||
| 103 | Arp 302Np | 14 57 00.7 | +24 37 03 | 10094 | 137.3 | 0.9 | 11.6b | 34.0b | L | (Sb);HII LINER | |||
| 104 | NGC 5866 | 15 06 30.2 | +55 45 46 | 672 | 9.2 | 4.7 | 86 | –19.9 | 9.2 | 29.9 | –1.2 | S0_3 HII/LINER | |
| 105 | NGC 5907 | 15 15 52.9 | +56 19 33 | 667 | 9.1 | 12.77 | 87 | –20.9 | 9.5 | 27.8 | N | 5.4 | SA(s)c: sp HII: |
| 106 | Mrk 848 | 15 18 05.9 | +42 44 53 | 12049 | 163.7 | 0.9 | 90 | –20.4 | 11.8 | 44.7 | L | –1.7 | S0? pec HII |
| 107 | NGC 5953 | 15 34 32.3 | +15 11 42 | 1965 | 26.9 | 1.6 | 44 | –19.6 | 10.3 | 37.4 | S | 0.2 | SAa: pec;LINER;Sy2 |
| 108 | Arp 220 | 15 34 57.2 | +23 30 12 | 5434 | 74.2 | 1.5 | 57 | –21.0 | 12.1 | 44.7 | U | 8.4 | S?;LINER;HII Sy2 |
| 109 | NGC 6240 | 16 52 58.8 | +02 24 04 | 7339 | 100.0 | 2.1 | 82 | –21.5 | 11.7 | 43.9 | L | –0.2 | I0: pec;LINER Sy2 |
| 110 | 17208-0014 | 17 23 22.3 | –00 17 02 | 12834 | 174.3 | 0.4 | 50 | –20.2 | 12.4 | 44.5 | U | 3.8 | Sbrst HII |
| 111 | Arp 293p | 16 58 30.6 | +58 56 19 | 5600 | 76.4 | 11.2 | 32.4 | L | GPair | ||||
| 112 | NGC 6524 | 17 59 14.9 | +45 53 17 | 5698 | 77.8 | 1.3 | 69 | –20.9 | 10.8 | 34.4c | S | –2.8 | S0: |
| 113 | NGC 6670Bp | 18 33 34.1 | +59 53 21 | 8428 | 114.8 | –20.1 | 11.5 | 38.4 | L | –1.1 | HII | ||
| NGC 6670p | 18 33 35.1 | +59 53 21 | 8650 | 117.8 | 1 | 78 | 11.5 | 38.4 | –1.1 | TRP SYS | |||
| 114 | NGC 6670Ap | 18 33 37.7 | +59 53 22 | 8719 | 118.7 | 11.5 | 38.4 | L | –1.1 | S HII | |||
| 115 | NGC 6814 | 19 42 40.6 | –10 19 24 | 1563 | 21.4 | 3 | 86 | –21.3 | 10.0 | 30.5 | S | 4.0 | SAB(rs)bc Sy1.5 |
| 116 | NGC 6946 | 20 34 51.9 | +60 09 15 | 48 | 5.5a | 11.5 | 31 | –20.8 | 9.7 | 33.7 | 5.9 | SAB(rs)cd;Sy2 HII | |
| 117 | NGC 7013 | 21 03 33.1 | +29 53 47 | 779 | 10.7 | 4 | 90 | –19.5 | 8.9 | 28.9c | 0.5 | SA(r)0/a LINER | |
| 118 | NGC 7077 | 21 29 59.6 | +02 24 51 | 1152 | 15.8 | 0.8 | 79 | –16.8 | 8.5 | 29.5c | S | –3.9 | BCD/E HII |
| 119 | NGC 7217 | 22 07 52.2 | +31 21 35 | 952 | 13.0 | 3.9 | 36 | –20.4 | 9.6 | 29.3 | 2.5 | (R)SA(r)ab;Sy LINER | |
| 120 | NGC 7331 | 22 37 03.5 | +34 24 43 | 816 | 15.1a | 10.5 | 75 | –21.5 | 10.5 | 32.7 | 3.9 | SA(s)b LINER | |
| NGC 7331A | 22 37 05.1 | +34 24 36 | –21.5 | ||||||||||
| 121 | NGC 7465 | 23 02 00.8 | +15 57 56 | 1968 | 26.9 | 1.2 | 64 | –19.2 | 10.0 | 39.3 | S | –1.9 | (R’)SB(s)0∧0∧: Sy2 |
| 122 | NGC 7469 | 23 03 15.6 | +08 52 26 | 4892 | 66.8 | 1.5 | 30 | –21.7 | 11.5 | 41.8 | L | 1.1 | (R’)SAB(rs)a Sy1.2 |
| 123 | NGC 7479 | 23 04 56.7 | +12 19 23 | 2381 | 32.6 | 4.1 | 36 | –21.6 | 10.6 | 36.6 | S | 4.3 | SB(s)c;LINER Sy2 |
| 124 | NGC 7541 | 23 14 43.7 | +04 32 02 | 2689 | 31.3a | 3.5 | 75 | –21.5 | 10.7 | 34.6 | S | 4.7 | SB(rs)bc: pec HII |
| 125 | NGC 7679 | 23 28 46.8 | +03 30 41 | 5138 | 70.1 | 1.3 | 59 | –21.2 | 11.0 | 39.8 | L | –1.3 | SB0 pec:;HII Sy1 LIRG |
The columns contain the following information: Col.(1): The sequence number of the specific source. Col.(2): Galaxy name; p: galaxy pair; v: Virgo cluster galaxy. Cols.(3) and (4): Right ascension (R.A.) and declination (DEC) in J2000.0 coordinates. Col.(5): Heliocentric velocity () from NED. Col.(6): Galaxy proper distance calculated from using = 73 km s-1 Mpc-1 and adopting a flat cosmology with = 0.27 and = 0.73. a: recently measured distances drawn mostly from a crosslink in NED (c.f. NED 1D for references). The distance to Virgo cluster galaxies is set to 16.5 Mpc (Mei et al., 2007). Col.(7): Optical diameter () from NED. Col.(8): Galaxy inclination angle () from HyperLEDA. Col.(9): B-band absolute magnitude (MB) from HyperLEDA. Col.(10): FIR luminosity ( = (40–400 m)) calculated following the prescription of Moshir et al. (1992) (see Sec.2.2.1). b: calculated with infrared fluxes taken from Surace et al. (2004) where the HIRES processing is adopted allowing for a deconvolution of close galaxy pairs. c: sources not included in the RBGS (Sanders et al., 2003); Col.(11): Dust temperature () derived from the IRAS 60 m/100 m color assuming an emissivity that is proportional to the frequency . Col.(12): Galaxy classification from this paper; N: normal; S: starburst; L: LIRG; U: ULIRG. All the rest are “pure” AGN (see Sect. 2.2.2). Col.(13): Galaxy type code from HyperLEDA. Col.(14): Galaxy classification from NED.
| LINER | Seyfert | Starburst | LIRG | ULIRG | |
|---|---|---|---|---|---|
| LINER | 45 | 16 | 20 | 5 | 2 |
| Seyfert | 16 | 45 | 27 | 8 | 3 |
| Starburst | 20 | 27 | 77 | 24 | 4 |
| LIRG | 5 | 8 | 24 | 24 | – |
| ULIRG | 2 | 3 | 4 | – | 4 |
Note. — The diagonal gives the total number of sources of a specific class (e.g., there are 45 LINERs). Nondiagonal coefficients show the number of targets belonging to at least two specific classes (e.g., there are 20 galaxies which have been classified both as LINERS and as starburst galaxies). For details of the classification, see §2.2.2.
| No. | SOURCE | 32 | log | log | Ref. | ||||
|---|---|---|---|---|---|---|---|---|---|
| (K km s-1) | (km s-1) | (km s-1) | (mK) | (K km s-1 pc2) | (K km s-1 pc2) | ||||
| (1) | (2) | (3) | (4) | (5) | (6) | (7) | (8) | (9) | (10) |
| 1 | IC 10 | 7.1 0.3 | –330 0 | 14 1 | 491 30 | 4.6 0.02 | 5.1 0.06 | 0.3 0.05 | 6a,† |
| 2 | NGC 157 | 5.8 0.6∗ | 1733 | 123 | 43 10 | 7.6 0.05 | 8.2 0.17 | 0.3 0.10 | 3 a |
| 3 | NGC 404 | 5.5 0.5 | –57 2 | 37 4 | 140 22 | 5.8 0.04 | 6.3 | 0.4 | 12 a |
| 4 | NGC 660 | 71.1 1.4 | 843 3 | 290 6 | 230 21 | 8.1 0.01 | 8.2 0.01 | 0.7 0.02 | 3 a |
| 5 | III ZW 35 | 4.4 0.6∗ | 8176 | 141 | 22 6 | 8.8 0.07 | 9.4 | 2.0 | 10 c |
| 6 | NGC 855 | 2.0 | ( 100 ) | ( 26 ) | 6.4 | 6 | 2.5 | 20 a | |
| 7 | NGC 891 | 17.3 1.0 | 545 1 | 59 5 | 274 40 | 7.3 0.02 | 8.1 0.02 | 0.2 0.01 | 3a,† |
| 8 | NGC 972 | 37.0 0.8 | 1544 2 | 225 5 | 155 13 | 8.3 0.01 | 8.6 | 2.1 | 1 b |
| 9 | MAFFEI 2 | 157.1 2.3 | –23 1 | 163 3 | 905 49 | 7.2 0.01 | 7.0 0.01 | 1.6 0.03 | 8 a |
| 10 | NGC 1055 | 19.6 0.9 | 959 4 | 175 10 | 105 18 | 7.7 0.02 | 8.0 0.02 | 0.4 0.03 | 3 a |
| 11 | NGC 1068 | 116.0 1.4 | 1158 1 | 228 3 | 479 24 | 8.6 0.01 | 8.8 0.01 | 0.5 0.02 | 3 a |
| 12 | NGC 1084 | 14.9 0.7 | 1360 3 | 144 7 | 98 14 | 7.9 0.02 | 8.2 0.31 | 0.5 0.34 | 3 a |
| 13 | NGC 1087 | 7.7 0.4 | 1498 2 | 82 5 | 88 11 | 7.6 0.02 | 7.9 0.03 | 0.5 0.04 | 3 a |
| 14 | NGC 1275 | 9.0 0.8 | 5276 12 | 248 23 | 34 14 | 8.8 0.04 | 8.5 | 1.8 | 22 a |
| 15 | NGC 1530 | 30.0 1.1 | 2417 5 | 86 9 | 109 34 | 8.6 0.05 | 8.9 | 0.6 | 29 a |
| 16 | NGC 1569 | 2.9 0.7 | –70 5 | 43 10 | 64 20 | 5.2 0.10 | 5.0 0.04 | 1.5 0.37 | 30 a |
| 17 | NGC 1614 | 71.1 5.9 | 4729 9 | 221 19 | 303 73 | 9.6 0.03 | 9.4 0.01 | 1.6 0.14 | 5 a |
| 18 | NGC 1637 | 4.9 0.3 | 729 3 | 91 6 | 51 8 | 7.0 0.03 | 7.4 0.02 | 0.4 0.03 | 3 a |
| 19 | NGC 2146 | 66.9 1.5 | 787 1 | 124 3 | 505 36 | 8.1 0.01 | 8.4 0.01 | 0.6 0.02 | 3a,† |
| 20 | NGC 2559 | 37.3 1.6 | 1497 3 | 147 8 | 238 33 | 8.3 0.02 | 8.9 | 1.2 | 1 b |
| 21 | NGC 2655 | 2.6 | ( 400 ) | ( 17 ) | 7.1 | 7.5 | 1.8 | 1 b | |
| 22 | NGC 2681 | 17.1 1.7 | 680 7 | 137 14 | 117 40 | 7.3 0.04 | 7.5 0.01 | 0.6 0.06 | 3 a |
| 23 | NGC 2768 | 1.5 | ( 200 ) | ( 14 ) | 6.8 | 6.6 | 1.9 | 20 a | |
| 24 | Arp 55 | 11.1 0.7∗ | 11907 | 305 | 31 7 | 9.5 0.03 | 10.0 | 1.6 | 1 b |
| 25 | NGC 2782 | 31.2 2.2∗ | 2587 | 272 | 95 25 | 8.7 0.01 | 8.7 | 1.9 | 1 b |
| 26 | NGC 2841 | 4.2 | ( 200 ) | ( 39 ) | 6.5 | 6.8 | 0.6 | 3 a | |
| 27 | NGC 2903 | 59.6 3.4∗ | 525 | 143 | 390 69 | 7.6 0.03 | 7.8 | 0.6 | 8 a |
| 28 | Arp 303 S | 18.6 1.2∗ | 6058 | 379 | 42 12 | 9.2 0.02 | |||
| 29 | Arp 303 N | 37.8 1.9∗ | 6144 | 502 | 62 18 | 9.5 0.03 | |||
| 30 | NGC 2985 | 8.0 1.3 | 1226 15 | 183 38 | 41 17 | 7.5 0.07 | 7.7 0.01 | 0.7 0.19 | 3 a |
| 31 | NGC 3032 | 4.1 0.8 | 1535 11 | 130 31 | 30 12 | 7.4 0.08 | 7.7 | 0.4 | 27 a |
| 32 | NGC 3034 | 1056.0 6.3 | 228 1 | 203 1 | 4890 166 | 8.0 0.00 | 7.9 | 1.4 | 8 a |
| 33 | NGC 3079 | 93.4 5.5∗ | 1190 | 408 | 178 57 | 8.4 0.03 | 8.8 0.01 | 0.4 0.03 | 25 a |
| 34 | NGC 3077 | 8.0 0.3 | 7 1 | 42 2 | 181 12 | 6.2 0.05 | 6.0 0.03 | 1.5 0.10 | 2 a |
| 35 | NGC 3110 | 24.5 0.8 | 5071 5 | 325 11 | 71 8 | 9.2 0.01 | (9.2, 9.8) | (0.5, 1.6) | 13 b,d |
| 36 | NGC 3166 | 19.0 | ( 300 ) | ( 141 ) | 7.9 | 8.2 | 0.5 | 12 a | |
| 37 | NGC 3169 | 11.0 1.1∗ | 1144 | 259 | 53 15 | 7.6 0.05 | 8.3 | 0.4 | 1 b |
| 38 | NGC 3147 | 19.8 1.0 | 2904 12 | 466 28 | 40 8 | 8.6 0.02 | 8.5 | 1.2 | 29 a,† |
| 39 | NGC 3227 | 18.1 1.0 | 1154 7 | 244 16 | 70 12 | 7.8 0.03 | 8.2 0.03 | 0.3 0.03 | 3 a |
| 40 | HARO 2 | 2.5 0.3 | 1452 5 | 86 9 | 28 8 | 7.1 0.05 | 7.5 0.03 | 0.4 0.05 | 21 a |
| 41 | NGC 3310 | 6.9 0.7 | 1032 7 | 135 13 | 48 15 | 7.2 0.04 | 6.9 0.11 | 1.9 0.52 | 3 a |
| 42 | NGC 3351 | 26.0 1.4 | 783 6 | 200 11 | 122 27 | 7.6 0.02 | 7.4 0.05 | 1.5 0.19 | 3 a |
| 43 | NGC 3367 | 7.5 1.1 | 3044 6 | 86 15 | 82 22 | 8.2 0.08 | 8.6 | 0.2 | 13 d |
| 44 | NGC 3368 | 24.6 1.0 | 885 4 | 194 10 | 119 19 | 7.6 0.02 | 7.8 0.01 | 0.7 0.04 | 3 a |
| 45 | NGC 3521 | 14.5 1.4 | 746 9 | 178 19 | 76 20 | 7.4 0.04 | (7.1, 8.2) | 0.6 0.9 | 1b,23d |
| 46 | NGC 3556 | 14.4 1.8 | 693 5 | 94 17 | 143 31 | 7.2 0.06 | (7.0, 7.9) | (0.9, 1.0) | 1b,31d |
| 47 | NGC 3593 | 17.3 1.2∗ | 643 | 128 | 99 17 | 7.2 0.02 | 7.8 | 0.3 | 12 a |
| 48 | NGC 3627 | 33.4 1.3 | 717 4 | 211 9 | 149 25 | 7.8 0.02 | 8.1 | 0.6 | 3 a |
| NGC 3627A | 21.9 0.9 | 673 3 | 142 8 | 145 19 | 7.7 0.02 | 8 | 0.5 | 16 a | |
| 49 | NGC 3628 | 140.7 1.4 | 870 1 | 214 2 | 618 25 | 8.4 0.00 | 8.3 0.02 | 1.1 0.05 | 3 a |
| 50 | NGC 3642 | 7.4 1.0 | 1544 19 | 235 39 | 29 12 | 7.6 0.06 | |||
| 51 | NGC 3682 | 12.2 1.6 | 1584 16 | 240 35 | 48 16 | 7.8 0.06 | 7.6 | 1.7 | 12 e |
| 52 | NGC 3690A | 36.4 2.4 | 3155 3 | 125 12 | 273 46 | 8.9 0.03 | 8.8 | 1.2 | 18 a |
| 53 | NGC 3690B | 48.7 1.9 | 3102 5 | 239 10 | 191 33 | 9.1 0.02 | 8.9 | 1.6 | 18 a |
| 54 | NGC 3810 | 20.5 1.6 | 960 6 | 145 13 | 133 24 | 7.7 0.06 | 7.5 0.03 | 1.7 0.18 | 3 a |
| 55 | NGC 3982 | 6.7 0.7 | 1185 3 | 61 9 | 104 16 | 7.6 0.04 | 7.7 | 0.4 | 11 d |
| 56 | IC 750 | 37.4 2.2 | 691 6 | 205 14 | 172 41 | 7.6 0.03 | 7.8 0.03 | 0.6 0.06 | 3 a |
| 57 | NGC 4038 | 44.0 1.0 | 1640 1 | 87 2 | 473 19 | 8.4 0.03 | 8.6 0.06 | 0.7 0.03 | 17 a |
| NGC 4038/9 | 82.6 2.3∗ | 1515 | 166 | 494 25 | 8.7 0.02 | 8.8 0.01 | 0.8 0.02 | 17 a | |
| 58 | NGC 4039 | 15.2 1.9∗ | 1657 | 100 | 133 30 | 8.0 0.04 | 8.5 0.09 | 0.3 0.04 | 17 a |
| 59 | NGC 4102 | 49.0 3.4∗ | 823 | 220 | 172 39 | 7.9 0.02 | 8.2 | 0.6 | 8 a |
| 60 | NGC 4138 | 5.3 | ( 400 ) | ( 34 ) | 7.0 | 7.1 | 3.2 | 1 b | |
| 61 | NGC 4192 | 7.0 1.4 | –191 6 | 71 19 | 93 14 | 7.4 0.09 | (7.3, 8.1) | (0.6, 0.8) | 14b,26c |
| 62 | NGC 4254 | 24.0 1.7∗ | 2434 | 140 | 147 20 | 7.9 0.03 | (7.9, 8.4) | (0.5, 1.2) | 14b,23c |
| 63 | NGC 4258 | 64.4 1.1 | 407 3 | 311 6 | 195 17 | 7.8 0.01 | 7.8 | 0.9 | 20 a |
| 64 | NGC 4293 | 20.4 0.5 | 933 2 | 159 4 | 121 11 | 7.9 0.01 | 8.4 | 0.3 | 12 a |
| 65 | NGC 4303 | 33.7 3.2 | 1575 6 | 127 13 | 250 52 | 8.1 0.04 | (8.1, 8.7) | (0.5, 1.6) | 14b,23c |
| 66 | NGC 4314 | 37.6 3.0∗ | 1049 | 187 | 159 53 | 7.9 0.03 | 7.7 0.01 | 1.6 0.12 | 3 a |
| 67 | NGC 4321 | 56.9 4.2 | 1590 7 | 177 14 | 302 84 | 8.3 0.03 | 8.4 0.00 | 0.7 0.05 | 3 a |
| 68 | NGC 4369 | 8.2 0.6 | 1035 2 | 62 5 | 124 18 | 7.3 0.03 | 7.8 | 0.4 | 12 a |
| 69 | NGC 4395 | 2.8 | ( 400 ) | ( 18 ) | 5.8 | ||||
| 70 | NGC 4414 | 31.2 0.6 | 740 3 | 312 7 | 94 9 | 8.3 0.01 | 8.5 0.03 | 0.5 0.04 | 3 a |
| 71 | NGC 4438 | 11.3 | ( 300 ) | ( 84 ) | 7.6 | 8.4 | 0.2 | 3 a | |
| 72 | NGC 4457 | 20.3 0.7 | 897 3 | 168 7 | 114 14 | 7.9 0.02 | 8.1 | 2.4 | 1 b |
| 73 | NGC 4490 | 24.4 3.7 | 669 32 | 411 68 | 56 28 | 7.5 0.07 | 7.3 | 2.1 | 1 b |
| 74 | NGC 4527 | 37.4 5.3∗ | 1642 | 179 | 171 48 | 8.1 0.06 | 8.6 | 1.3 | 1b,31d |
| 75 | NGC 4565 | 8.3 1.5 | 1271 9 | 91 21 | 86 28 | 7.5 0.08 | 7.6 0.04 | 0.7 0.14 | 3 a |
| 76 | NGC 4594 | 6.8 0.8 | 1086 17 | 292 41 | 22 8 | 7.2 0.05 | 7.5 | 0.9 | 1 b |
| 77 | NGC 4631 | 17.7 0.7 | 638 1 | 71 3 | 233 22 | 7.2 0.02 | 7.6 | 0.4 | 24 a |
| 78 | NGC 4639 | 4.5 | ( 400 ) | ( 29 ) | 7.0 | 7.5 | 14 b | ||
| 79 | NGC 4654 | 18.9 1.4 | 1053 4 | 95 7 | 187 40 | 7.8 0.03 | 7.9 0.02 | 0.8 0.07 | 3 a |
| 80 | NGC 4666 | 36.7 3.8 | 1498 13 | 242 27 | 142 45 | 8.3 0.04 | (8.1, 8.8) | (0.8, 1.2) | 1b,31d |
| 81 | NGC 4691 | 12.9 1.0 | 1129 1 | 43 4 | 282 50 | 7.6 0.03 | (7.6, 7.8) | (0.5, 2.7) | 1b,31d |
| 82 | NGC 4710 | 18.7 2.5∗ | 1125 | 158 | 90 27 | 7.8 0.05 | (7.8, 8.1) | (0.5, 2.7) | 14b,31d |
| 83 | NGC 4736 | 21.3 2.0∗ | 279 | 122 | 133 19 | 6.8 0.02 | 7.0 0.04 | 0.7 0.09 | 6a,† |
| 84 | MRK 231 | 8.1 0.8 | 12690 10 | 215 24 | 35 9 | 9.5 0.04 | 9.9 0.06 | 0.4 0.06 | 6,16 a |
| 85 | NGC 4818 | 42.4 1.1 | 1055 2 | 123 4 | 324 26 | 8.1 0.01 | 8.1 | 1 | 8 a |
| 86 | NGC 4826 | 86.8 5.2∗ | 430 | 214 | 340 61 | 7.8 0.02 | (7.8, 8.1) | (0.6, 2.0) | 1b,23d |
| 87 | NGC 4941 | 6.7 0.7 | 1105 3 | 56 7 | 113 19 | 7.3 0.19 | 6.7 | 0.4 | 11 d |
| 88 | NGC 5033 | 16.7 1.1 | 879 8 | 240 16 | 66 13 | 7.5 0.03 | 7.6 0.03 | 0.8 0.08 | 3 a |
| 89 | NGC 5055 | 25.8 3.5∗ | 595 | 190 | 99 46 | 7.5 0.10 | 8 | 0.4 | 8 a |
| 90 | UGC 8335 | 3.6 0.6∗ | 9371 | 154 | 15 6 | 8.9 0.05 | 9.6 | 1.2 | 10 c |
| 91 | UGC 8335B | 8.0 1.2∗ | 9337 | 106 | 32 14 | 9.2 0.08 | 9.7 | 2.7 | 10 c |
| 92 | Arp 193 | 20.5 1.7∗ | 6967 | 240 | 64 14 | 9.4 0.04 | 9.6 0.09 | 0.6 0.12 | 9 a |
| 93 | NGC 5194 | 44.4 2.8 | 422 2 | 61 5 | 681 87 | 7.5 0.03 | 7.5 0.05 | 1.0 0.13 | 6a,† |
| 94 | M 83 | 153.9 3.1 | 519 1 | 112 3 | 1290 76 | 7.6 0.01 | 7.6 | 1.1 0.06 | 28 a |
| 95 | NGC 5256 | 5.7 0.9∗ | 8369 | 278 | 18 5 | 9.0 0.05 | 9.8 | 1.2 | 10 c |
| 96 | NGC 5257 | 18.2 1.5 | 6787 13 | 312 29 | 55 16 | 9.3 0.04 | 9.3 | 0.5 | 13 d |
| 97 | NGC 5258 | 27.0 1.1 | 6806 8 | 347 16 | 73 12 | 9.5 0.02 | 9.3 | 0.7 | 13 d |
| 98 | NGC 5273 | 0.9 | ( 100 ) | ( 11 ) | 6.4 | 6.4 | 11 d | ||
| 99 | MRK 273 | 20.1 0.7∗ | 11355 | 471 | 35 6 | 9.8 0.02 | 9.8 0.02 | 0.9 0.05 | 5 a |
| 100 | NGC 5347 | 12.0 1.4 | 2382 4 | 78 10 | 144 28 | 8.2 0.08 | (7,7, 8.5) | (1.7, 3.9) | 7c,11d |
| 101 | NGC 5666 | 9.2 1.8 | 2321 29 | 276 51 | 31 17 | 8.0 0.08 | 8.2 0.02 | 0.7 0.15 | 20 a |
| 102 | Arp 302S | 8.5 1.5∗ | 9774 | 232 | 27 11 | 9.3 0.07 | 9.6 | 3.4 | 10 c |
| Arp 302 center | 4.9 | ( 400 ) | ( 22 ) | 9.0 | |||||
| 103 | Arp 302N | 18.1 1.1∗ | 10281 | 548 | 21 9 | 9.6 0.07 | 10.4 | 1.3 | 10 c |
| 104 | NGC 5866 | 8.6 | ( 200 ) | ( 78 ) | 7.0 | 7.2 | 0.6 | 12 a | |
| 105 | NGC 5907 | 8.4 0.7 | 663 3 | 82 9 | 96 19 | 7.0 0.04 | 7.5 0.02 | 0.3 0.03 | 3 a |
| 106 | Mrk 848 | 4.2 0.4 | 12111 4 | 88 11 | 44 7 | 9.1 0.05 | 9.4 | 0.5 | 19 a |
| 107 | NGC 5953 | 21.5 2.2∗ | 2003 | 147 | 112 40 | 8.3 0.04 | (8.4, 8.6) | (0.5, 2.3) | 13 d |
| 108 | Arp 220 | 58.5 1.9∗ | 5427 | 379 | 129 8 | 9.6 0.02 | 9.9 0.04 | 0.5 0.05 | 7,15 a |
| 109 | NGC 6240 | 74.9 2.2∗ | 7394 | 355 | 186 21 | 10.0 0.01 | 9.9 0.09 | 1.1 0.22 | 15,4 a |
| 110 | 17208-0014 | 24.6 1.4 | 12857 11 | 386 24 | 60 9 | 10.0 0.03 | 9.9 0.09 | 1.2 0.26 | 15 a |
| 111 | Arp 293 | 13.3 1.8∗ | 5431 | 282 | 56 14 | 9.0 0.05 | 9.5 | 1.4 | 1 b |
| 112 | NGC 6524 | 6.6 1.1 | 5659 10 | 125 24 | 49 14 | 8.7 0.07 | |||
| 113 | NGC 6670B | 19.8 1.8∗ | 8618 | 360 | 58 20 | 9.5 0.07 | 9.9 | 2.8 | 10 c |
| NGC 6670 | 8.3 0.7∗ | 8688 | 268 | 45 19 | 9.2 0.04 | 10.2 | 0.7 | 10 c | |
| 114 | NGC 6670A | 16.2 1.5∗ | 8702 | 307 | 27 8 | 9.5 0.05 | 9.8 | 3.5 a | 10 c |
| 115 | NGC 6814 | 2.1 0.2 | 1557 7 | 119 13 | 17 4 | 7.1 0.06 | (7.3, 8.1) | (0.3, 0.5) | 1b,11d |
| 116 | NGC 6946 | 132.3 1.8 | 60 1 | 150 2 | 827 56 | 7.7 0.01 | 7.8 0.03 | 0.9 0.07 | 6 a |
| 117 | NGC 7013 | 10.5 0.8 | 829 13 | 352 30 | 28 7 | 7.2 0.03 | 7 | 1.4 | 12 a |
| 118 | NGC 7077 | 0.8 0.2 | 1015 16 | 222 31 | 19 7 | 6.4 0.06 | 6.3 | 1.1 0.38 | 21 a |
| 119 | NGC 7217 | 8.1 0.7 | 924 12 | 269 25 | 28 8 | 7.2 0.04 | 7.3 0.02 | 0.8 0.08 | 3 a |
| 120 | NGC 7331 | 7.2 0.6∗ | 884 | 50 | 74 15 | 7.3 0.03 | 8.0 0.01 | 0.2 0.02 | 3 a |
| NGC 7331A | 12.6 1.0∗ | 903 | 145 | 86 25 | 7.6 0.05 | 8.0 0.01 | 0.3 0.03 | 3 a | |
| 121 | NGC 7465 | 6.3 0.9 | 1970 10 | 127 17 | 47 16 | 7.8 0.06 | 8.2 | 1.6 | 1 b |
| 122 | NGC 7469 | 35.2 1.3 | 4949 5 | 249 10 | 133 22 | 9.3 0.02 | (8.8, 9.4) | (1.5, 3.4) | 1b,11d |
| 123 | NGC 7479 | 20.1 1.3 | 2381 8 | 238 19 | 79 15 | 8.4 0.03 | 9.1 | 1.6 | 1 b |
| 124 | NGC 7541 | 17.8 0.9 | 2673 4 | 144 9 | 116 20 | 8.3 0.02 | 8.5 | 0.6 | 8 a,† |
| 125 | NGC 7679 | 17.2 1.4∗ | 5110 | 285 | 55 29 | 9.0 0.05 | 9.0 | (1.1, 2.4) | 12 e |
The columns contain the following information: Col.(1): Sequence number. Col.(2): Galaxy name. Cols.(3)–(6): The CO(3–2) line intensity ( = ), LSR velocity, width (FWHM), and main beam brightness temperature, respectively, with corresponding standard errors from Gaussian fits or from ∗moments in the case of non-Gaussian line shapes. Non-detections are listed with their rms noise level (Col.(6) values in brackets) at a channel spacing of 6.6 . In these cases the full width of the CO(1–0) line (10, Col.(5) values in brackets) was estimated from spectra taken from the literature or was set to 400 ; corresponding upper limits for were obtained using (Col.(3)). Col.(7): The CO(3–2) luminosity calculated with Eq.(1) (see § 4.1) for a beam of = 22′′. Col.(8): The CO(1–0) luminosity calculated with an equation similar to that of for galaxies with IRAM-30m CO(1–0) data available in the literature (listed in Col(10)); otherwise either upper or lower limits are given, depending on the telescope used for CO(1–0). Col.(9): The CO(3–2)/CO(1–0) line intensity ratio and its standard deviation for galaxies with IRAM-30m CO(1–0) data available in the literature (listed in Col(10)); otherwise either upper or lower limits are given, depending on the telescope used for the CO(1–0) data. Col.(10): References for the CO(1–0) data: 1. Young et al. (1995); 2. Albrecht et al. (2004); 3.Braine et al. (1993); 4. Combes et al. (1991); 5. Gao & Solomon (2004b); 6. Gerin et al. (2000); 7. Heckman et al. (1989); 8. Mauersberger et al. (1999); 9. Radford et al. (1991); 10. Sanders et al. (1991); 11. Vila-Vilaró et al. (1998); 12. Wiklind & Henkel (1989); 13. Yao et al. (2003); 14. Kenney et al. (1988); 15. Solomon et al. (1997); 16. Reuter et al. (1996); 17. Schulz et al. (2007); 18. Casoli et al. (1989); 19. Chini et al. (1992); 20. Wiklind et al. (1995); 21. Sage et al. (1992); 22. Reuter et al. (1993); 23. Nishiyama et al. (2001); 24. Golla & Wielebinski (1993); 25. Handa et al. (1990); 26. Kuno et al. (2007); 27. Combes et al. (2007); 28. Baan et al. (2008); 29. Solomon et al. (1992); 30. Greve et al. (1996); 31. Komugi et al. (2008). Telescopes used are a IRAM-30m; b FCRAO-14m; c NRAO–12m; d NRO-45m; e OSO-20m. †: The CO(1–0) data was taken at an offset position 5′′ relative to our CO(3–2) position.
| galaxy | statistics | |||||
|---|---|---|---|---|---|---|
| type | N | meanddThe mean value and its standard error. | eeStandard deviation of an individual target. | median | min | max |
| (activity) | ||||||
| normal | 7 | 0.61 0.16 | 0.42 | 0.44 | 0.26 | 1.51 |
| LINERaaIncluding starbursts but not (U)LIRG overlaps. | 20 | 0.65 0.08 | 0.36 | 0.57 | 0.19 | 1.57 |
| SeyfertaaIncluding starbursts but not (U)LIRG overlaps. | 12 | 0.82 0.12 | 0.43 | 0.75 | 0.27 | 1.79 |
| ‘pure’ AGNbbSee §. 2.2.2 for details. | 18 | 0.78 0.09 | 0.37 | 0.70 | 0.19 | 1.57 |
| starburstccExcluding (U)LIRGs. | 25 | 0.89 0.11 | 0.53 | 0.71 | 0.25 | 1.93 |
| (U)LIRG | 10 | 0.96 0.14 | 0.45 | 0.99 | 0.37 | 1.63 |
| (bar) | ||||||
| SA | 18 | 0.62 0.10 | 0.41 | 0.50 | 0.19 | 1.71 |
| SAB | 16 | 0.80 0.11 | 0.44 | 0.72 | 0.25 | 1.93 |
| SB | 12 | 0.88 0.15 | 0.53 | 0.67 | 0.30 | 1.63 |
| Total | 61 | 0.81 0.06 | 0.46 | 0.69 | 0.19 | 1.93 |