PHENIX Collaboration
Measurement of Transverse Single-Spin Asymmetries
for Production
in Polarized Collisions at GeV
Abstract
We report the first measurement of transverse single-spin asymmetries in production from transversely polarized collisions at GeV with data taken by the PHENIX experiment in 2006 and 2008. The measurement was performed over the rapidity ranges and for transverse momenta up to 6 GeV/. production at RHIC is dominated by processes involving initial-state gluons, and transverse single-spin asymmetries of the can provide access to gluon dynamics within the nucleon. Such asymmetries may also shed light on the long-standing question in QCD of the production mechanism. Asymmetries were obtained as a function of transverse momentum and Feynman-, with a value of in the forward region. This result suggests possible nonzero trigluon correlation functions in transversely polarized protons and, if well defined in this reaction, a nonzero gluon Sivers distribution function.
pacs:
14.20.Dh, 13.88.+e, 13.85.Ni, 14.40.PqI Introduction
The transverse single-spin asymmetry (SSA) quantifies the asymmetry of particle production relative to the plane defined by the transverse spin axis and the momentum direction of a polarized hadron. SSAs have come to be recognized as a means of accessing QCD dynamics, both within initial-state hadrons and in the process of hadronization from partons. Large azimuthal transverse single-spin asymmetries of up to % were first observed at large Feynman- (, where is the momentum along the beam direction) in pion production from transversely polarized collisions at GeV in 1976 Klem et al. (1976), contrary to theoretical expectations at the time Kane et al. (1978), and subsequently observed in hadronic collisions over a range of energies extending up to GeV Allgower et al. (2002); Antille et al. (1980); Adams et al. (1991a, b); Arsene et al. (2008); Adams et al. (2004); Abelev et al. (2008). In recent years numerous measurements of transverse SSAs have been performed in semi-inclusive deep-inelastic scattering (SIDIS) off a transversely polarized proton or deuteron target as well Airapetian et al. (2005); Alexakhin et al. (2005); Ageev et al. (2007); Airapetian et al. (2008); Alekseev et al. (2009); Airapetian et al. (2009). In order to describe the large transverse SSAs observed, two approaches have been developed since the 1990s, after early pioneering work by Efremov and Teryaev Efremov and Teryaev (1982, 1985). One approach requires higher-twist contributions in the collinear factorization scheme, i.e. the exchange of a gluon between one of the partons taking part in the hard scattering and the color field of either an initial- or final-state hadron. This was first proposed by Qiu and Sterman for gluon exchange in the initial state Qiu and Sterman (1999) and by Kanazawa and Koike for exchange in the final state Kanazawa and Koike (2000). Gluon exchange in either the initial or final state leads to terms including multiparton correlation functions, which can generate a nonzero SSA. The other approach utilizes parton distribution functions and/or fragmentation functions that are unintegrated in the partonic transverse momentum, ; these functions are generally known as transverse-momentum-dependent distributions (TMDs). These two approaches have different but overlapping kinematic regimes of applicability and have been shown to correspond exactly in their region of overlap Ji et al. (2006).
While higher-twist parton-nucleon spin-momentum correlation functions and TMDs were born within the nucleon structure community, as understanding of them matures, their implications for other areas of QCD are starting to be realized. production has been extensively studied over the last decades, but the details of the production mechanism remain an open question (see ref. Lansberg (2006) for a comprehensive review), and an additional complication is that approximately 30%–40% of the measured mesons in hadronic collisions are produced indirectly from feed-down from and Abt et al. (2003). It was proposed in 2008 by Yuan Yuan (2008) that within the framework of nonrelativistic QCD (NRQCD) Bodwin et al. (1995), the transverse SSA of production can be sensitive to the production mechanism, assuming a nonzero gluon Sivers function Sivers (1990), which is a TMD that describes the correlation between the transverse spin of the proton and the of the partons within it. Specifically, Yuan predicts that a nonzero gluon Sivers function will produce a finite transverse SSA for color-singlet production Baier and Ruckl (1981) in collisions, but the asymmetry should vanish for color-octet production Bodwin et al. (1995) in due to cancelation between initial- and final-state effects, while a nonzero asymmetry for production in SIDIS is only expected within the color-octet model. It should be noted that the relationship between the transverse SSA and the production mechanism is not quite as simple in the collinear higher-twist approach, with partial but not full cancelation of terms Kang (2010) in the cases where the asymmetry uniformly vanishes in the TMD approach presented by Yuan. Another important point to note regarding the TMD as compared to the collinear, higher-twist approach is that very recent theoretical work Rogers and Mulders (2010) suggests that factorization of hard processes in perturbative QCD (pQCD) into transverse-momentum-dependent distribution and fragmentation functions convoluted with partonic hard-scattering cross sections is not valid for processes involving more than two hadrons. Thus, in the process a gluon Sivers function may not be well defined; however, the definition within a factorized pQCD framework of the corresponding trigluon correlation functions in the collinear, higher-twist approach is believed to be valid.
Measurements of heavy flavor transverse SSAs in collisions are of interest because they serve to isolate gluon dynamics within the nucleon, with heavy quarks being dominantly produced via gluon-gluon interactions. Very little is presently known about trigluon correlation functions or gluon TMDs. Measurements of the transverse momentum () spectrum of bottomonium production have been used to extract the -unintegrated distribution of gluons in an unpolarized proton Kulesza and Stirling (2003). Similarly, measurements of open heavy flavor transverse SSAs have been proposed as a means to isolate gluon TMDs and/or their corresponding twist-three gluon correlation functions in polarized protons Anselmino et al. (2004); Kang et al. (2008); Yuan and Zhou . A previous PHENIX measurement of the transverse SSA in neutral pion production at midrapidity Adler et al. (2005) as well as measurements by the COMPASS collaboration of the SSA in semi-inclusive charged hadron production Alexakhin et al. (2005), both consistent with zero, have been used to provide initial constraints on the gluon Sivers function and suggest that it is small Anselmino et al. (2006); Brodsky and Gardner (2006), but further data relevant to gluon TMDs are greatly needed.
In this paper the first measurement of transverse SSAs in production is presented. The data were taken by the PHENIX experiment at the Relativistic Heavy Ion Collider (RHIC) during the 2006 and 2008 polarized proton runs at GeV. The and dependencies are studied, for rapidity regions of , , and , and up to 6 GeV/.
II Analysis
II.1 Measuring Transverse Single-Spin Asymmetries
Transverse single-spin asymmetries lead to modulations of the cross section in the azimuthal angle due to the projection of the polarization vector into the direction of the produced particle. Our measurement is performed in two separate hemispheres referred to as ‘left’ and ‘right’ where left is defined as the axis which forms a right-handed coordinate system with the beam momentum vector and one of the spin orientations, denoted as . For a vector in the direction of the spin and beam momentum , left is defined as with being the momentum vector of the outgoing particle.
The left-right transverse SSA can be extracted using Eq. (1). This equation applies to particle yields observed to the left side of the polarized beam.
| (1) |
where represents the production cross section with beam polarized in the () direction, integrated over the left hemisphere, and is the beam polarization. An overall minus sign is required for on the right side of the polarized beam.
The geometric scale factor corrects for the convolution of an azimuthal asymmetry with detector acceptance. For a sinusoidal asymmetry, as generated by the Sivers function, the factor becomes
| (2) |
where is the azimuthal angle between the outgoing particle and the proton spin, and is the efficiency for detecting a at a given . The limits of integration correspond to the hemisphere in which the measurement is being made. It should be noted that even for a detector with full azimuthal coverage the factor is not unity because we are not determining the amplitude of the modulation directly but measuring an asymmetry which is integrated over entire hemispheres in azimuth.
Both proton beams in RHIC were polarized. In order to derive single-spin asymmetries, we sum over polarization direction states in one of the two beams:
| (3) | |||||
| (4) |
where again indicates the -dependent cross section integrated over one hemisphere, and and represent the spin orientations of the two beams. Differences in luminosities can lead to false asymmetries; see Section II.4. We perform the analysis separately for each beam. Up to 111 out of a possible 120 bunches were filled in each RHIC ring, with 106 ns between bunches. Four preset spin patterns with approximately equal numbers of bunches polarized in opposite directions were alternated during the transverse running periods to minimize systematic effects from the injection process. Stores were nominally held for eight hours. The spin orientation at the PHENIX interaction point was maintained at the default vertical orientation in the RHIC ring for 2008 data taking and rotated to radial orientation for 2006.
Explicitly including the spin orientations of both beams, Eq. (1) can be rewritten as:
| (5) | |||||
where and are the experimental yields in each spin configuration, and , and are ratios of the provided luminosities in each spin orientation. The use of a single polarization factor assumes that bunch polarizations are equal regardless of spin orientation in each beam. We have also assumed that detector efficiencies are equal for each spin orientation, given that the orientations change every 106 or 212 ns.
Beam polarizations at RHIC are measured by two different polarimeters, a fast carbon target polarimeter Nakagawa et al. (2008) for relative polarization measurements and a hydrogen jet polarimeter Okada et al. (2006) for an absolute measurement. The carbon target polarimeter is used to measure relative beam polarization store-by-store, and the hydrogen jet polarimeter is used for absolute calibration of the beam polarization. During the 2006 run the average transverse beam polarizations were
Fill-to-fill variation of beam polarization was 0.03 (1 ) for the clockwise beam and 0.04 (1 ) for the counterclockwise beam. The labels represent the direction in which the beam is circulating when looking from above, and the systematic uncertainties are uncorrelated between beams. There is an additional systematic uncertainty of correlated between the two beams. The average beam polarizations during the 2008 data taking were
each with a fill-to-fill variation of 0.04 (1 ), and with an additional systematic uncertainty of correlated between the beams.
For statistically limited measurements it may be impossible to measure asymmetries using separate yields based on the spin orientation of both beams. In this case a good approximation can be made using
| (6) |
where the spin orientation of the polarized beam is denoted by the arrow, and we have a single relative luminosity . Systematic effects which will be discussed in Section II.4 can be reduced by bringing to a constant value.
To further simplify Eq. (6) we can eliminate all explicit uses of the relative luminosity and calculate a single asymmetry for both the left and right hemispheres using
| (7) |
The geometric scale factor
| (8) |
is different from the scale factor in Eq. (5) and Eq. (6) because left and right are treated simultaneously, leading to differences between the two expressions of order .
II.2 Measurements
Measurements were carried out by the PHENIX experiment at RHIC, where the cross section and polarization of mesons in GeV collisions have also been measured Adare et al. (2007, 2010). An overview of the PHENIX apparatus can be found in Adcox et al. (2003). At forward and backward rapidities, were measured with two muon spectrometers Akikawa et al. (2003), for and , using data recorded in 2006 and 2008. At midrapidity, asymmetries were studied via with the central arm spectrometers Mitchell et al. (2002), for and , using 2006 data. Collisions were identified by triggering on a valid collision vertex as measured by the beam-beam counters (BBC) Allen et al. (2003).
Muon track candidates were detected at forward and backward rapidities with respect to the polarized beam using two muon spectrometers on the north and south sides of the experiment. Each spectrometer consists of 3 cathode strip tracking chambers in a magnetic field (MuTr) and 5 layers of Iarocci tube planes interleaved with thick steel absorbers (MuID).
Muon candidates were selected using the BBC trigger in coincidence with combinations of hits in the MuID called symsets. Each symset is defined by projecting from the center of the interaction region through a tube in the first layer of the MuID to a window of 3 additional tubes in each subsequent layer. Muon candidates are characterized by the depth of their penetration through the MuID. A deep track requires at least one hit of the symset to occur in either the first or second layer and one hit in either the fourth or fifth layer with at least three layers containing hits, while a shallow track requires only one hit in either the first or second layer with at least two hits in the first three layers. In order for a muon to reach the MuID it must have a minimum total momentum of 1.9 GeV/, and 2.4 GeV/ is needed to reach the last layer.
The dimuon trigger for the 2006 data required at least one muon candidate satisfying the deep trigger requirement and another satisfying at least the shallow trigger, while the trigger for the 2008 data required two deep muon candidates. After run selection, the muon spectrometer on the north (south) side of PHENIX sampled an integrated luminosity of 1.75 (1.63) pb-1 in 2006 and 4.33 (4.30) pb-1 in 2008.
For candidate muon pairs, the collision vertex was required to be within 35 cm of the center of the interaction region along the beam direction, and each track was required to have longitudinal momentum (GeV/) . The distance between the track projections from the MuID and the MuTr to the first MuID layer was required to be less than 25 (30) cm for the detector on the north (south) side, and the angular difference was required to be less than 10 degrees. A fit to the common vertex of the two tracks was performed and required to have a for 4 degrees of freedom.
For an electron candidate at midrapidity, a coincidence was required between the BBC trigger and a trigger designed to select electrons (ERT), which required a nominal minimum energy of 0.4 GeV in a -tower region () of the electromagnetic calorimeter (EMCal) and corresponding activity in the ring-imaging Čerenkov detector (RICH). After run selection the central arm spectrometers sampled an integrated luminosity of 1.36 pb-1 in 2006.
The momentum of electron candidate tracks was reconstructed using the drift chamber (DCH), and their energy was measured with the EMCal. A minimum momentum cut of 0.5 GeV/ was applied, and the ratio of the measured energy to momentum () was required to be within four standard deviations () of 1, with the resolution in varying with between 10% and 15%. Position matching between the track in the DCH and energy cluster in the EMCal was required to be in both the beam direction and azimuth, and only collisions occurring within 30 cm of the center of the interaction region along the beam direction were considered, matching the central arm acceptance.
II.3 Analysis Method for
Transverse single-spin asymmetries for the decay channel were determined by subtracting a background asymmetry from the inclusive signal as
| (9) |
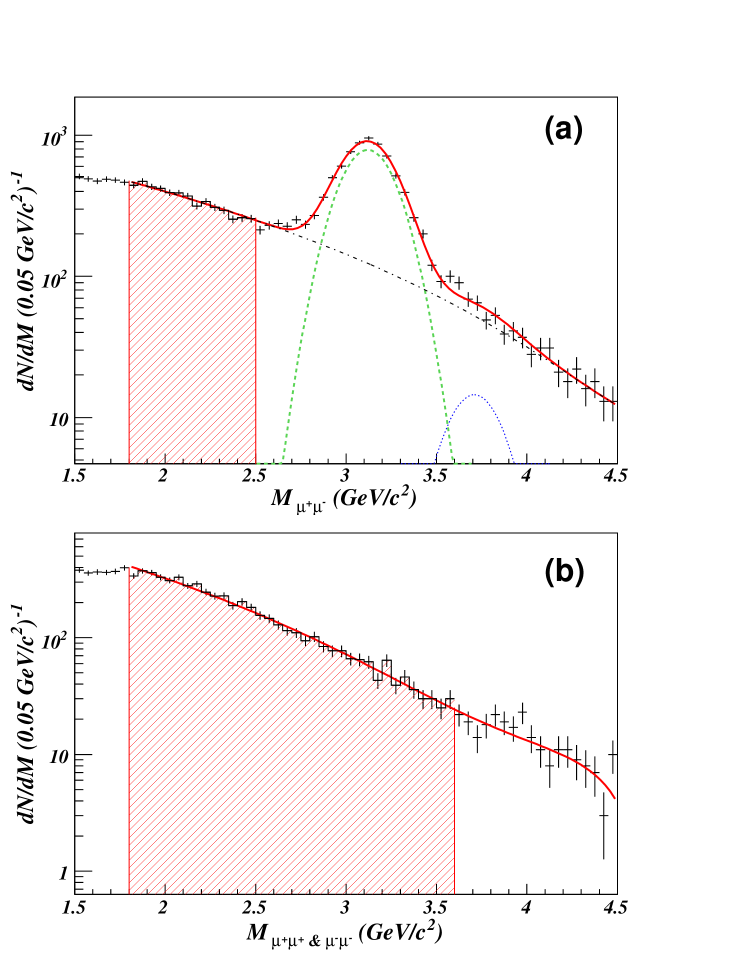
where the values on the right-hand-side were calculated using Eq. (5). The asymmetry is for oppositely-charged muon pairs in the invariant mass range around the mass (where is the mass resolution of the detector), and for the analysis of the 2006 data set is the asymmetry for oppositely-charged muon pairs in the invariant mass range (GeV/) along with charged pairs of the same sign in invariant mass range (GeV/) (shaded areas in Fig. 1(a) and (b) respectively). For the analysis of the 2008 data set the lower limit of the mass range was 2.0 GeV/. As a cross check, was calculated separately for the oppositely-charged muon pairs and charged pairs of the same sign, and the results were consistent. Table 1 gives the measured values of . The mass resolution was measured to be 0.143 0.003 (0.154 0.004) GeV/ in the muon spectrometer on the north (south) side for the 2006 data set and consistent with this for the 2008 data set.
| (GeV/) | data set | ||
|---|---|---|---|
| 0–6 | -0.081 | 2006 | -0.0030.028 |
| -0.082 | 2008 | -0.0720.034 | |
| 0.084 | 2006 | -0.0080.028 | |
| 0.086 | 2008 | -0.0030.035 | |
| 0–1.4 | -0.081 | 2006 | -0.0210.034 |
| -0.081 | 2008 | -0.0890.042 | |
| 0.085 | 2006 | 0.0020.034 | |
| 0.087 | 2008 | -0.0080.043 | |
| 1.4–6 | -0.081 | 2006 | 0.0010.053 |
| -0.082 | 2008 | -0.0410.068 | |
| 0.084 | 2006 | -0.0390.053 | |
| 0.086 | 2008 | 0.0240.066 |
The background fraction is defined as
| (10) |
where is the total number of oppositely-charged muon pairs in the invariant mass range around the mass, and is the yield in the same mass range. was extracted by fitting the invariant mass spectrum of oppositely-charged muon pairs with two Gaussians (for the and resonances, the peak shape of which is dominated by the detector resolution) and a third-order polynomial (for the remaining pairs), using the expression:
| (11) | |||||
The free parameters in the fit are the four polynomial parameters as well as , , , and . The mass and width of the are fixed relative to the based on simulations. The polynomial is used to fit the background from both physical sources (i.e. Drell-Yan, open heavy flavor) and uncorrelated track combinations. Uncorrelated track combinations comprise more than 50% of the oppositely-charged muon pairs under the mass peak. An example mass spectrum and fit is shown in Fig. 1(a). The total yield in the dimuon decay channel was 6403 126 for the 2006 and 15380 150 for the 2008 data set. Table 2 gives background fractions in different ranges determined from the fit. The asymmetries were measured store-by-store, using Eq. (5), with the final results obtained by averaging over all stores.
A geometric scale factor from 2006 data of was determined from azimuthal distributions in data and was found to be independent of within statistical uncertainties. In the 2008 data, the polarization of the clockwise circulating beam was found to be rotated by 0.25 0.033 rad away from vertical (see Appendix A), meaning that was different depending on which beam was considered polarized in the analysis. The geometric scale factors from that analysis were for the clockwise circulating beam and for the counter-clockwise circulating beam
| (GeV/) | data set | detector | background fraction (%) |
|---|---|---|---|
| 0–6 | 2006 | South | 21.70.6 |
| 2006 | North | 19.10.4 | |
| 2008 | South | 16.40.2 | |
| 2008 | North | 14.20.2 | |
| 0–1.4 | 2006 | South | 23.20.7 |
| 2006 | North | 22.00.7 | |
| 2008 | South | 16.10.3 | |
| 2008 | North | 15.50.3 | |
| 1.4–6 | 2006 | South | 20.10.8 |
| 2006 | North | 14.10.5 | |
| 2008 | South | 15.60.4 | |
| 2008 | North | 10.50.2 |
Several systematic checks were performed in the analysis. Asymmetries were determined using random spin orientations to cross check their consistency with zero. The means were found consistent with zero and widths consistent with statistical uncertainties in . The parity-odd asymmetries along the proton spin direction were also measured and found to be consistent with zero as expected for the strong interaction.
Following previous PHENIX publications systematic uncertainties in this analysis are categorized as Type A, point-to-point uncorrelated, Type B, scaling all points in the same direction but not by the same factor, and Type C, scaling all points by the same factor. It should be noted that all scale uncertainties affect both the central values and the statistical uncertainties such that the statistical significance of the measurement from zero is preserved. A single Type A systematic uncertainty is included, which is due to the fit used to determine the background. The fit was nominally performed using a range of (GeV/) for the 2006 and (GeV/) for the 2008 data. To estimate the uncertainty due to the choice of fit range, the fit was then performed using a range of (GeV/) , and the difference of the calculated with the nominal was taken as a systematic uncertainty. Other systematic uncertainties are discussed in Section III.
II.4 Analysis Method for
For the RHIC luminosities and store lengths in 2006 there were too few s detected in the PHENIX central arms to calculate a separate asymmetry for each store. Instead, asymmetries were calculated using Eq. (7) from statistics integrated across the four-week running period. The integration of statistics over a long time-period requires special care to be taken in order to avoid introducing false asymmetries.
If we measure an asymmetry in time periods with, for simplicity, equivalent statistics in each measurement , we can determine an averaged asymmetry in the left hemisphere using Eq. (6) as
| (12) |
Since each measurement is probing the same physical observable we have the same for all within statistical uncertainties. This allows us to calculate the asymmetry as
| (13) |
which corresponds to integrating our measurement periods into a single measurement. For a statistically limited measurement we do not calculate , , and for all but assume that the measurement can be made as
| (14) |
where the brackets denote a luminosity-weighted average over the course of the measurement. In order for the same physical observable to be calculated by this expression without additional systematic uncertainty we must have , , and for all .
The PHENIX central arm acceptance was stable enough over the course of the running period so that the assumption is valid for , but variations in the polarization and relative luminosity must be taken into account. Variations in the polarization were found to be consistent with statistical and systematic errors on measurements of the polarization and contribute to an uncertainty in the overall scale of (scale uncertainties will be discussed in more detail in Section III). Variations in have the most significant effect on the asymmetry as they can potentially contribute to false asymmetries.
In order to stabilize relative luminosities a procedure was developed wherein several bunches of colliding protons are removed from the analysis so that the relative luminosity within each store is brought as close to unity as possible given the finite number of bunches. In principle we could choose any constant value for the relative luminosity, but unity is chosen for convenience.
First, all bunches with luminosities greater than 2 standard deviations away from the mean bunch luminosity of a store are removed. A bunch is then chosen at random, and if removing this bunch from the analysis brings the relative luminosity closer to unity it is removed. Otherwise it is kept, and another bunch is chosen at random. The process continues until the relative luminosity is within 1 of unity or as close to unity as possible given the finite number of bunches. The corrected relative luminosities were distributed with an RMS of approximately 1.5 away from unity, and the entire procedure removed approximately 5 of the provided luminosity from the data sample used in this analysis.
Since removed bunches are chosen at random, the result of the analysis is not unique, and a systematic uncertainty is introduced. In order to determine this systematic uncertainty, the analysis was run 5000 times, and the resulting asymmetries and statistical uncertainties were histogrammed. The mean values of these two histograms were then taken as the central value and statistical uncertainty, and the RMS of the histogrammed asymmetry was taken as the dominant systematic uncertainty in the analysis.
It is not generally true that detector efficiencies are independent of spin orientation in the PHENIX central arms when triggering with the ERT, as even and odd numbered crossings are triggered by separate circuits with slightly different gains. While the results for even and odd crossings are consistent within statistical uncertainties and no systematic trend is observed, to eliminate any possible effects from the different trigger circuits we measure asymmetries separately for even and odd crossings and combine the resulting asymmetries.
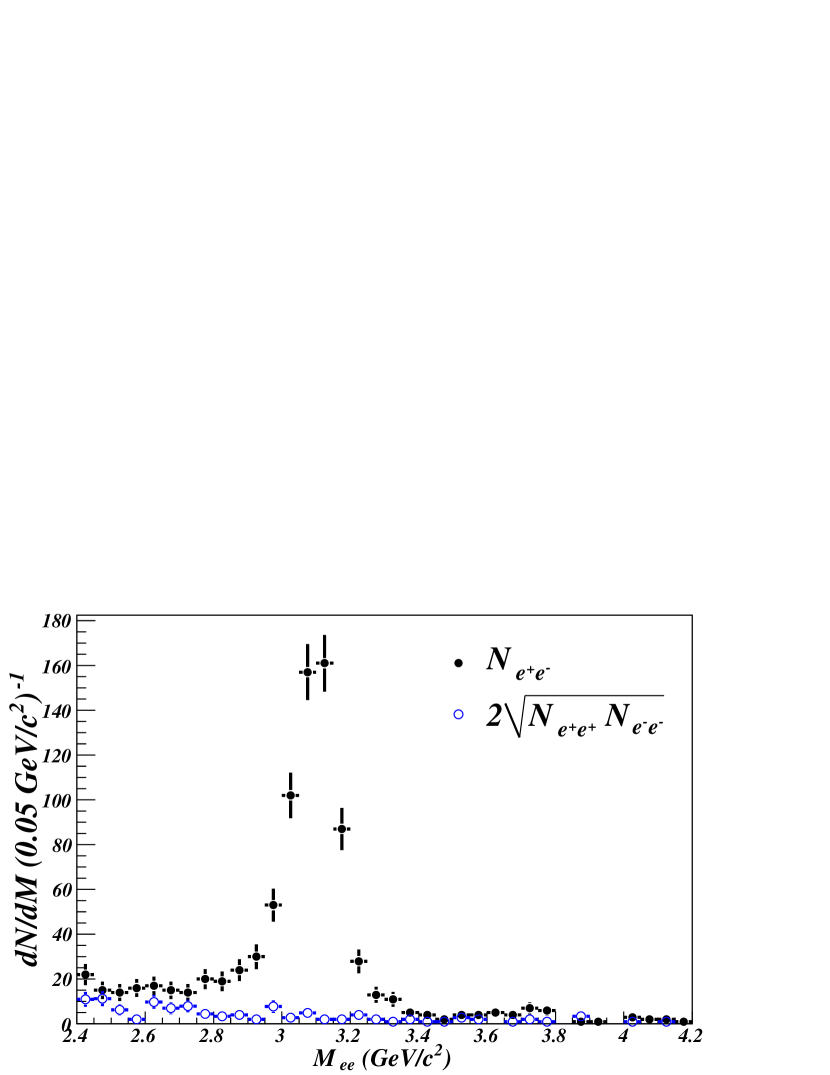
The PHENIX central arms detected 539 25 mesons in an invariant mass range (GeV/) . The resolution of the mass peak was found to be 0.061 0.002 GeV/. Charged lepton pairs with the same sign are due to uncorrelated tracks and are subtracted from the oppositely-charged pairs using the number of like-signed pairs as . Both mass spectra can be found in Fig. 2. After subtracting the uncorrelated tracks from the mass spectra, there is a remaining continuum background from open heavy flavor and Drell-Yan production as well as a small number of lepton pairs from decays reconstructed to low mass. The contribution from conversion electrons is negligible. The background fraction from continuum pairs as defined in Eq. (10) can be found in Table 3. There were not enough statistics in the continuum background to determine , and inclusion of such background was not found to significantly affect the signal asymmetry. An overall dilution of the signal is included assuming that 0.
| (GeV/) | (%) | ||
|---|---|---|---|
| 0–6 | 6.60.4 | ||
| 0–1.4 | 5.60.5 | ||
| 1.4–6 | 7.80.7 |
| (GeV/) | |||
|---|---|---|---|
| 0–6 | 1.620.01 | ||
| 0–1.4 | 1.610.01 | ||
| 1.4–6 | 1.700.02 |
There were not enough s detected in order to determine geometric scale factors for the asymmetries at midrapidity from data. These factors were instead determined using a GEANT GEA (1993) Monte Carlo simulation of single decays with a full geometric description of the central arm detectors including all known inefficiencies. Geometric scale factors used in the analysis are given in Table 4 and mean polarizations in Section II.1.
A number of systematic checks were performed to ensure the validity of the measurement. The number of s produced divided by the provided beam luminosity was calculated and found to be constant across stores. Asymmetries were determined with randomized spin directions as described in Section II.3 and found to be distributed in normal distributions which had means consistent with zero and widths consistent with the statistical uncertainties. Parity-odd asymmetries along the proton spin direction were measured and found to be consistent with zero, as expected.
III Results and summary
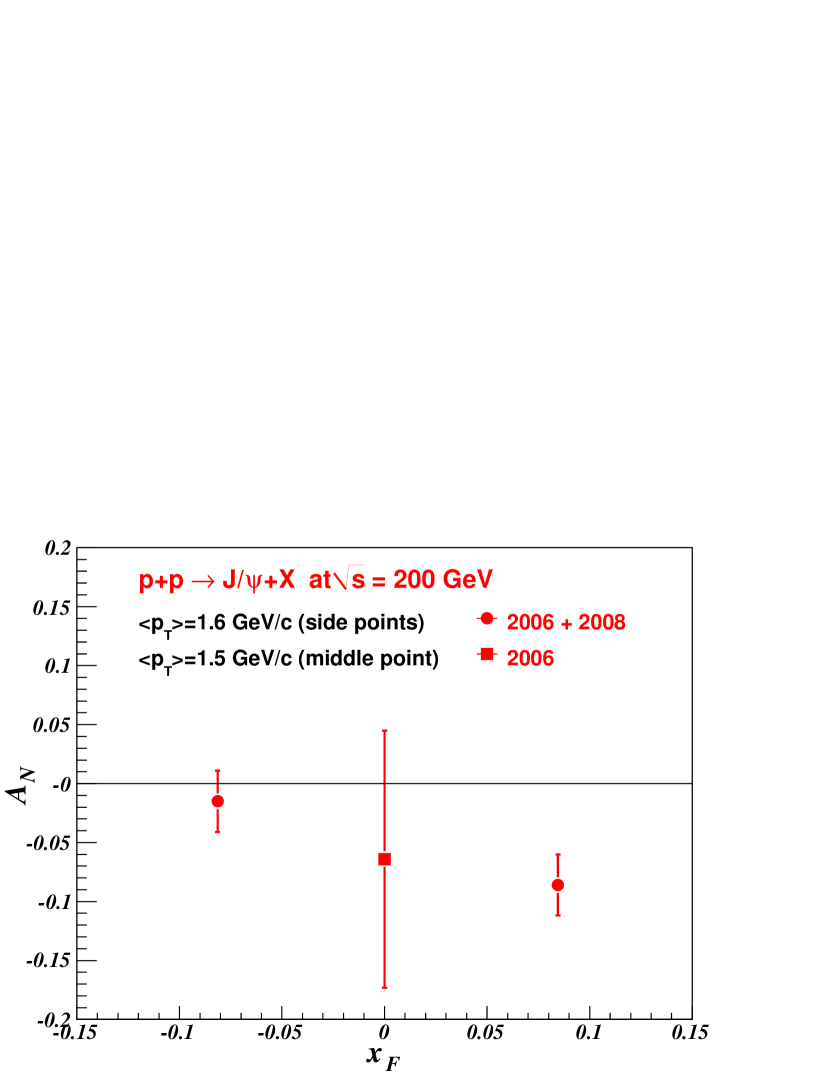
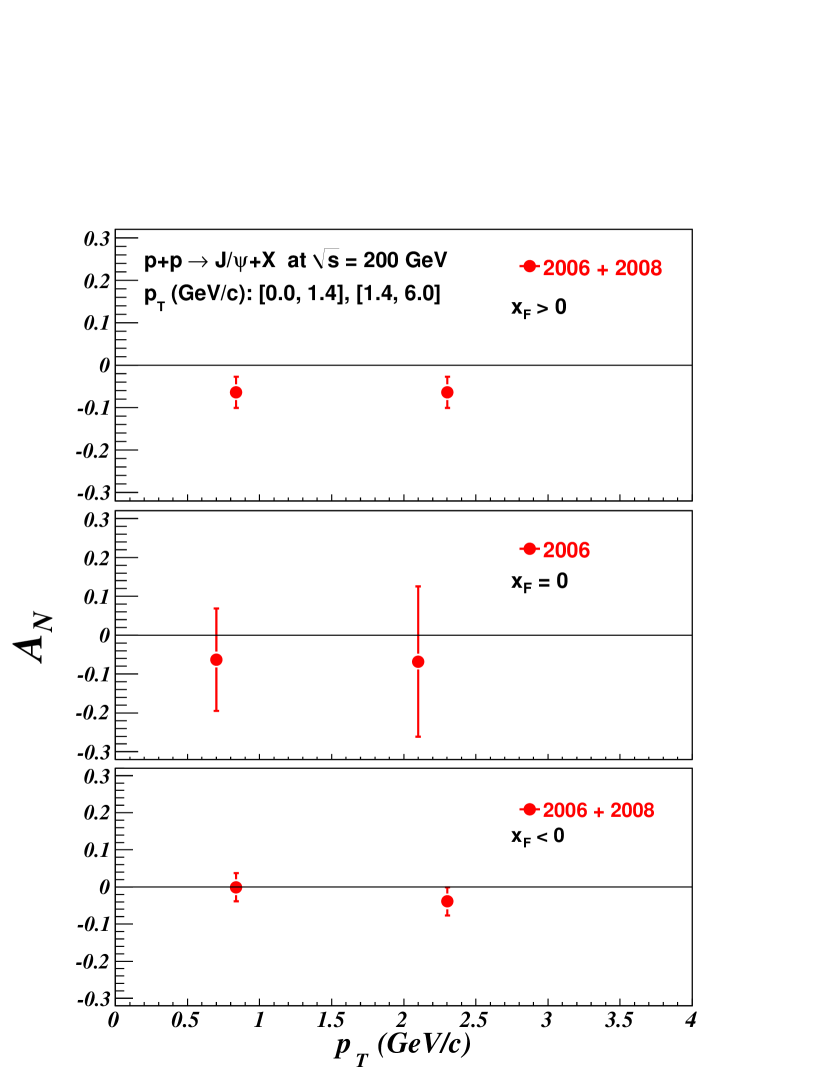
Figures 3 and 4 present the measured transverse single-spin asymmetry in production versus , and Fig. 5 shows the measured transverse SSA at different rapidities as a function of . The results are tabulated in Table 5. The Type A systematic uncertainties, which are point-to-point uncorrelated, are due to the procedure used to stabilize the relative luminosity in the midrapidity analysis, as described in Section II.4, and the fit used to determine the background in the analysis at forward and backward rapidities, as described in Section II.3. As discussed in Section II.1, uncertainties in the geometric scale factors and polarizations lead to a fractional scale uncertainty on . The uncertainties shown in the last two columns of Table 5 are Type B systematic uncertainties, scaling all or points in the same data set in the same direction but not necessarily by the same factor. There are additional Type C scale uncertainties, which scale all points in exactly the same way, due to the fully correlated polarization uncertainties in each data set of 3.4% for 2006, 3.0% for 2008, and 2.4% for the combined 2006 and 2008 data sets. It should be noted that all scale uncertainties affect both the central values and the statistical uncertainties such that the statistical significance of the measurement from zero is preserved. While in principle the polarization uncertainties do not affect symmetrically due to the fact that , the difference in the value of the uncertainties scaling to larger and smaller magnitudes of is less than the precision shown.
As the functional form of the asymmetry in and is completely unknown, no correction has been made for potential smearing effects. A simulation study was performed assuming a linear dependence of on , and it was found that smearing effects were less than 10% of the value of the input asymmetry.
| Data Sample | (%) | (%) | |||||
|---|---|---|---|---|---|---|---|
| (GeV/) | (stat) | (Type A syst) | (Type B syst) | (Type B syst.) | |||
| 2006 | -0.081 | -0.024 | 0.044 | 0.003 | 0.6 | 2.3 | |
| 2008 | -0.082 | -0.010 | 0.032 | 0.004 | 0.4 | 3.4 | |
| 2006 + 2008 | -0.081 | -0.015 | 0.026 | 0.002 | 0.4 | 2.8 | |
| 0–6 | 2006 | 0.000 | -0.064 | 0.106 | 0.026 | 0.6 | 2.3 |
| 2006 | 0.084 | -0.105 | 0.044 | 0.005 | 0.6 | 2.3 | |
| 2008 | 0.086 | -0.075 | 0.032 | 0.003 | 0.4 | 3.3 | |
| 2006 + 2008 | 0.085 | -0.086 | 0.026 | 0.003 | 0.4 | 2.7 | |
| 2006 | -0.081 | 0.050 | 0.067 | 0.007 | 0.6 | 2.3 | |
| 2008 | -0.081 | -0.025 | 0.046 | 0.008 | 0.4 | 3.4 | |
| 2006 + 2008 | -0.081 | -0.001 | 0.038 | 0.005 | 0.4 | 2.8 | |
| 0–1.4 | 2006 | 0.000 | -0.063 | 0.128 | 0.031 | 0.6 | 2.3 |
| 2006 | 0.085 | -0.065 | 0.066 | 0.005 | 0.6 | 2.3 | |
| 2008 | 0.087 | -0.064 | 0.045 | 0.003 | 0.4 | 3.4 | |
| 2006 + 2008 | 0.086 | -0.064 | 0.037 | 0.003 | 0.4 | 2.7 | |
| 2006 | -0.081 | -0.073 | 0.065 | 0.002 | 0.6 | 2.3 | |
| 2008 | -0.082 | -0.023 | 0.046 | 0.010 | 0.4 | 3.5 | |
| 2006 + 2008 | -0.082 | -0.039 | 0.038 | 0.002 | 0.4 | 2.8 | |
| 1.4–6 | 2006 | 0.000 | -0.068 | 0.188 | 0.045 | 1.2 | 2.3 |
| 2006 | 0.084 | -0.046 | 0.064 | 0.005 | 0.6 | 2.3 | |
| 2008 | 0.086 | -0.073 | 0.046 | 0.007 | 0.4 | 3.3 | |
| 2006 + 2008 | 0.085 | -0.064 | 0.037 | 0.004 | 0.4 | 2.7 |
The measured asymmetry at forward is negative, -, with a statistical significance from zero of , suggesting a nonzero trigluon correlation function in transversely polarized protons and, if well defined as a universal function in the reaction , a nonzero gluon Sivers function. A nonzero transverse SSA in production in generated by gluon dynamics may seem surprising given the SSAs consistent with zero in midrapidity neutral pion production at PHENIX Adler et al. (2005) and semi-inclusive charged hadron production at COMPASS Alexakhin et al. (2005). However, the details of color interactions have been shown to play a major role in SSAs Rogers and Mulders (2010), so further theoretical development will be necessary before we fully understand the relationships among these measured asymmetries. As discussed in Ref. Yuan (2008), a nonzero transverse SSA in production in polarized collisions generated by a gluon Sivers TMD would be evidence against large contributions from color-octet diagrams for production. If a gluon Sivers TMD is in fact well defined and nonzero, a new experimental avenue has been opened up to probe the production mechanism, a long-standing question in QCD. As discussed in Section I, there is a relationship between the SSA and the production mechanism of the in the collinear, higher-twist approach, but it is not as simple as in the TMD approach.
Future data from RHIC are expected to improve the precision of the current measurement, and a similar measurement for production in SIDIS with a transversely polarized target could shed further light on the production mechanism, as Yuan (2008) predicts a vanishing asymmetry for the color-singlet model in SIDIS but nonzero asymmetry for the color-octet model. While no rigorous quantitative calculations are presently available for either collision system, we anticipate that future theoretical calculations will provide more detailed guidance on the implications of the present results.
ACKNOWLEDGMENTS
We thank the staff of the Collider-Accelerator and Physics Departments at Brookhaven National Laboratory and the staff of the other PHENIX participating institutions for their vital contributions. We also thank Feng Yuan, Jianwei Qiu, and Zhongbo Kang for helpful discussions. We acknowledge support from the Office of Nuclear Physics in the Office of Science of the Department of Energy, the National Science Foundation, a sponsored research grant from Renaissance Technologies LLC, Abilene Christian University Research Council, Research Foundation of SUNY, and Dean of the College of Arts and Sciences, Vanderbilt University (USA), Ministry of Education, Culture, Sports, Science, and Technology and the Japan Society for the Promotion of Science (Japan), Conselho Nacional de Desenvolvimento Científico e Tecnológico and Fundação de Amparo à Pesquisa do Estado de São Paulo (Brazil), Natural Science Foundation of China (People’s Republic of China), Ministry of Education, Youth and Sports (Czech Republic), Centre National de la Recherche Scientifique, Commissariat à l’Énergie Atomique, and Institut National de Physique Nucléaire et de Physique des Particules (France), Ministry of Industry, Science and Tekhnologies, Bundesministerium für Bildung und Forschung, Deutscher Akademischer Austausch Dienst, and Alexander von Humboldt Stiftung (Germany), Hungarian National Science Fund, OTKA (Hungary), Department of Atomic Energy (India), Israel Science Foundation (Israel), National Research Foundation and WCU program of the Ministry Education Science and Technology (Korea), Ministry of Education and Science, Russia Academy of Sciences, Federal Agency of Atomic Energy (Russia), VR and the Wallenberg Foundation (Sweden), the U.S. Civilian Research and Development Foundation for the Independent States of the Former Soviet Union, the US-Hungarian Fulbright Foundation for Educational Exchange, and the US-Israel Binational Science Foundation.
*
Appendix A Local Polarimetry
The transverse component of the proton polarization is monitored at PHENIX by a measurement of the SSA of forward neutron production with a Zero-Degree Calorimeter (ZDC) and Shower Maximum Detector (SMD), collectively referred to as the local polarimeter.
The ZDC consists of three modules of hadronic calorimeter, 1.7 interaction length each, located approximately 18 m from the center of the interaction region. The SMD consists of two layers of plastic scintillator arrays located between the first and second modules of the ZDC, and it provides horizontal and vertical position information of the detected neutrons. There is an additional plastic scintillator in front of the ZDC used to identify and veto charged particles.
Neutron candidates were selected by triggering on a coincidence between the BBC trigger and a signal in either the north or south ZDC. Due to bandwidth restrictions, the trigger was prescaled by a factor typically around 100. The analysis of the 2006 data used events from radially polarized collisions, and the analysis of the 2008 data used events from vertically polarized collisions.
Neutrons were selected offline by requiring an energy deposit in the ZDC between 20 and 120 GeV along with no hit in the veto scintillator (less than 1 minimum-ionizing particle). Hits were required in both the horizontal and vertical planes of the SMD, and neutrons were required to be between 0.3 mrad (0.5 cm at the SMD) and 1.4 mrad (2.5 cm at the SMD) from the beam.
The asymmetry is calculated using fits to the azimuthal distribution of the neutrons:
where is the azimuthal angle relative to vertical, and is the deviation of the polarization from the nominal direction.
The position resolution of the local polarimeter is approximately 1 cm. To determine a systematic uncertainty on the polarization direction, fits are performed for 1 cm around the center of the azimuthal neutron distribution (defined as the position where is maximal). The deviation of the polarization from nominal, in radians, was found to be
for the 2006 data and
for the 2008 data. The polarization directions of the counterclockwise-going beam in 2006 and clockwise-going beam in 2008 were considered to be significant and used in the calculation of for .
References
- Klem et al. (1976) R. D. Klem et al., Phys. Rev. Lett. 36, 929 (1976).
- Kane et al. (1978) G. L. Kane, J. Pumplin, and W. Repko, Phys. Rev. Lett. 41, 1689 (1978).
- Allgower et al. (2002) C. E. Allgower et al., Phys. Rev. D 65, 092008 (2002).
- Antille et al. (1980) J. Antille et al., Phys. Lett. B94, 523 (1980).
- Adams et al. (1991a) D. L. Adams et al. (FNAL-E581 Collaboration), Phys. Lett. B261, 201 (1991a).
- Adams et al. (1991b) D. L. Adams et al. (FNAL-E704 Collaboration), Phys. Lett. B264, 462 (1991b).
- Arsene et al. (2008) I. Arsene et al. (BRAHMS Collaboration), Phys. Rev. Lett. 101, 042001 (2008).
- Adams et al. (2004) J. Adams et al. (STAR Collaboration), Phys. Rev. Lett. 92, 171801 (2004).
- Abelev et al. (2008) B. I. Abelev et al. (STAR Collaboration), Phys. Rev. Lett. 101, 222001 (2008).
- Airapetian et al. (2005) A. Airapetian et al. (HERMES Collaboration), Phys. Rev. Lett. 94, 012002 (2005).
- Alexakhin et al. (2005) V. Y. Alexakhin et al. (COMPASS Collaboration), Phys. Rev. Lett. 94, 202002 (2005).
- Ageev et al. (2007) E. S. Ageev et al. (COMPASS Collaboration), Nucl. Phys. B765, 31 (2007).
- Airapetian et al. (2008) A. Airapetian et al. (HERMES Collaboration), JHEP 06, 017 (2008).
- Alekseev et al. (2009) M. Alekseev et al. (COMPASS Collaboration), Phys. Lett. B673, 127 (2009).
- Airapetian et al. (2009) A. Airapetian et al. (HERMES Collaboration), Phys. Rev. Lett. 103, 152002 (2009).
- Efremov and Teryaev (1982) A. V. Efremov and O. V. Teryaev, Sov. J. Nucl. Phys. 36, 140 (1982).
- Efremov and Teryaev (1985) A. V. Efremov and O. V. Teryaev, Phys. Lett. B150, 383 (1985).
- Qiu and Sterman (1999) J.-W. Qiu and G. Sterman, Phys. Rev. D 59, 014004 (1999).
- Kanazawa and Koike (2000) Y. Kanazawa and Y. Koike, Phys. Lett. B478, 121 (2000).
- Ji et al. (2006) X. Ji, J.-W. Qiu, W. Vogelsang, and F. Yuan, Phys. Rev. Lett. 97, 082002 (2006).
- Lansberg (2006) J. P. Lansberg, Int. J. Mod. Phys. A21, 3857 (2006).
- Abt et al. (2003) I. Abt et al. (HERA-B), Phys. Lett. B561, 61 (2003).
- Yuan (2008) F. Yuan, Phys. Rev. D 78, 014024 (2008).
- Bodwin et al. (1995) G. T. Bodwin, E. Braaten, and G. P. Lepage, Phys. Rev. D 51, 1125 (1995), Erratum-ibid. D55, 5853 (1997).
- Sivers (1990) D. W. Sivers, Phys. Rev. D 41, 83 (1990).
- Baier and Ruckl (1981) R. Baier and R. Ruckl, Phys. Lett. B102, 364 (1981).
- Kang (2010) Z.-B. Kang (2010), private communication.
- Rogers and Mulders (2010) T. C. Rogers and P. J. Mulders, Phys. Rev. D 81, 094006 (2010).
- Kulesza and Stirling (2003) A. Kulesza and W. J. Stirling, JHEP 12, 056 (2003).
- Anselmino et al. (2004) M. Anselmino, M. Boglione, U. D’Alesio, E. Leader, and F. Murgia, Phys. Rev. D 70, 074025 (2004).
- Kang et al. (2008) Z.-B. Kang, J.-W. Qiu, W. Vogelsang, and F. Yuan, Phys. Rev. D 78, 114013 (2008).
- (32) F. Yuan and J. Zhou, arXiv:0806.1932 [hep-ph].
- Adler et al. (2005) S. S. Adler et al. (PHENIX Collaboration), Phys. Rev. Lett. 95, 202001 (2005).
- Anselmino et al. (2006) M. Anselmino, U. D’Alesio, S. Melis, and F. Murgia, Phys. Rev. D 74, 094011 (2006).
- Brodsky and Gardner (2006) S. J. Brodsky and S. Gardner, Phys. Lett. B643, 22 (2006).
- Nakagawa et al. (2008) I. Nakagawa et al., AIP Conf. Proc. 980, 380 (2008).
- Okada et al. (2006) H. Okada et al., Phys. Lett. B638, 450 (2006).
- Adare et al. (2007) A. Adare et al. (PHENIX Collaboration), Phys. Rev. Lett. 98, 232002 (2007).
- Adare et al. (2010) A. Adare et al. (PHENIX Collaboration), Phys. Rev. D 82, 012001 (2010).
- Adcox et al. (2003) K. Adcox et al. (PHENIX Collaboration), Nucl. Instrum. Meth. A499, 469 (2003).
- Akikawa et al. (2003) H. Akikawa et al. (PHENIX Collaboration), Nucl. Instrum. Meth. A499, 537 (2003).
- Mitchell et al. (2002) J. T. Mitchell et al. (PHENIX Collaboration), Nucl. Instrum. Meth. A482, 491 (2002).
- Allen et al. (2003) M. Allen et al. (PHENIX Collaboration), Nucl. Instrum. Meth. A499, 549 (2003).
- GEA (1993) GEANT 3.2.1, CERN Computing Library (1993), http://wwwasdoc.web.cern.ch/wwwasdoc/pdfdir/geant.pdf.