Compact molecular disc and ionized gas outflows within 350 pc of the active nucleus of Mrk 1066
Abstract
We present stellar and gaseous kinematics of the inner 350 pc radius of the Seyfert galaxy Mrk 1066 derived from J and Kl bands data obtained with the Gemini’s Near-Infrared Integral Field Spectrograph (NIFS) at a spatial resolution of 35 pc. The stellar velocity field is dominated by rotation in the galaxy plane but shows an S-shape distortion along the galaxy minor axis which seems to be due to an oval structure seen in an optical continuum image. Along this oval, between 170 and 280 pc from the nucleus we find a partial ring of low (50 ) attributed to an intermediate age stellar population. The velocity dispersion of the stellar bulge ( ) implies a super-massive black hole mass of M⊙. From measurements of the emission-line fluxes and profiles ([P ii]m, [Fe ii]m, Pa and H2m), we have constructed maps for the gas centroid velocity, velocity dispersion, as well as channel maps. The velocity fields for all emission lines are dominated by a similar rotation pattern to that observed for the stars, but are distorted by the presence of two structures: (i) a compact rotating disc with radius 70 pc; (ii) outflows along the radio jet which is oriented approximately along the galaxy major axis. The compact rotating disc is more conspicuous in the H2 emitting gas, which presents the smallest values ( ) and most clear rotation pattern, supporting a location in the galaxy plane. We estimate a gas mass for the disc of . The H2 kinematics further suggests that the nuclear disc is being fed by gas coming from the outer regions. The outflow is more conspicuous in the [Fe ii] emitting gas, which presents the highest values (up to 150 ) and the highest blue and redshifts of up to 500 , while the highest stellar rotation velocity is only 130 . We estimate a mass-outflow rate in ionized gas of . The derived kinematics for the emitting gas is similar to that observed in previous studies supporting that the H2 is a tracer of the AGN feeding and the [Fe ii] of its feedback.
keywords:
galaxies: individual (Mrk 1066) – galaxies: Seyfert – galaxies: ISM – galaxies: kinematics and dynamics – infrared: galaxies1 Introduction
This work is a continuing study of the central region of Mrk 1066 using Gemini’s Near-infrared Integral Field Spectrograph (NIFS) observations in the J and Kl bands. In Riffel, Storchi-Bergmann & Nagar (2010, hereafter Paper I), we presented maps for the emission-line flux distribution and ratios and discussed the gas excitation and extinction, as well as the origin of the nuclear continuum. The main results of Paper I are: (i) The line emission in the near-IR lines is extended over the whole NIFS field ( 700 pc) and most elongated at position angle PA=135/315∘, showing a good correlation with the optical [O iii] line and radio continuum emission. [Ca viii]m and [S ix]m coronal lines are the exceptions, being unresolved at the nucleus; (ii) The [Fe ii]m/Pa H2m/Br diagnostic diagram is dominated by values typical of active galaxies; (iii) The reddening map obtained from the Pa/Br line ratio presents a S-shape structure with reaching a value of 1.7 along PA135/315∘; (iv) From line ratio maps we conclude that the main excitation mechanism of the H2 and [Fe ii] emission lines is heating by X-rays from the central AGN. Correlations between the radio and line-emission maps – stronger for [Fe ii] than for the H2 – suggest that shocks due to the radio jet play a role in the gas excitation; (v) The nucleus contains an unresolved infrared source whose continuum is well reproduced by emission from dust with temperature 810 K and mass . In Riffel et al. (2010) we presented stellar population synthesis, which shows that within 160 pc from the nucleus an old stellar population dominates the near-IR continuum (age 1010 yr), while in a partial ring surrounding this region, the continuum is dominated by an intermediate age stellar population ( yr).
Mrk 1066 is an SB0 galaxy located at a distance of 48.6 Mpc which harbours a Seyfert 2 nucleus111NASA/IPAC Extragalactic Database (NED – http://nedwww.ipac.caltech.edu), for which 1′′ corresponds to 235 pc at the galaxy. Previous optical long-slit spectroscopy shows that the high-excitation gas (traced by the [O iii] emission) and low-excitation gas (traced by [N ii], [S ii], [O i] and H recombination lines) present distinct kinematics, with the former being more disturbed with respect to the rotation curve observed in the low-excitation emission lines (Bower et al., 1995). The authors suggest that the high-excitation gas kinematics is due to an outflow driven by the radio jet, which is co-spatial with the extended line emission, along position angle PA=135/315∘ (Ulvestad & Wilson, 1989; Nagar et al., 1999). A distinct kinematics for the high- and low- excitation gas is also supported by optical integral field spectroscopy of the inner 1 kpc of Mrk 1066 (Stoklasová et al, 2009). In the near-IR, the emission lines present asymmetric profiles revealed by long-slit observations (Knop et al., 2001). These asymmetries have been interpreted has being originated in the same outflowing gas component observed in [O iii], while most of the near-IR line emission (traced by the peak of the line profiles) may be due to emission from gas located in the galaxy plane (Knop et al., 2001).
In the present paper, we use the observations described in Paper I to obtain two-dimensional maps for the gaseous and stellar kinematics of the inner pc radius of Mrk 1066, which allowed us to put additional constraints on the physical scenario for the circumnuclear region of this galaxy. This paper is organized as follows: In Section 2 we present the description of the observations and data reduction, Sec. 3 presents the results for the gaseous and stellar kinematics, which are discussed in Sec. 4. Sec. 5 presents the conclusions of this work.
2 Observations and Data Reduction
The J and Kl bands Integral Field Unit (IFU) spectroscopic data of Mrk 1066 were obtained with Gemini NIFS (McGregor et al., 2003) operating with the Gemini North Adaptive Optics system ALTAIR in September 2008 under the programme GN-2008B-Q-30. NIFS has a square field of view of , divided into 29 slices with an angular sampling of 01030042, optimized for use with ALTAIR.
The J band observations were centred at 1.25 m, covering a spectral region from 1.15 m to 1.36 m at a spectral resolution of (from the full width at half maximum – FWHM – of arc lamp lines) and at spatial resolution of 013002, as obtained from the FWHM of the spatial profile of the telluric star. The Kl observations, centred at 2.3 m covered the spectral range from 2.10m to 2.26m at spectral and spatial resolutions of and 015003, respectively. The total exposure time at each band was 4800 s.
The final J and Kl data cubes, obtained by combining the individual exposures (which included some dithering), contain 4200 spectra at an angular sampling of , covering the central 700700 pc2 of Mrk 1066. For a detailed description of the observations and data reduction procedures see Paper I.
3 Results
As shown in Paper I, in the J band we observe the following emission lines: [P ii] 1.14713 and 1.18861 m, [Fe ii] 1.25702, 1.27912, 1.29462, 1.29812, 1.32092 and 1.32814 m, H i Pa, the He ii line at 1.16296 m and the [S ix] coronal line at 1.25235 m.
In the Kl band we observe the H2 lines at 2.12183, 2.15420, 2.22344, 2.24776, 2.40847, 2.41367, 2.42180, 2.43697 and 2.45485 m, the H i Br, the He i 2.14999 m and the [Ca viii] 2.32204 m coronal line. Besides the emission lines, the CO stellar absorption band heads around 2.3 m are also present in the spectra an have been used to derive the stellar kinematics.
3.1 Stellar kinematics
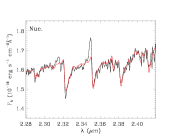
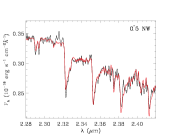
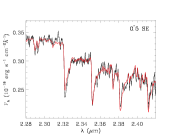
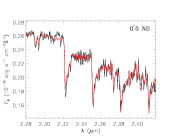
In order to obtain the stellar line-of-sight velocity distributions (LOSVD) we fitted the 12CO and 13CO stellar absorption band heads around 2.3 m in the -band spectra using the penalized Pixel-Fitting (pPXF) method of Cappellari & Emsellem (2004). This method finds the best fit to a galaxy spectrum by convolving stellar template spectra with a given LOSVD [], represented by Gauss-Hermite series (e.g. van der Marel & Franx, 1993; Gerhard, 1993):
| (1) |
where , is the stellar centroid velocity, is the velocity dispersion, and is the speed of light. The are the Hermite polynomials, are the Gauss-Hermite moments (Cappellari & Emsellem, 2004). The pPXF routine outputs the , and the higher-order Gauss-Hermite moments and . As discussed in Riffel et al. (2008) and Winge, Riffel & Storchi-Bergmann (2009), the use of a library of stellar templates, instead of a single stellar spectrum, is fundamental for a reliable derivation of the stellar kinematics. In this work we have used template spectra from the Gemini library of late spectral type stars observed with the Gemini Near-Infrared Spectrograph (GNIRS) IFU and NIFS (Winge, Riffel & Storchi-Bergmann, 2009).
In Figure 1 we show some fits (in red) compared to the observed spectra (in black). This figure illustrate the fits at four positions: the nucleus (top-left panel), 05 north-west (top-right panel), 05 south-east (bottom-left panel) and 05 north-east (bottom-right panel). High signal-to-noise (S/N) ratio () is required to obtain a reliable fit of the observed spectra. As the S/N decreases with distance from the nucleus, we have replaced the flux at each spatial pixel by the average flux of the 9 nearest pixels, which increased the S/N ratio and allowed us to measure the stellar kinematics at most locations, except for a few pixels close to the borders of the IFU field. This procedure can be justified by the fact that our data cube is somewhat oversampled (the pixels correspond to ), and this average is thus equivalent to use an effective aperture of the order of the PSF FWHM ().
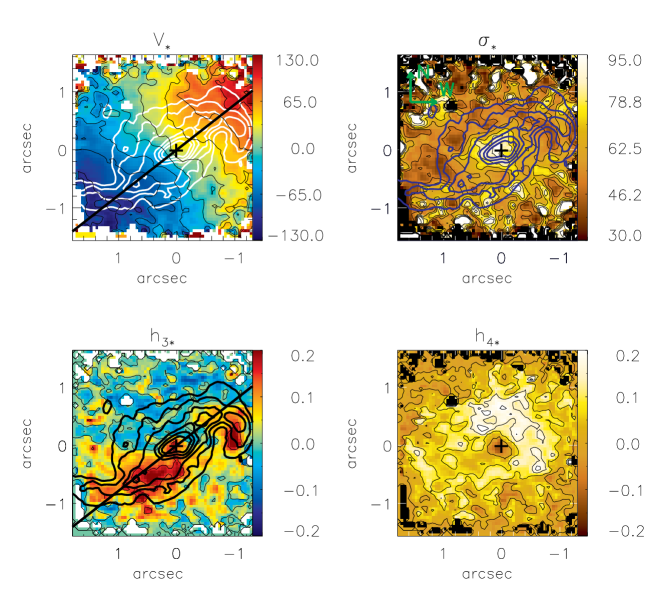
In Figure 2 we present two-dimensional maps of the stellar kinematics. The central cross marks the position of the nucleus, defined as the locus of the peak of the Kl band continuum. The top left panel of Fig. 2 shows the stellar velocity field, from which we subtracted the systemic velocity, obtained from the modeling of this velocity field (see Sec. 4.1). The corresponding heliocentric value is . The continuous black line shows the orientation of the line of nodes – measured from north to east, and obtained also from the modeling mentioned above. The mean uncertainty in the centroid velocity is . The velocity field shows blueshifts to the south-east and redshifts to the north-west and seems to be dominated by rotation, with an amplitude of 120 and kinematical centre coincident with the position of the continuum peak, within the uncertainties.
In the top-right panel of Fig. 2 we present the stellar velocity dispersion map, which has a mean uncertainty of 8 and presents values ranging from 30 to 95 , with the highest ones observed at the nucleus. A partial oval ring of low values () is observed surrounding the nucleus at from it. The bottom panels show the higher order Gauss-Hermite moments (left) and (right). These moments measure deviations of the line profile from a Gaussian: the parameter measures asymmetric deviations and the measures symmetric deviations (e.g. van der Marel & Franx, 1993). The values and vary from 0.2 to 0.2 with mean uncertainty of 0.03. The highest values of are observed from the nucleus to 13 south-east and at north-west from the nucleus, while the lowest values are observed over most of the north and north-east side of the galaxy. The map presents the lowest values at the nucleus, while the highest values are observed in a ring with radius approximately coincident with the ring of low values.
3.2 Gaseous kinematics
The most commonly used method to measure the gaseous kinematics is the fit of the emission-line profiles by Gaussian curves. Nevertheless, the emission lines in Mrk 1066 present asymmetric profiles at many locations, which cannot be well represented by Gaussian curves. We have thus used Gauss-Hermite series (e.g. van der Marel & Franx, 1993; Riffel, 2010), using the same formalism used to derive the stellar kinematics (see Section 3.1) in order to obtain a better fit to the emission-line profiles and a more reliable measurement of the centroid velocity (from the centroid wavelength of the profile), velocity dispersion (), as well as to obtain the higher order and moments. Each emission line profile was fitted by the following equation (Riffel, 2010):
| (2) |
where and , is the amplitude of the Gauss-Hermite series, is the centroid wavelength, and are the Gauss-Hermite moments and and are Hermite polynomials.
We added a linear component to Eq. 2 in order to fit the continuum under each emission-line and thus the resulting equation contains seven free parameters ( plus two parameters for the linear equation), which have been determined by fitting the line profiles. The fitting of the emission-line profile was done using the mpfit222The MPFIT routine can be obtained from the Markwardt IDL Library at http://cow.physics.wisc.edu/ craigm/idl/idl.html routine, written in IDL333http://www.ittvis.com programing language using the Levenberg-Marquardt least-squares method, in which initial guesses are given for the free parameters. More details about the fitting procedure and its implementation can be found in Riffel (2010).
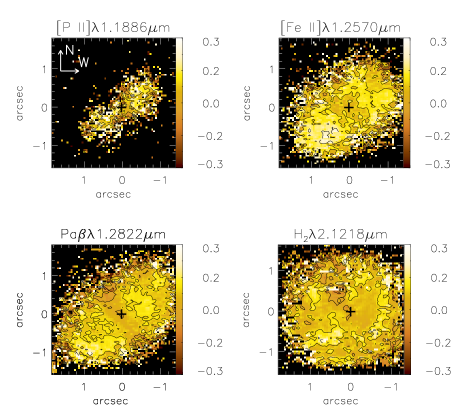
We have chosen the [P ii] 1.1886 m, [Fe ii] 1.2570 m, Pa and H2.1218m emission lines to map the kinematics of the central region of Mrk 1066. These lines trace the kinematics of distinct gaseous species (ionized gas forbidden lines, ionized gas permitted lines and molecular gas). These particular lines have been chosen in order to minimize the measurement uncertainties because they have the highest S/N ratios among their species. In Fig.3 we show a sample of fits obtained for each line profile at 05 north-west from the nucleus within an aperture of 025025. The solid line shows the observed profile, the dashed line shows the fit and the doted line shows the residuals (plus an arbitrary constant for visualization purposes). As shown in Fig. 3 the line profiles are well fitted by the Gauss-Hermite series and thus allow reliable determinations of the centroid velocity, velocity dispersion, and .


Figure 4 shows the velocity fields obtained from the Gauss-Hermite fit of the profiles for the [P ii] 1.1886 m, [Fe ii] 1.2570 m, Pa and H2.1218m emission lines, after subtraction of the systemic velocity of the galaxy (). The crosses mark the position of the nucleus and the dashed lines show the orientation of the line of nodes derived from the modeling of the stellar velocity field (see Sec. 4.1). The gas velocity fields are similar to each other and are dominated by rotation, with the south-east side approaching and the north-west side receding from us. Although similar to the stellar velocity field, the gas velocity fields are more disturbed. The most conspicuous feature is more clearly observed in the H2 velocity field: a gradient from 125 at 05 north-west from the nucleus to 55 at 05 south-east from it along the PA150∘, which seems to be a compact rotating disc immersed in the larger disc (stellar and gaseous).

In Figure 5 we present the gas velocity dispersion () maps. In order to compare our maps with the radio structure we have overlaid the contours (blue lines) of the 3.6 cm radio continuum image from Nagar et al. (1999) on the [Fe ii] map. The [Fe ii] and [P ii] maps are similar and show the highest values of up to 150 in regions at and around the radio structure, while the lowest values ( ) are observed predominantly to south-east of the nucleus. The Pa map presents smaller values than those of [Fe ii] and [P ii], with the highest values of 100 observed approximately along the minor axis of the galaxy. The lowest values ( 60 ) are observed in two structures resembling spiral arms, more clearly observed in the H2 map. This map also shows that these arms – one coming from the east and north-east and the other coming from the west and south-west – seem to curve into the major axis towards the centre into a structure which we have identified with a compact nuclear disc in Sec. 4.2.

In Figures 6 and 7 we present the and Gauss-Hermite moment maps. For [P ii]and [Fe ii], the maps show negative values to north-west of the nucleus, while the Pa presents negative values at most locations (except to east and south of the nucleus). However the most negative values reaching are observed predominately at 1″north-west of the nucleus at the edge of the radio jet, indicating the presence of a blue wing in the emission-line profiles at this location. Some regions with positive , with values of 0.1 and reaching 0.2 at a few locations, are observed to the north, north-east, east and south-east of the nucleus for [Fe ii]and H2, indicating the presence of a red wing in the emission-line profiles at these locations.
The maps present values close to zero at and around the nucleus for all emission lines – indicating no significant deviations from a Gaussian in the emission-line profiles. At 05 from the nucleus approximately along the major axis, the maps for the ionized gas show regions with values 0.15, which indicate that the profiles are narrower and have broader wings than Gaussians at these locations.

Coronal lines are also present in the spectra of Mrk 1066, such as [S ix] m and [Ca viii] 2.32204 m. The [Ca viii] and [S ix] ions have ionization potentials of 127.2 eV and 328.8 eV, respectively (Storchi-Bergmann et al., 2009) and their emission lines can be used to map the kinematics of the high ionization emitting gas. Nevertheless, as discussed in Paper I, their flux distributions are unresolved by our observations. The [Ca viii] line is affected by the 12CO (3-1) 2.323m absorption and we have thus subtracted the stellar population (obtained from the fit of the stellar kinematics) from the galaxy spectra before fitting the [Ca viii] emission-line profile. The fit gave centroid velocity 12 , which is consistent with the systemic velocity of the galaxy within the uncertainties, and velocity dispersion of 145 . The fit of the [S ix] m emission line gives 290 and 70 , but the uncertainties are large because the [S ix] line profile is contaminated by both the [Fe ii] 1.2570 m emission line and underlying stellar absorptions.
3.3 Channel maps
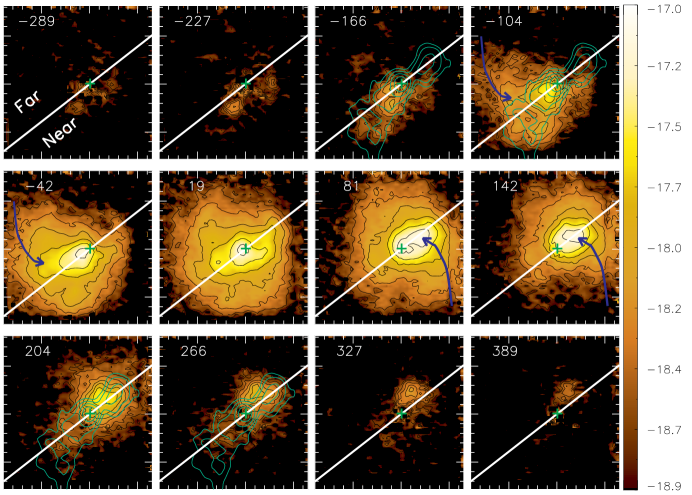
In order to better sample the gas kinematics over the whole velocity distribution, including the highest velocities in the wings of the line profiles, we “sliced” each profile into a sequence of velocity channels. In Figure 8 we present the channel maps for the [Fe ii]m emission line for a velocity bin of 75 , corresponding to three spectral pixels. Each panel presents the flux distribution in logarithmic units integrated within the velocity bin and centred at the velocity shown in the top-left corner of the panel (relative to the systemic velocity of the galaxy). The central cross marks the position of the nucleus and the green contours overlaid to some panels are from the 3.6 cm radio image of Nagar et al. (1999). The highest blueshifts of up to 500 are observed to north-west of the nucleus at 085 from it, approximately coincident with a hot spot observed in the radio map. When the blueshifts reach smaller absolute values, of 300 , the flux distribution presents emission to both sides of the nucleus along the PA135/315∘, which is approximately the PA of both the radio jet and major axis of the galaxy. The highest redshifts, of up to of 450 , have origin in gas located at both sides of the nucleus at distances of 085 to north-west and to south-east.
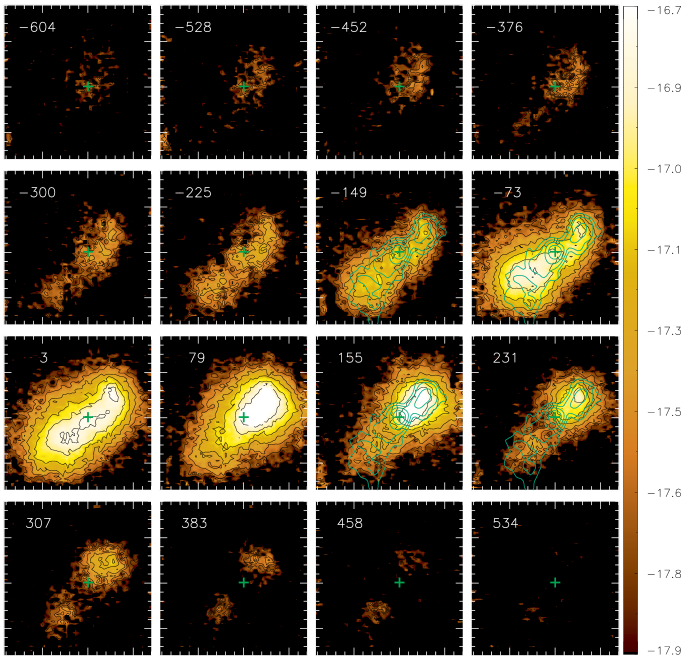
Figure 9 presents the velocity channels for the Pa emission line. The highest Pa velocities – blueshifts of 350 and redshifts of 320 – are smaller than those observed for [Fe ii]. At the highest blueshifts the emission is dominated by the nucleus, showing fainter emission from the north-west and south-east sides, while most of the redshifts are due to emission from the north-west side of the galaxy. From blueshifts of 100 to redshifts of 100 the peak of the emission shifts from the south-east to the north-west of the nucleus along the galaxy major axis, suggesting rotation.
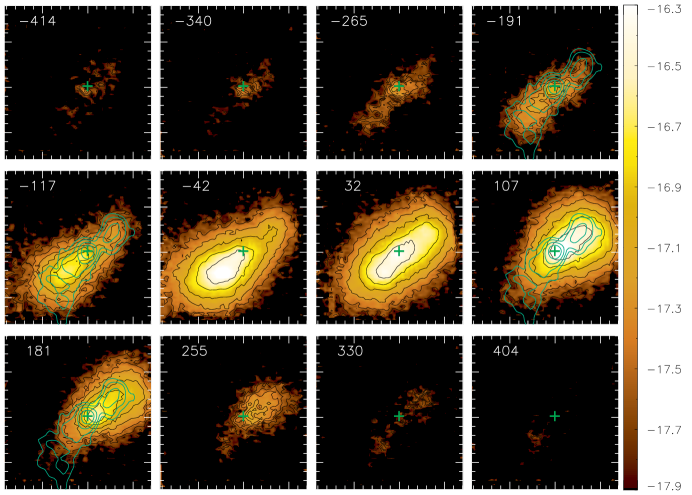
The velocity channel maps for the H2m emission line are shown in Figure 10 for velocity bins of 60 , corresponding to two spectral pixels. The pattern here is somewhat distinct from those observed for [Fe ii] and Pa. The H2 emission is more uniformly distributed over the whole IFU field, being less “collimated” along the radio axis, with blueshifts observed mostly to the south-east and redshifts to the north-west. This is what is expected if the velocity field is dominated by rotation similar to that of the stars. Nevertheless, it can be noticed that the velocity fields are not symmetric relative to the galaxy major axis (what should be the case for pure rotation). For example, in the blueshifted channels centred at and the flux distribution curves towards the north, while in the redshifted channels centred at 81 and 142 the flux distribution suggest some curvature to the south. These regions are marked with arrows in Figure 10.
The [P ii]1.1886 m velocity-channel maps are similar to those for [Fe ii], but are much noisier and are thus not shown here.
4 Discussion
4.1 Stellar kinematics
As can be observed in Fig. 2, the stellar velocity field presents a rotation pattern, and in order to obtain the systemic velocity, orientation of the line of nodes and an estimate for the bulge mass of Mrk 1066 we have fitted the stellar velocities with a model of circular orbits in a plane subject to a Plummer gravitational potential, given by
| (3) |
where is a scale length, is the distance from the nucleus in the plane of the galaxy, is the mass inside and is the Newton’s gravitational constant. Although this model is very simple, it has approximately reproduced the stellar velocities in the central regions of other Seyfert galaxies in previous studies (Barbosa et al., 2006; Riffel et al., 2008).
Following Barbosa et al. (2006), defining the coordinates of the kinematical centre as () relative to the photometric nucleus, the observed centroid velocity at position (), where is the projected distance from the nucleus in the plane of the sky and is the corresponding position angle, can be expressed as
| (4) |
where is the systemic velocity, is the inclination of the disc ( for a face on disc) and is the position angle of the line of nodes. The relations between and , and between and are: and , where .
The equation above contains six free parameters, including the kinematical centre, which can be determined by fitting the model to the observed velocity field. This was done using a Levenberg-Marquardt least-squares fitting algorithm, in which initial guesses are given for the free parameters. In the fitting we considered a typical uncertainty in the observed velocity of 6 .
The parameters derived from the fit are: the systemic velocity corrected to the heliocentric reference frame 3587 9 km s-1, 128∘ 6∘, 2.70.3 109 M⊙, , and 238 15 pc. The derived kinematical centre is coincident with the adopted position for the nucleus (peak of the continuum emission) within the uncertainties, with 177 pc and =33 pc, considering that our spatial resolution is (FWHM) 015 (35 pc). The uncertainty in the parameters were obtained directly from the application of the Levenberg-Marquardt method, taking into account the uncertainty in the velocity.
The parameters derived from the stellar kinematics can be compared with those from previous works. The systemic velocity derived here is about 40 smaller than the one obtained by Bower et al. (1995) from optical emission lines and in agreement with the one derived by Knop et al. (2001) using near-IR emission lines. We consider our measurement of more robust than those from previous works as our observations have higher spatial resolution and was obtained from the stellar kinematics, which is a better tracer of the gravitational potential of the galaxy than the gas. The orientation of the line of nodes 128∘ is in reasonable agreement with the one obtained by Knop et al. (2001) – 120∘. The scale length and the bulge mass are similar to those obtained for the central region of other Seyfert galaxies using similar modeling (e.g. Barbosa et al., 2006). It should be noticed that is tightly coupled with the inclination () of the disc, since . Thus the uncertainties in and can be even higher than those quoted above due to this degeneracy. Nevertheless, the value obtained for the inclination of the disc is in reasonable agreement with the one obtained by Bower et al. (1995), .
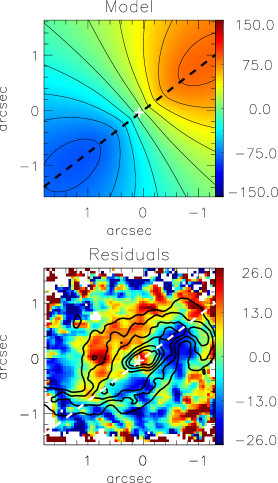
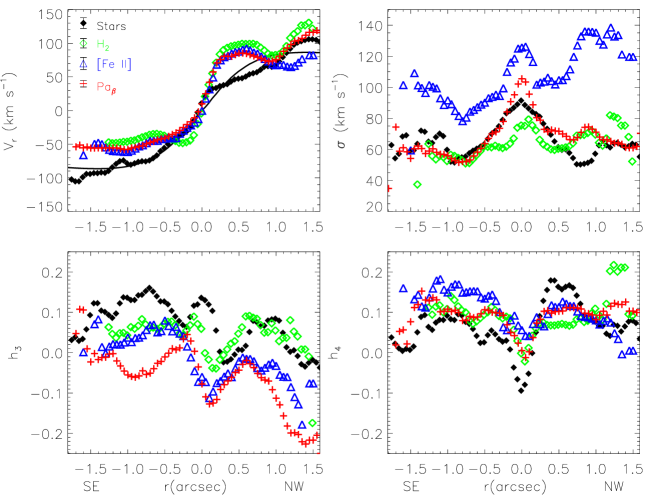
In figure 11 we show the best fit model for the stellar velocity field (top panel) and the residual map, obtained from the subtraction of the model from the observed velocities. A comparison between the modeled and the observed velocities is also shown in the top-left panel of Fig. 12, where we present one-dimensional cuts for the velocities along the line of nodes, averaged within a pseudo-slit 025 wide. The bottom panel of figure 11 shows that the residuals between the observed and modeled stellar velocity fields are usually smaller than 20 ( 15% of the maximum velocity amplitude of the rotation curve), but present a systematic behaviour. These systematic residuals – blueshifts to the south-west of the major axis and redshifts to the north-east in the inner arc second radius – seem to correlate with the oval seen in the HST F606W optical image, as shown by the corresponding superimposed contours. A signature of the effect of this oval is already present in Fig. 2, where the “zero-velocity curve” shown shows an S shape, a known signature of the presence of a non-axisymetric structure in the gravitational potential, which is not present in the model stellar velocity field of Fig. 11 which shows straight isovelocity lines for velocities close to zero (along the kinematic minor axis). Emsellem et al. (2006) have found a similar S-shaped structure in the stellar velocity field of the Seyfert galaxy NGC 1068, attributed to the presence of a nuclear bar. In the case of Mrk 1066, we attribute the distortions to the nuclear oval seen in the the HST image from which spiral arms seem to originate along PA=128∘ (see Paper I).
This oval is also seen in the stellar velocity dispersion map (top left panel of Fig. 2), in the form of a partial circumnuclear ring of low values with , at a distance of from the nucleus, immersed in a background with values of . This partial ring is also observed in the one-dimensional cut of the map shown in the top-right panel of Fig. 12. Similar circumnuclear rings of low velocity dispersions have been reported for several other Seyfert galaxies (Barbosa et al., 2006; Riffel et al., 2008, 2009), interpreted as colder regions with more recent star formation than the underlying bulge. This interpretation is supported by a recent study of the stellar population of this region (Riffel et al., 2010), which shows a dominance of intermediate age ( yr) stars.
The map (bottom-right panel of Fig. 2) shows a ring of high values co-spatial with the ring of low values. Such enhancement (due to a velocity distribution which is narrower than a Gaussian for low velocities) can be attributed to the contribution of the youngest stars (the stars actually span a range of intermediate ages) in the ring, which have a colder kinematics than the surrounding bulge stars.
The mass of the super-massive black hole in the centre of Mrk 1066 can be estimated from the bulge stellar velocity dispersion using , where , and km s-1 (Tremaine et al., 2002). We adopt km s-1 as representative of the bulge, a value in good agreement with previous optical measurements (Nelson & Whittle, 1995), and obtain M⊙.
4.2 Gas kinematics
Although the gaseous velocity fields of Fig. 4 present also a similar rotation pattern to that observed for the stars, they are more disturbed, indicating that additional kinematic components – not dominated by the gravitational potential of the bulge – are present. Differences between the gas and stellar kinematics are also observed in the one-dimensional cuts along the major axis of the galaxy, shown in the top panels of Fig. 12. To south-east of the nucleus the gaseous velocities are redshifted by 30 relative to the stellar ones, while at 05 north-west they are redshifted by 40 . Some differences between the [Fe ii], H2 and Pa kinematics are also observed, in particular between 1′′ and 15 north-west from the nucleus, where the H2 and Pa velocities are similar to the stellar and the [Fe ii] velocities are blueshifted by 30 . A distinct kinematics for the H2, [Fe ii] and Pa is also supported by the maps (Fig. 5) and one-dimensional cuts (top-right panel of Fig. 12), which show that, at most locations, the H2 presents the smallest values, followed by Pa, with [Fe ii] presenting the highest values. Differences between the kinematics of the ionized and molecular gas are also observed in the and maps (Figs. 6 and 7, respectively), as well as in the channel maps (Figs. 8, 9, 10), which shows [Fe ii] emission at highest blue- and redshifts than H2, indicating that the H2 emission traces less disturbed gas than the [Fe ii] emission.
The above conclusion is supported by other recent works. Hicks et al. (2009) have studied the H2 kinematics from the inner 100 pc of a sample of 9 Seyfert galaxies using SINFONI IFU at the ESO Very Large Telescope (VLT) and concluded that it is dominated by rotation in a disc with typical radius of 30 pc and a comparable height. In previous studies by our group we have also found that while the [Fe ii] emitting gas has important kinematic components attributed to gas extending to high galactic latitudes and in interaction with a radio jet, the H2 kinematics is dominated by rotation in the galaxy disc (Rodríguez-Ardila, Riffel & Pastoriza, 2005; Riffel et al., 2006, 2008, 2009; Storchi-Bergmann et al., 1999, 2009).
We can compare our results with previously published near-IR (Knop et al., 2001) and optical (Bower et al., 1995) gas kinematics for Mrk 1066 using long-slit spectroscopy. Bower et al. (1995) present measurements of the centroid velocity and FWHM of the H, H, [O iii], [O i], [N ii], [S ii] emission lines along PA=134∘, obtained under a seeing of 09. All emission lines, with exception of the [O iii], present similar velocities which are consistent with our near-IR measurements. Nevertheless, our velocity field reveals much more details, which we attribute to our better spatial resolution. The [O iii] emission is blueshifted relative to the other emission lines to north-west of the nucleus and redshifted to south-east. The presence of this kinematic component in our data is suggested by our maps for [Fe ii] and Pa (bottom-left and top-right panels of Fig. 6) and one-dimensional cuts (bottom-left panel of Fig. 12), which show positive values (red wings) to south-east of the nucleus and negative values to north-west (blue wings). The presence of wings have also been observed by Knop et al. (2001) for the near-IR emission lines along PA=135∘ at a seeing of 07. Knop et al. (2001) suggested in addition that these wings are associated with the [O iii] kinematic component of Bower et al. (1995). In particular, at 1′′ north-west of the nucleus the [Fe ii] emission line is blueshifted by 30 relative to the other near-IR emission lines, suggesting that the [Fe ii] emitting gas has the kinematical component observed in [O iii]. In addition, both present higher velocity dispersions when compared to other optical and near-IR emission lines with peak values observed at 1′′ north-west of the nucleus, close to a radio hot spot. These results support the conclusion that at least part of the [Fe ii] emitting gas has the same kinematics of the [O iii] emitting gas.
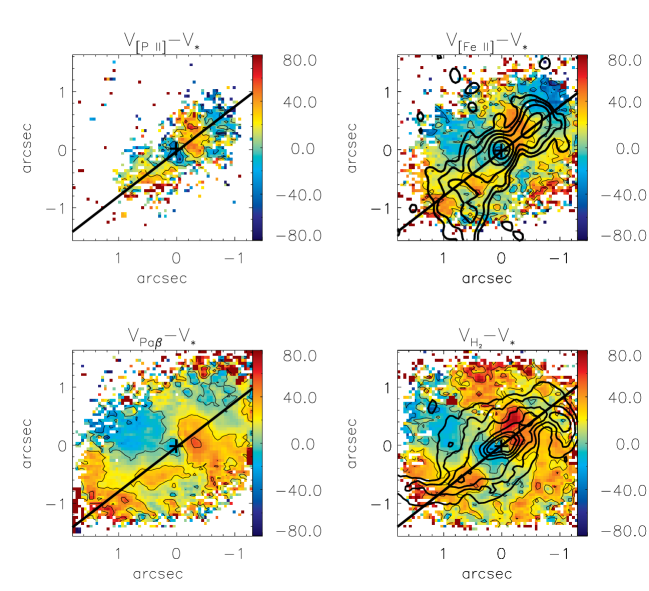
As our goal here is to look for non-circular motions in the gas, we have subtracted the stellar velocity field (which is dominated by circular rotation) from the gaseous ones, considering also that we could not fit a circular model to the gas kinematics, which is too much disturbed. Figure 13 shows the resulting maps for the the [P ii] (top-left panel), [Fe ii] (top-right), Pa (bottom-left) and H2 (bottom-right). Although these residual maps should be considered with caution, as the gas response to the gravitational potential differs from that of the stars (e.g. Combes et al., 1995), we have used them only as guides, together with the gas centroid velocity fields and channel maps (Figs. 4, 12, 8, 9 and 10) in order to look for non-circular velocity components. Considering all these maps, we tentatively identify the presence of two structures in the gas (besides the gas in similar rotation to that of the stars): (i) a compact disc with excess velocity relative to that of the stars of 40 within 04 from the nucleus, more clearly observed in the H2 residual map (bottom right panel of Fig. 13); (ii) an outflow identified by excess blueshifts of 50 at 13 to north-west of the nucleus, close to the edge of the radio jet, more clearly observed in the [Fe ii] and [P ii] residual maps (top left and right panels of Fig. 13). A similar structure in redshift is observed at 1′′ south-east of the nucleus. We now discuss the observational signatures of these two components – the compact disc and the outflow.
4.2.1 The compact disc
This structure is observed not only in the residual map, but also directly in the H2 velocity field (bottom-right panel of Fig. 4), which shows an abrupt increase in velocity between the nucleus and ( 70 pc), while the stellar rotation shows a much shallower increase in the rotation velocity, what can also be seen in the one-dimensional cuts of Figure 12. The presence of this disc in H2 is further supported by the low velocity dispersions (see Figs. 5 and 12), with values smaller than the stellar ones, observed closer to the nucleus in H2 than in the other emission lines.
Recent IFU observations of other Seyfert galaxies by other authors have also revealed the presence of circumnuclear H2 discs (Hicks et al., 2009). Following Hicks et al. (2009), we estimate the dynamical mass within the compact disc radius (70 pc) from its kinematics as:
| (5) |
where is the rotational velocity, is the observed velocity, is the gravitational constant. From Fig. 12 we observe that at 03 from the nucleus, the H2 65 (average of the values observed to north-west and to south-east of the nucleus) and 60, resulting in . Assuming a typical gas mass fraction of 10% (see Hicks et al. (2009) for a discussion about the observed mass fraction), we estimate that the gas mass in the disc is . This mass is about one order of magnitude larger than those obtained by Hicks et al. (2009) for a sample of 9 active galaxies, what can be due to the fact that the radius of the nuclear disc in Mrk 1066 is at least two times larger than those in Hicks et al. (2009). The mass derived above probably consists mostly of cold molecular gas since, as pointed out in Paper I, the mass of hot molecular gas (which emits in the near-IR) is about 104 times smaller than the dynamical mass obtained here. Radio observations indeed show the presence of large amounts of cold molecular gas with masses of 1010 in the inner hundred parsecs of active galaxies (e.g. García-Burillo et al., 2005; Boone et al., 2007; Krips et al., 2007).
Feeding of the compact disc
As pointed out in Section 3.3 the H2 channel maps (Fig. 10) are not symmetric with respect to the major axis in the blueshifted channels centred at and , where the flux distribution curves towards the north, and in the redshifted channels centred at 81 and 142 where there is a similar curvature to the south (see the arrows in Figure 10). In order to interpret these features, we now consider that the major axis of the galaxy is at PA=128∘, running from the bottom left to the upper right in the panels of Fig. 10, as shown by the white line. Under the assumption that the spiral arms (outlined by the contours of the HST image superposed in Fig. 2) are trailing, we conclude that the north-east is the far and the south-west is the near side of the galaxy. If the H2 emitting gas is in the galaxy plane, as suggested by its low velocity dispersion (bottom right panel of Fig. 5 and upper right panel in Fig.12) we suggest that the curves in the light distributions in the channels maps centred at and to the north-east, as well as in those centred at 81 and 142 to the south-west (see arrows) are due to inflows along spiral arms. We note that the same structures – resembling spiral arms – are observed also in the H2 velocity dispersion map (Fig. 5).

Morphological nuclear spiral arms can also be seen in the optical HST F606W image of Mrk 1066 (see Riffel, Storchi-Bergmann & Nagar, 2010). A structure map, obtained from this image using the technique of Pogge & Martini (2002) is shown in Fig. 14. The arrows in this map approximately trace dark spiral arms and correspond to the same location we have drawn them in the H2 channel maps. In the structure map, the dark spiral arms are due to dust. It is expected that the H2 is associated to dusty regions, where it is protected from strong radiation which may destroy the H2 molecule. This has been shown to be the case for NGC 1097 by Davies et al. (2009), who found velocity residuals in the H2 kinematics which were associated with dusty spirals (Prieto, Maciejewski & Reunanen, 2005), interpreted as inflows towards the nucleus. Inflows were also observed along these spirals in ionized gas by Fathi et al. (2006). Simões Lopes et al. (2007), using HST optical images for a matched sample of galaxies with and without AGNs, found that, for the early-type subsample, all AGN hosts have circumnuclear structures of gas and dust, while this is observed in only 26% of the inactive galaxies. In many cases, the dusty structures observed by Simões Lopes et al. (2007) resemble spiral arms, suggesting that they are the feeding channels of the AGN, as confirmed for a few cases in which the kinematics has been obtained.
Inflows along nuclear spirals have been predicted in numerical simulations by Maciejewski (2004a, b), who demonstrated that, if a central SMBH is present, spiral shocks can extend all the way to the vicinity of the SMBH and generate gas inflows consistent with the accretion rates inferred in local AGN. Martini & Pogge (1999) in their study of nuclear spirals in HST images have indeed concluded that they are not self-gravitating, being consistent with shocks in nuclear gas discs. Kinematical spiral arms have also been observed in the central region of other Seyfert galaxies (Fathi et al., 2006; Storchi-Bergmann et al., 2007; Riffel et al., 2008; Sánchez et al., 2009; van de Ven & Fathi, 2009; Davies et al., 2009). The modeling of the gaseous velocity field by a rotating disc plus spiral shocks shows that the gas is slowly streaming towards the nucleus with a typical mass inflow rate of 10-2–101 M⊙/yr (Davies et al., 2009; van de Ven & Fathi, 2009; Sánchez et al., 2009). Thus, the nuclear spiral arms seen in the H2 kinematics in Mrk 1066 could also be the feeding channels of its SMBH, or at least of the compact disc discussed above.
4.2.2 The outflowing gas
The top-right panel of Fig. 13 shows blueshifts in the [Fe ii] residual map of up to 80 at north-west of the nucleus, at the top edge of the radio jet. Similar residuals are observed for the [P ii], and somewhat smaller for Pa and H2 (Fig. 13). To the south-east the residual maps present similar redshifts in a region near the bottom edge of the radio jet. We interpret these residuals as due to an outflow and in particular from regions of interaction between the radio jet and the ambient gas. This interpretation is supported by (i) the residuals being observed close to the ends of the radio jet, as mentioned above; (ii) the fact that the [Fe ii] emitting gas presents increased velocity dispersion values in regions surrounding the radio structure. Such enhancements are expected when gas is disturbed by a radio jet (e.g. Dopita & Sutherland, 1995, 1999); (iii) The map (Fig. 6) for the [Fe ii] presents its most negative values, of 0.3, in a region co-spatial with the blueshifts observed in the residual map; (iv) The velocity channel maps of [Fe ii] are observed up to higher blueshifts and redshfits than those for Pa and H2. The flux distributions at these high velocities are well correlated with the radio structure. This behaviour is similar to that observed for the [O iii] emission (Bower et al., 1995), interpreted as originated in outflowing gas in a bi-conical structure with axis approximately coincident with the orientation of radio jet, while the lower excitation optical line emission is attributed to gas located in the plane of the galaxy.
The outflowing component is not more obvious in the near-IR because of the orientation of the outflow, which is close to the major axis of the galaxy, where the gas kinematics is dominated by rotation in the plane (as observed in the stellar velocity field of Fig. 2) and in the compact disc (Sec.4.2.1). The blueshifts described above represent a kinematic component which is superimposed on the galaxy rotation and on the compact disc component. The blueshifts at north-west and redshifts at similar distances to the south-east can be interpreted as originating in a bi-conical outflow which shares the [O iii] kinematics but is outshined by emission from the galaxy disc and from the compact nuclear disc in the inner regions.
The bi-conical outflow is better observed in the [Fe ii] channel maps (Fig. 8), which show the highest blueshifts (from to 500 ) to north-west of the nucleus and the highest redshifts observed to both sides of the nucleus. Comparing the channel maps with the [Fe ii] velocity field (Fig. 4) we conclude that the north-west blueshifts and south-east redshifts are due to outflows, as the galaxy rotation is in the opposite direction, showing blueshifts to the south-east and redshifts to the north-west. At intermediate velocities (80–220 ) both redshifts and blueshifts are observed to both sides of the nucleus confirming the presence of two velocity components: rotation and outflows. A similar behaviour is observed for the Pa channel maps. Lower velocity channels are consistent with emission from gas in the plane of the galaxy. The H2 channel maps are dominated by these lower velocities, supporting the interpretation that the H2 is located in the galaxy plane.
Under the assumption that part of the [Fe ii] emitting gas shares the [O iii] kinematics, we can estimate the opening angle of the cone directly from Fig. 13 as being . As the radio jet is oriented almost along the galaxy major axis, we can constrain the angle of the bi-cone axis relative to the plane of the sky as being close but somewhat larger than zero (), since the north-west side of the bi-cone must be oriented towards us (although apparently by a small angle) in order to produce excess blueshifts there while the south-east side of the bi-cone is directed away from us in order to produce the observed redshifts.
We now estimate the mass outflow rate across a circular cross section along the bicone located at 13 from the nucleus, which has a radius 023 pc for a bi-cone opening angle of 20∘, corresponding to an area of cm2. The component of the velocity of the outflowing gas along the bi-cone axis () is related to the observed velocity () by , where is the angle between the bi-cone axis and the plane of the sky, and thus the mass outflow rate can be obtained from
| (6) |
where the factor 2 is included in order to account for the outflows to both sides of the nucleus. Assuming , and , directly form Fig. 13, we obtain .
In order to estimate the value of , we consider the observation that the [O iii] image presents a collimated structure to north-west of the nucleus and a fainter emission to the south-east (Bower et al., 1995), suggesting that the bi-conical outflow makes a small angle with the plane of the sky, with the south-east side apparently obscured by the galaxy plane. A large angle would produce a less collimated emission.
In order to quantify the mass outflow rate, we assume . In this case the adopted geometry implies that the far wall of the north-west cone and the near wall of the south-east cone are exactly in the plane of the sky. With this value of we obtain .
The mass outflow rate obtained for Mrk 1066 can be compared with those obtained for other active galaxies. Veilleux, Cecil & Bland-Hawthorn (2005) report values of for warm ionized gas outflow from luminous active galaxies, while Barbosa et al. (2009) report from optical IFU observation of a sample of six Seyfert galaxies assuming and electron density of . Storchi-Bergmann et al. (2010) found from the nucleus of NGC 4151 using similar NIFS observations of its circumnuclear region, while Crenshaw & Kraemer (2007) obtained an outflow rate 6 times smaller using blueshifted absorption lines in the UV spectrum of NGC 4151. In Riffel et al. (2009) we estimated for the Seyfert 2 nucleus of NGC 7582 for the ionized gas using K-band IFU spectroscopy. The mass outflow rate estimated for Mrk 1066 is thus within the range of observed values for active galaxies, being 2 times smaller than the lowest ones obtained by Veilleux, Cecil & Bland-Hawthorn (2005), 30 times smaller than the one obtained for NGC 4151 (Storchi-Bergmann et al., 2010; Crenshaw & Kraemer, 2007), about 10 times larger than the values obtained by Barbosa et al. (2009) and similar to the outflow rate of NGC 7582 (Riffel et al., 2009).
4.2.3 Feeding vs feedback in Mrk 1066
Knop et al. (2001) – using long-slit spectroscopy – proposed that most of the near-IR line emission in Mrk 1066, as well as the optical lines of [N ii], [S ii], [O i] and H i, originate in a rotating disc in the plane of the galaxy with a major axis oriented along PA, while the wings of the near-IR emission lines and the optical [O iii] emission originate from the bi-conical outflow, as illustrated in their Fig. 8.
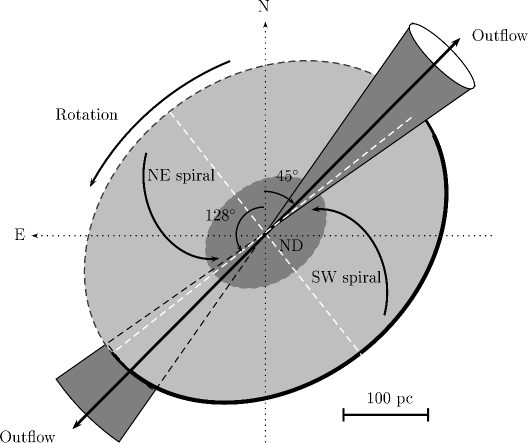
Our observations have 2D coverage, as well as higher spectral and spatial resolutions than those of Knop et al. (2001) and can be used to better constrain the orientation of the cone and major axis of the disc and we can thus further constrain the scenario proposed by Knop et al. (2001). In Fig. 15 we present a cartoon illustrating our proposed physical scenario for the circumnuclear region of Mrk 1066. This cartoon is inspired on Fig. 8 of Knop et al. (2001), in which the high ionization emission lines – such as the optical [O iii] lines – originate in outflowing gas along the bi-cone oriented along the radio axis (PA) and with an opening angle of .
In agreement with Knop et al. (2001), we support that the low-excitation line emission (from H2, H i, [Fe ii], [P ii], [N ii], [O i], [S ii]) is dominated by gas rotating in the galaxy disc, with similar kinematics to that of the stars: the line of nodes is oriented along and the disc inclination is relative to the plane of the sky. But we can also identify in the near-IR emission lines a kinematic component originating in the bi-conical outflow (which dominates the [O iii] emission), as evidenced by the blueshifts to north-west and redshifts to south-east of the nucleus in Fig. 13. The contribution of this component to the gas kinematics increases in importance from H2Pa[Fe ii]. This can also be observed in the channel maps: while the presence of outflows combined with rotation is clear in the [Fe ii] and Pa channel maps, the H2 channel maps seem to show only rotation. These kinematics suggest that part of the ionized gas extends to high galactic latitudes, where it contributes to the bi-conical outflow, while the molecular gas is mostly restricted to the galaxy plane.
This picture – in which the H2 originates mostly from the galaxy plane, while the ionized gas is observed also in outflows extending to high galactic latitudes – is in good agreement with results we have obtained for other Seyfert galaxies (e.g. Riffel et al., 2006, 2008, 2009; Storchi-Bergmann et al., 1999, 2009, 2010).
Another interesting new result is the observation of a compact nuclear disc, with radius 70 pc, which is rotating faster than the underlying stellar disc. We interpret this nuclear disc as a gaseous structure which will soon give origin to the formation of new stars. We are probably witnessing the formation of a nuclear stellar disc, such as those observed as low stellar velocity dispersion structures surrounding active galactic nuclei (Davies et al., 2007) or as high surface brightness structures in previous HST imaging studies (e.g. Simões Lopes et al., 2007; Pizzella et al., 2002). This compact disc is apparently being fed by molecular gas flowing along nuclear spirals, as evidenced by the blueshifts observed at the far side of the galaxy and redshifts in the near side (Fig. 10) similarly to what we have observed in the Seyfert galaxy NGC 4051 (Riffel et al., 2008).
Finally, we now compare the outflow mass rate, obtained in Sec.4.2.2, with the accretion rate necessary to power the AGN at the nucleus of Mrk 1066.
The mass accretion rate to feed the active nucleus can be obtained from
| (7) |
where is the nuclear bolometric luminosity, is the efficiency of conversion of the rest mass energy of the accreted material into radiation and is the light speed. The bolometric luminosity can be approximated by , where is the H nuclear luminosity (e.g. Ho, 1999; Ho et al., 2001). The Br nuclear flux measured for an circular aperture with 025 radius is . In Paper I, we obtained a reddening of for the nucleus of Mrk 1066 using the Br/Pa line ratio. Correcting the Br flux for this reddening using the law of Cardelli, Clayton & Mathis (1989), we obtain . Assuming a temperature K and an electron density , the ratio between H and Br is predicted to be (Osterbrock & Ferland, 2006). Thus for a distance to Mrk 1066 of Mpc and the nuclear bolometric luminosity is estimated to be . Assuming , which is a typical value for a “standard” geometrically thin, optically thick accretion disc (e.g. Frank, King & Raine, 2002), we obtain a mass inflow rate of .
The mass outflow rate () in the NLR is about one order of magnitude larger than , a ratio comparable to those observed for other Seyfert galaxies (Barbosa et al., 2009; Riffel et al., 2009; Storchi-Bergmann et al., 2010), which indicates that most of the outflowing gas in the NLR of active galaxies does not originate in the AGN but in the surrounding interstellar medium from the galaxy plane, which is pushed away by the nuclear outflow.
5 Summary and Conclusions
We used integral field J and Kl bands spectroscopy from the inner 350 pc radius of the Seyfert galaxy Mrk 1066, obtained with the Gemini NIFS at a spatial resolution of 35 pc and spectral resolution of 40 , to map the gaseous and stellar kinematics. Our main conclusions are:
-
•
The stellar velocity field is dominated by circular rotation in the plane of the galaxy, but shows an S-shape distortion along the galaxy minor axis which we attribute to the presence of an oval structure in the galactic potential.
-
•
The oval structure is also delineated by a partial ring of low velocity dispersion (50 ) at 230 pc from the nucleus, which is due to intermediate-age stars immersed in the old bulge, as concluded from stellar population synthesis (Riffel et al., 2010).
-
•
The bulge velocity dispersion is , implying in a black hole mass of M⊙.
-
•
The gaseous kinematics shows circular rotation similar to that of the stars with two additional kinematic components: (i) a compact nuclear disc, more clearly observed in H2 emission, with radius pc and gas mass of ; (ii) outflows associated with the radio jet, presenting a mass outflow rate of , more clearly observed in [Fe ii] emission.
-
•
The compact H2 nuclear disc presents the smallest gas values ( 70 ), consistent with an origin in the galaxy plane and is apparently being fed via nuclear spiral arms, observed in molecular gas at similar velocity dispersion to that of the compact disc. This disc may not only be the feeding source of the AGN but probably will be consumed in star formation, leading to the formation of a nuclear stellar disc, a structure frequently observed in galaxy bulges.
-
•
The [Fe ii] emission presents the largest values (up to 150 ) and the highest blue- and redshifts, of up to 500 , while the highest stellar rotation velocity is only 130 . The high velocities and velocity dispersions are found at the tip and around the radio jet, which is oriented approximately along the galaxy major axis, with the north-west side slightly tilted towards us. The outflow rate is about one order of magnitude higher than the accretion rate, indicating that most of the outflow consists of entrained gas from the galaxy plane by a nuclear outflow.
Acknowledgments
We thank the referee for valuable suggestions which helped to improve the present paper, as well as Dr. Neil M. Nagar for sending the radio continuum image. This work is based on observations obtained at the Gemini Observatory, which is operated by the Association of Universities for Research in Astronomy, Inc., under a cooperative agreement with the NSF on behalf of the Gemini partnership: the National Science Foundation (United States), the Science and Technology Facilities Council (United Kingdom), the National Research Council (Canada), CONICYT (Chile), the Australian Research Council (Australia), Ministério da Ciência e Tecnologia (Brazil) and south-eastCYT (Argentina). This research has made use of the NASA/IPAC Extragalactic Database (NED) which is operated by the Jet Propulsion Laboratory, California Institute of Technology, under contract with the National Aeronautics and Space Administration. This work has been partially supported by the Brazilian institution CNPq.
References
- Barbosa et al. (2006) Barbosa, F. K. B., Storchi-Bergmann, T., Cid Fernandes, R., Winge, C., & Schmitt, H. 2006, MNRAS, 371, 170.
- Barbosa et al. (2009) Barbosa, F. K. B., Storchi-Bergmann, T., Cid Fernandes, R., Winge, C., Schmitt, H., 2009, MNRAS, 396, 2.
- Boone et al. (2007) Boone, F., Baker, A. J., Schinnerer, E., Combes, F., García-Burillo, S., Neri, R., Hunt, L. K., Léon, S., Krips, M., Tacconi, L. J., & Eckart, A., 2007, A&A, 471, 113.
- Bower et al. (1995) Bower, G., Wilson, A., Morse, J. A., Gelderman, R., Whitle, M., & Mulchaey, J., 1995, ApJ, 454, 106.
- Cappellari & Emsellem (2004) Cappellari, M., Emsellem, E. 2004, PASP, 116, 138.
- Cardelli, Clayton & Mathis (1989) Cardelli,J. A., Clayton, G. C. & Mathis, J. S., 1989, ApJ, 345,245.
- Crenshaw & Kraemer (2007) Crenshaw, D. M., & Kraemer, S. B. 2007, ApJ, 659, 250.
- Combes et al. (1995) Combes, F., Boissé, P., Mazure, A. & Blanchard, A., 1995, Galaxies and Cosmology, Springer-Verlag, Berlin, Germany.
- Dale et al. (2005) Dale, D. A., Sheth, K., Helou, G., Regan, M. W., & Hüttemeister, S., 2005, ApJ, 129, 2197.
- Davies et al. (2005) Davies, R. I., I., Sternberg, A., Lehnert, M. D., & Tacconi-Garman, L. E., 2005, ApJ, 633, 105.
- Davies et al. (2007) Davies, R. I., Sánchez, F. M., Genzel, R., Tacconi, L. J., Hicks, E. K. S., Friedrich, S., & Sternberg, A. ApJ, 671, 1388
- Davies et al. (2009) Davies, R. I., Maciejewski, W., Hicks, E. K. S., Tacconi, L. J., Genzel, R., & Engel, H. 2009, ApJ, 702, 114.
- Dopita & Sutherland (1995) Dopita, M. A., & Sutherland, R. S. 1995, ApJ, 455, 468.
- Dopita & Sutherland (1999) Dopita, M. A., & Sutherland, R. S. 1996, ApJS, 102, 161.
- Emsellem et al. (2006) Emsellem, E., Fathi, K., Wozniak, H., Ferruit, P., Mundell, C. G., Schinnerer, E. 2006, MNRAS, 365, 367.
- Fathi et al. (2006) Fathi, K., Storchi-Bergmann, T., Riffel, R. A., Winge, C., Axon, D. J., Robinson, A., Capetti, A., & Marconi, A., 2006, ApJl, 641, L25.
- Frank, King & Raine (2002) Frank, J., King, A. R., & Raine, D. J. 2002, Accretion Power in Astrophysics (3rd ed.; Cambridge: Cambridge Univ. Press)
- García-Burillo et al. (2005) Garcia-Burillo, S., Combes, F., Schinnerer, E., Boone, F., & Hunt, L. K., 2005, A&A, 441, 1011.
- García-Burillo et al. (2009) Garcia-Burillo, S. et al. 2009, A&A, 496 ,85.
- Gerhard (1993) Gerhard , O. E., 1993, MNRAS, 265, 213.
- Hicks et al. (2009) Hicks, E. K. S., Davies, R. I., Malkan, M. A., Genzel, R., Tacconi, L. J.; Sánchez, F. M., Sternberg, A., 2009, ApJ, 696, 448.
- Ho (1999) Ho, L. C. 1999, ApJ, 516, 672.
- Ho et al. (2001) Ho, L. C., et al. 2001, ApJ, 549, L51
- Hunt & Malkan (2004) Hunt, L. K. & Malkan, M. A., 2004, ApJ, 616, 707.
- Knop et al. (2001) Knop, R. A., Armus, L., Matthews, K., Murphy, T. W., & Soifer, B. T., 2001, ApJ, 122, 764.
- Krips et al. (2007) Krips, M., Neri, R., García-Burillo, S., Combes, F., Schinnerer, E., Baker, A. J., Eckart, A., Boone, F., Hunt, L., Leon, S., & Tacconi, L. J., 2007, A&A, 468, 63.
- Maciejewski (2004a) Maciejewski, W. 2004a, MNRAS, 354, 883.
- Maciejewski (2004b) Maciejewski, W. 2004b, MNRAS, 354, 892
- Martini & Pogge (1999) Martini, P., & Pogge, R. W., 1999, AJ, 118, 2646.
- McGregor et al. (2003) McGregor, P. J. et al., 2003, Proceedings of the SPIE, 4841, 1581.
- Nagar et al. (1999) Nagar, N. M., Wilson, A. S., Mulchaey, J. S. & Gallimore, J. F., 1999, ApJS, 120, 209.
- Nelson & Whittle (1995) Nelson, C. H., & Whittle, M., 1995, ApJS, 465, 96.
- Osterbrock & Ferland (2006) Osterbrock, D. E. & Ferland, G. J., 2006, Astrophysics of Gaseous Nebulae and Active Galactic Nuclei, Second Edition, University Science Books, Mill Valley, California.
- Pizzella et al. (2002) Pizzella, A., Corsini, E. M., Morelli, L., Sarzi, M., Scarlata, C., Stiavelli, M., & Bertola, F., 2002, ApJ, 373, 131.
- Pogge & Martini (2002) Pogge, R. W., & Martini, P. 2002, ApJ, 569, 624.
- Prieto, Maciejewski & Reunanen (2005) Prieto, M. A., Maciejewski, W., & Reunanen, J. 2005, AJ, 130, 1472.
- Rodríguez-Ardila, Riffel & Pastoriza (2005) Rodríguez-Ardila, A., Riffel, R., & Pastoriza, M. G. 2005, MNRAS, 364, 1041.
- Riffel et al. (2006) Riffel, Rogemar A., Sorchi-Bergmann, T., Winge, C., Barbosa, F. K. B., 2006, MNRAS, 373, 2.
- Riffel et al. (2008) Riffel, Rogemar A., Storchi-Bergmann, T., Winge, C., McGregor, P. J., Beck, T., Schmitt, H. 2008, MNRAS, 385, 1129.
- Riffel et al. (2009) Riffel, Rogemar A., Storchi-Bergmann, T., Dors, O. L., Winge, C., 2009a, MNRAS, 393, 783.
- Riffel, Storchi-Bergmann & Nagar (2010) Riffel, Rogemar A., Storchi-Bergmann, T., & Nagar, N. M., 2010, MNRAS, 404, 166. (Paper I)
- Riffel et al. (2010) Riffel, Rogemar A., Storchi-Bergmann, T., Riffel, R., & Pastoriza, M. G., 2010, ApJ, 713, 469.
- Riffel (2010) Riffel, Rogemar A., 2010, accepted by Ap&SS, tmp75, arXiv:1002.1585
- Sánchez et al. (2009) Sánchez, F. M., Davies, R. I., Genzel, R., Tacconi, L. J., Eisenhauer, F., Hicks, E. K. S., Friedrich, S., & Sternberg, A., 2009, ApJ, 691, 749.
- Simões Lopes et al. (2007) Simões Lopes, R. D., Storchi-Bergmann, T., de Fátima Saraiva, M., & Martini, P., 2007, ApJ, 655, 718.
- Shlosman, Begelman & Frank (1990) Shlosman, I., Begelman, M. C., Frank, J. 1990, Nature, 345, 679.
- Stoklasová et al (2009) Stoklasová, I., Ferruit, P., Emssellem, E., Jungwiert, B., Pécontal, E., & Sánchez, S. F., 2009, A&A, 500, 1287.
- Storchi-Bergmann et al. (1999) Storchi-Bergmann, T., Winge, C., Ward, M. J., Wilson, A. S., 1999, MNRAS, 304, 35.
- Storchi-Bergmann et al. (2007) Storchi-Bergmann, T., Dors Jr., O., Riffel, R. A., Fathi, K., Axon, D. J., & Robinson, A., 2007, ApJ, x, x.
- Storchi-Bergmann et al. (2009) Storchi-Bergmann, T., McGregor, P. Riffel,Rogemar A., Simões Lopes, R., Beck, T., Dopita, M., 2009, MNRAS, 394, 1148.
- Storchi-Bergmann et al. (2010) Storchi-Bergmann, T., Simões Lopes, R., McGregor, P. Riffel,Rogemar A., Beck, T., Dopita, M., 2010, MNRAS, tmp1898S.
- Tremaine et al. (2002) Tremaine, S., Gebhardt, K., Bender, R., Bower, G., Dressler, A., Faber, S. M., Filippenko, A. V., Green, R., Grillmair, C., Ho, L. C., Kormendy, J., Lauer, T. R., Magorrian, J., Pinkney, J., & Richstone, D., 2002, ApJ, 574, 740.
- Ulvestad & Wilson (1989) Ulvestad, J. S., & Wilson, A. S., 1989, ApJ, 343, 659.
- van der Marel & Franx (1993) van der Marel, R.P. & Franx, M. 1993, ApJ, 407, 525
- van de Ven & Fathi (2009) van de Ven, G., & Fathi, K., 2009, arXiv:0905.3556v1
- Veilleux, Cecil & Bland-Hawthorn (2005) Veilleux, S., Cecil, G., & Bland-Hawthorn, J. 2005, ARA&A, 43, 769.
- Winge, Riffel & Storchi-Bergmann (2009) Winge, C., Riffel, Rogemar A., Storchi-Bergmann, T., 2009, ApJS, 185, 186.