Type II and IV radio bursts in the active period October-November 2003
Abstract
In this report we present the Type II and IV radio bursts observed and analyzed by the radio spectrograph ARTEMIS IV111Appareil de Routine pour le Traitement et l’ Enregistrement Magnetique de l’ Information Spectral, in the 650-20MHz frequency range, during the active period October-November 2003. These bursts exhibit very rich fine structures such fibers, pulsations and zebra patterns which is associated with certain characteristics of the associated solar flares and CMEs.
1 Introduction
The active period from 20 October to 5 November 2003 has attracted considerable attention (Chertok , Kiener , Mitsakou , Tan , Gopalswamy , Vrsnak , Wang ) because of its abundance in of powerful flares and large coronal mass ejections (CMEs) as well as by strong space weather disturbances. This activity was associated with the appearance of a global complex consisting of three large, remote but connected active regions (AR): AR 484 (Carrington coordinates, N04; L = 354), AR 486 (S15; L = 283) and AR 488 (N08; L = 291) (cf. Chertok ); while in the visible hemisphere of the sun, this complex, produced 8 X–class and 12 M–class flares.
The Artemis IV solar radio-spectrograph operating at Thermopylae since 1996 (Caroubalos01a ) consists of a 7–m parabolic antenna covering the metric range, to which a dipole antenna was added recently in order to cover the decametric range (Caroubalos06 , Kontogeorgos ). Two receivers operate in parallel, a sweep frequency analyser (ASG) covering the 650–20 MHz range in 630 data channels with a cadence of 10 samples/sec and a high sensitivity multichannel acousto–optical analyser (SAO), which covers the 270–450 MHz range in 128 channels with a high time resolution of 100 samples/sec.
In October–November 2003 ARTEMIS-IV observed six major events on October 23 (08:24 UT), October 25 (05:20 UT), October 26 (06:16 UT), October 28 (11:02 UT), November 2 (a behind–the–limb event, 09:20 UT) and November 3 (09:49); Combined with data from WIND–WAVES (Bougeret ), these observations provide a complete view of the radio emission induced by shock waves and electron beams from the low corona to about 1 A.U. Out of those, we selected three events to give an overview here.
2 Selected Events Description
2.1 Event Overview
2.1.1 The event of October 26, 2003
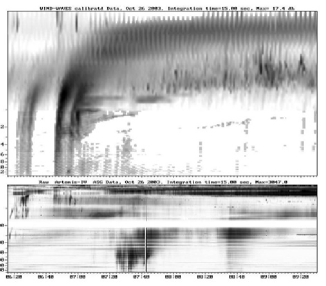
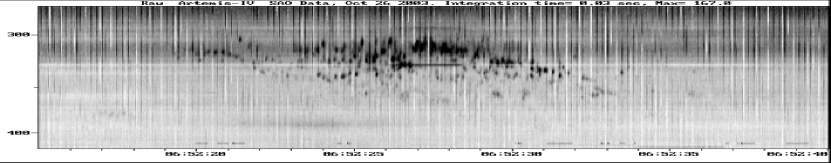
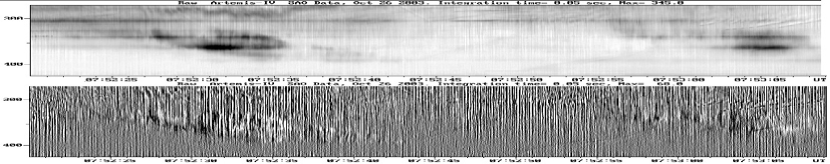
A type II with fundamental–harmonic emission, starts at 06:16 followed by high frequency type IV emission starting at 06:20 (high frequencies) and 06:44 (low frequencies); follows high frequency continuum emission at 07:20 and at 08:35 UT, with considerable fine structure (cf. figure 1).
2.1.2 The event of October 28, 2003
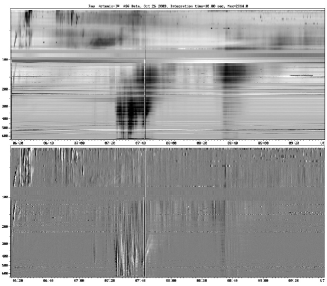
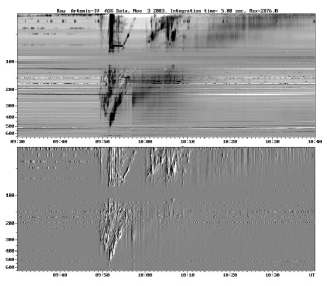
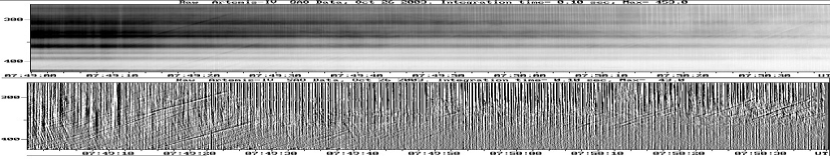
The events start with a type II burst starting at 10:47 in ARTEMIS–IV lower frequencies, and extending into the WIND–WAVES range. Follows a complex event, comprising an intense type III group, a type II with fundamental–harmonic structure followed by a type IV continuum; all extend into the WIND–WAVES range. (cf. figure 2)
2.1.3 The event of November 3, 2003
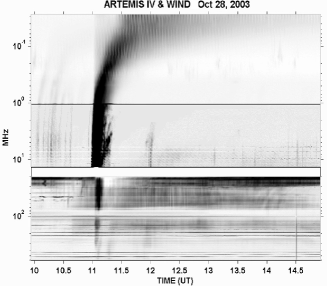
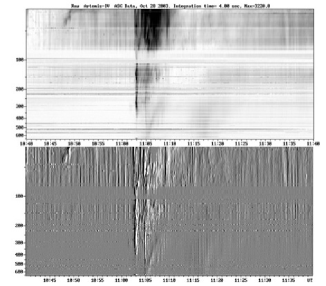
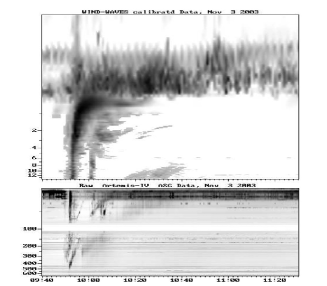
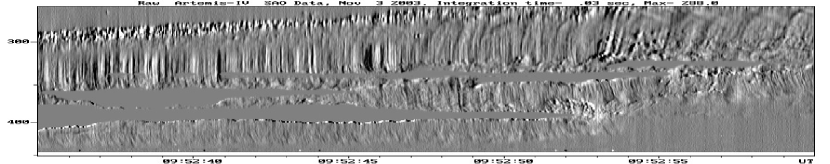
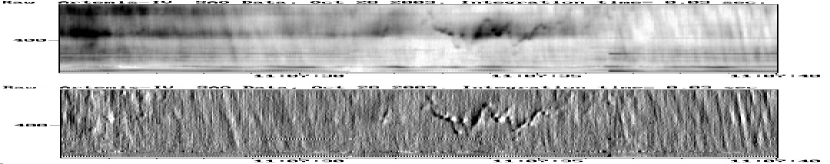
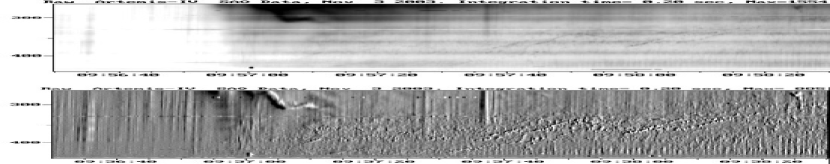
The events starts at 09:49 UT with weak type III bursts, followed by a very strong type III group extending down to 150 kHz. Follows a type II, displaying fundamental–harmonic structure. There is an indication of multiple shocks since three lanes appear on the spectra; firstly a fast type II, probably fundamental, followed by the fundamental-harmonic pair; these shocks were associated with a coronal wave by Vrsnak . The event extends into the high frequency part of the WIND–WAVES spectrum, down to about 9 MHz. A type IV continuum follows the type II, also extending into the WIND–WAVES band range (cf. figure 3 upper panels).
The SAO recordings of the type II harmonic, with high resolution, exhibit herringbone structure, resulting from type III–like emissions due to electron populations accelerated by the MHD shock. In this recordings however the spectral shape of the herringbone is type U–like, thus indicating the presence of some type of magnetic confinement for the exciter (cf. figure 3 lower panels).
2.2 Fine Structure
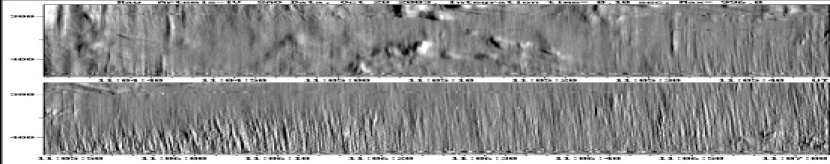
The high sensitivity and time resolution of the SAO facilitated an examination on fine structure within the three studied periods; all exhibited rich fine structure embedded in the Type–IV continua. In our analysis, the continuum background is removed by the use of high–pass filtering on the dynamic spectra (differential spectra in this case).
We present certain examples, which are divided according to a published morphological classification scheme (Jiricka ) based on Ondrejov Radiospectrograph recordings in the 0.8–2.0 GHz range. In our recordings we have detected narrow band spikes (figure 4), Slowly Drifting Bursts (figure 5), fibers (figures 5,6), Narrowband Type III Bursts (figure 8), laces (figure 7), zebra patterns (figure 8), and isolated broadband pulses (figure 9). An EEL type emission (Chernov ) was found to border a pulsating structure (figure 9).
3 DISCUSSION & CONCLUSIONS
The ARTEMIS–IV radio–spectrograph, operating in the range of 650–20 MHz, observed 6 complex events during the super–active period of October–November 2003; three of them were presented here. WIND-WAVES data complement nicely the ARTEMIS data and trace the radio emission from the middle corona all the way to almost 1 A.U. The high resolution SAO recordings on the other hand reveal a variety of fine structure which, almost, matches the comprehensive Ondrejov Catalogue (Jiricka ). This last, although it refers to the spectral range 0.8–2 GHz, seems to produce similar fine structure with the metric range.
Further analysis of the metric radio bursts fine structure is in progress.
This work was supported in part by the Greek Secretariat for Research and Technology through the program Pythagoras II. The LASCO CME catalogue is generated and maintained by the Center for Solar Physics and Space Weather, The Catholic University of America in cooperation with the Naval Research Laboratory and NASA. SOHO is a project of international cooperation between ESA and NASA. The Solar Geophysical Data Catalogue is compiled and maintained by the US Department of Commerce.
References
- [1] J. L. Bougeret, M. L., Kaiser, P. J., Kellogg, R., Manning, K., Goetz, S. J., Monson, N., Monge, L., Friel, C. A., Meetre, C., Perche, L., Sitruk, S., Hoang, Space Science Reviews, 71, 231–263, (1995).
- [2] C., Caroubalos, D., Maroulis, N., Patavalis, J. L., Bougeret, G., Dumas, C., Perche, C., Alissandrakis, A., Hillaris, X., Moussas, P., Preka–Papadema, A., Kontogeorgos, P., Tsitsipis, P., and G., Kanellakis, Experimental Astronomy, 11,23–32, (2001).
- [3] C., Caroubalos, C. E., Alissandrakis, A., Hillaris, P., Preka–Papadema, J., Polygiannakis, X., Moussas, P., Tsitsipis, A., Kontogeorgos, V., Petoussis, C., Bouratzis, J. L., Bougeret, G., Dumas and A., Nindos, These Proceedings (2006).
- [4] G.P. Chernov, A.K. Markeev, M. Poquerusse, J.L. Bougeret, K.-L. Klein, G. Mann, H. Aurass, and M.J. Aschwanden, Astron. Astrophys., 334, 314 324, (1998)
- [5] I. M., Chertok, V. V., Fomichev, A. A., Gnezdilov, R. V. Gorgutsa, A. K., Markeev & D. E., Sobolev, Astronomical and Astrophysical Transactions, 24, 45-52, (2005).
- [6] N., Gopalswamy, L., Barbieri, E. W., Cliver, G., Lu, S. P., Plunkett, R. M., Skoug, Solar Physics, 226, 337–357, (2005).
- [7] K., Jiricka, M., Karlicky, H., Meszarosova and V., Snizek, Astronomy and Astrophysics, 375, 243-250, (2001)
- [8] J., Kiener, M., Gros, V., Tatischeff, and G. Weidenspointner, Astronomy and Astrophysics, 445, 725–733 (2006)
- [9] . Kontogeorgos, P. Tsitsipis, C. Caroubalos, X. Moussas, P. Preka-Papadema, A. Hillaris, V. Petousis, J-L Bougeret, C.E. Alissandrakis, G. Dumas, J. Polygiannakis, 13th International Symposium on Measurements for Research and Industry Applications, Athens 29 Sept.-1 Oct., 39–44, 2004.
- [10] E. Mitsakou, M. Thanasa , P. Preka–Papadema X. Moussas, A. Hillaris, C. Caroubalos, C. E. Alissandrakis P. Tsitsipis, A. Kontogeorgos, J. L. Bougeret, G. Dumas, These Proceedings (2006).
- [11] Cheng-Ming Tan, Qi-Jun Fu, Yi-Hua Yan and Yu-Ying Liu, Chin. J. Astron. Astrophys, 4, 205-208, (2004).
- [12] B., Vrsnak, A., Warmuth, M., Temmer, A., Veronig, J., Magdalenic, A., Hillaris, M., Karlicky., Astronomy and Astrophysics, (accepted) (2006).
- [13] Wang Yuming, Ye Pinzhong, Zhou Guiping, Wang Shujuan, S., Wang, Yan Yihua, Wang Jingxiu, Solar Physics, 226, 337-357, (2005).
- [14] S., Yashiro, N., Gopalswamy, O. C., St. Cyr, G., Lawrence, G., Michalek, C. A., Young, S. P., Plunkett, & R. A., Howard, AGU Spring Meeting Abstract SH31C-10, 2001