The Arecibo Galaxy Environment Survey III: observations toward the galaxy pair NGC 7332/7339 and the isolated galaxy NGC 1156.
Abstract
Two 5 square degree regions around the NGC 7332/9 galaxy pair and the isolated galaxy NGC 1156 have been mapped in the 21-cm line of neutral hydrogen (H i) with the Arecibo L-band Feed Array out to a redshift of ( km s-1) as part of the Arecibo Galaxy Environment Survey. One of the aims of this survey is to investigate the environment of galaxies by identifying dwarf companions and interaction remnants; both of these areas provide the potential for such discoveries. The neutral hydrogen observations were complemented by optical and radio follow-up observations with a number of telescopes. A total of 87 galaxies were found, of which 39 (45 per cent) were previously cataloged and 15 (17 per cent) have prior redshifts. Two dwarf galaxies have been discovered in the NGC 7332 group and a single dwarf galaxy in the vicinity NGC 1156 . A parallel optical search of the area revealed one further possible dwarf galaxy near NGC 7332.
Subject headings:
galaxies: individual (NGC 7332) – galaxies: individual (NGC 7339) – galaxies: individual (NGC 1156) – radio lines: galaxies – surveys1. Introduction
The NGC 7332 and NGC 1156 regions are the first two completely surveyed areas from the Arecibo Galaxy Environment Survey (AGES). The survey aims to address a number of scientific goals, including the H i mass function in different environments, the contribution of neutral gas to the baryonic mass density, the identification of gaseous tidal features, and the identification of isolated neutral gas clouds. In order to do this, AGES is investigating galaxies in a number of different environments, from the Local Void through to the Virgo Cluster. These environments include three isolated galaxies (NGC 1156, described here, UGC 2082, and NGC 5233) and two galaxy pairs (NGC 7332/9, described here, and NGC 2577/UGC 4375). A full description of the aims of the survey, which is expected to be concluded in around four to five years, can be found in Auld et al. (2006) and on the AGES website111http://www.naic.edu/~ages.
1.1. The NGC 7332 region
NGC 7332 and NGC 7339 form a close pair (5.2 arc minutes separation) with velocities of 1172 and 1313 km s-1 respectively. They lie at a distance of 23 Mpc (Tonry et al. 2001, from surface-brightness fluctuations), giving a projected separation of 35 kpc. We adopt the Tonry et al. distance throughout this paper and convert masses and fluxes from the literature to this distance.
NGC 7332 itself is an S0 galaxy; whether or not it contains neutral hydrogen has been debated in the literature for many years. Knapp, Kerr & Williams (1978), using Arecibo with the circular-polarised L-band feed (FWHM arcmin), claimed a detection with an H i mass . Biermann, Clarke & Fricke (1979), using the same receiver, also see this signal but attribute it to side-lobe contamination from NGC 7339. Haynes (1981) and Burstein, Krumm & Salpeter (1987) both observed the galaxy using Arecibo with the linear-polarised L-band feed (FWHM arcmin), which had significantly lower side-lobes than the circular-polarised feed but also less sensitivity (6 K Jy-1 versus 8 K Jy-1), and Balkowski & Chamaraux (1983) observed it with the Nançay Radio Telescope (FWHM arcmin). None of these observations had the sensitivity to detect the signal seen by Knapp et al., although Haynes (1983) discusses the Knapp et al. detection and attributes it to side-lobes.
Ionized hydrogen has been detected in NGC 7332 (Plana & Boulesteix 1996) which extends over the velocity range of the Knapp et al. neutral hydrogen detection. This ionized gas is organised into two dynamically separate discs, one of which (the more massive) is counter-rotating with respect to the stars.
The ionized gas in NGC 7332 was also examined by Falcón-Barroso et al. (2004). They found that “NGC 7332 is young everywhere” and that there was “a significant amount of unsettled gas”, suggesting that “NGC 7332 is still evolving”. Both Falcón-Barroso et al. and Plana & Boulesteix find that a recent accretion event is the likely source of the counter-rotating gas disc. Falcón-Barroso et al. also suggest that the same event could have led to the formation of the bar in this galaxy, and that later accretion may be required to explain some other features of the ionized gas distribution.
Morganti et al. (2006) observed NGC 7332 with the Westerbork Synthesis Radio Telescope (WSRT). They did not detect any gas at the position of NGC 7332 but did detect the gas in NGC 7339 and also found a cloud with an H i mass of around 3 arc minutes from NGC 7332, in the direction of NGC 7339, which they attribute to an interaction between the two galaxies.
NGC 7339 is a nearly edge-on Sbc galaxy. It has been observed a number of times in the H i line. Springob et al. (2005) find a neutral hydrogen mass of after correction for the size of the galaxy, which is consistent with the mass of found by Staveley-Smith & Davies (1987) with the Lovell Telescope at Jodrell Bank.
Besides the two giant galaxies, two dwarf spheroidal galaxies, KKR 72 and KKR 73, have been noted by Karachentseva, Karachentsev & Richter (1999) as being possibly associated with the group following a careful search of POSS II films. Attempts to observe H i in these galaxies by Huchtmeier, Karachentsev & Karachentseva (2000) reached a limit of around but did not detect anything.
The region behind NGC 7332 is poorly studied. There are only nine redshifts for galaxies in NED222The NASA/IPAC Extragalactic Database (NED) is operated by the Jet Propulsion Laboratory, California Institute of Technology, under contract with the National Aeronautics and Space Administration.. Directly behind NGC 7332 lie a succession of void regions, identified by Fairall (1998) as parts of the Delphinus, Cygnus and Pegasus voids. The AGES region lies within, but close to the edge of, these voids out to km s-1.
The survey area of equates to a physical area of 0.8 Mpc2 at the distance of NGC 7332, allowing us to see a wide region around the galaxy pair. AGES observations of this region are particularly motivated by the possibility of finding interaction remnants from NGC 7332 and NGC 7339 along with searching their local environment for dwarf galaxies.
1.2. The NGC 1156 region
NGC 1156 is a nearby, star-forming, irregular galaxy at a redshift of 375 km s-1. It is similar in both optical appearance and H i mass to the Large Magellanic Cloud. The galaxy is listed in the isolated galaxy catalogue of Karachentseva, Lebedev & Shcherbanovskij (1973) as one of the most isolated galaxies in the nearby Universe, with no companion within 10∘. Karachentsev, Musella & Grimaldi (1996) estimated its distance as 7.8 Mpc (on the basis of the brightest stars); we have adopted this estimate in this paper. The nearest significant companion (taken to be one with at least 10 per cent of the -band luminosity) is UGC 2259 which lies at an angular separation of 12.5 degrees and a distance from Earth of 10 Mpc (Tully & Fisher 1988), giving it a -band luminosity of 11 per cent of NGC 1156 and a distance from NGC 1156 of 2.9 Mpc. The closest galaxy of a similar or larger size (one with at least 50 per cent of the -band luminosity) is NGC 1023 at an angular separation of 14.4 degrees and a distance from Earth of 10.4 Mpc (Ajhar et al. 1997), giving it a -band luminosity around 400 times larger than NGC 1156 and a distance from NGC 1156 of 3.4 Mpc.
A number of studies have included the galaxy, due to its isolation and its status as a relatively close, irregular galaxy with fairly active star formation. Relevant data from these studies is described below.
Swaters et al. (2002) observed NGC 1156 with the WSRT as part of the WHISP (Westerbork H i Survery of Spiral and Irregular Galaxies) project. These data show a clumpy H i morphology at small scales, with holes and knots particularly visible in the outskirts, and possible signs of a warp in the central regions. Swaters et al. found an H i flux of 71.3 Jy km s-1, giving . This is consistent with the 71.27 Jy km s-1 Green Bank 43-m measurement of Haynes et al. (1998) which, with a beam-size of 21 arcminutes, should not resolve the galaxy. Haynes et al. estimate a finite source size correction of 2 per cent for their NGC 1156 measurement, giving a final flux of 72.72 Jy km s-1.
Barazza, Binggelli & Prugniel (2001) included NGC 1156 in their sample of nearby field galaxies. They measured a extinction-corrected magnitude of and extinction-corrected colors of and . This gives an absolute magnitude of and an H i mass to light ratio (using the Swaters et al. H i mass) of , which is fairly typical for a Magellanic irregular.
NGC 1156 was included in the sample of galaxies studied in H by James et al. (2004). They found an -band magnitude of (uncorrected for extinction), and a star formation rate (using our adopted distance of 7.8 Mpc) of yr-1.
The kinematics of NGC 1156 were studied in detail by Hunter et al. (2002) as part of a study of star-forming irregular galaxies. They found that the kinematical axes of the ionized gas, neutral gas and stellar discs were probably aligned at a position angle of . This is markedly different from the morphological position angle of , due to the light of the galaxy being dominated by its bar. In the H i, they report a structure resembling a tiny tidal tail to the north-east of the galaxy, terminating in an H i complex with a large velocity width.
The background region behind NGC 1156 passes through the outskirts of the Taurus void (Fairall 1998). It is only marginally better studied than the NGC 7332 region, with 12 redshifts in NED (not including NGC 1156 itself), many of them from the Springob et al. (2005) Arecibo General Catalog. Two groups have been identified at just over 10 000 km s-1: WBL 091 (White et al. 1999) and PPS2 187 (Trasarti-Battistoni 1998).
The AGES observations of the NGC 1156 region cover an area of , equivalent to 0.09 Mpc2 at the distance of NGC 1156. The observations are particularly motivated by the possibility of finding low surface-brightness companions and dwarf galaxies that have evaded optical detection but that may have interacted (or even be interacting) with NGC 1156.
2. Observations and data reduction
The H i survey observations of the NGC 1156 region were carried out using the 305-m telescope at Arecibo Observatory333Arecibo Observatory is part of the National Astronomy and Ionosphere Center, which is operated by Cornell University under a cooperative agreement with the NSF. between December 2005 and February 2006 and those of the NGC 7332 region between July and September, 2006. Both sets of observations used the Arecibo L-band Feed Array multibeam system444see http://www.naic.edu/alfa for more details and the fixed-azimuth drift observing mode to reach an integration time of around 300 s point-1. The data reduction used the standard AGES pipeline (Cortese et al. 2008), which is based on that used for HIPASS (Barnes et al. 2001) and uses the Livedata and Gridzilla multibeam processing packages555http://www.atnf.csiro.au/computing/software/livedata.html. Baseline estimation and calibration were carried out using Livedata, which estimates the baseline to be removed by median combining an entire drift scan, and the reduced spectra were gridded into a datacube using Gridzilla.
The reduced data cubes were Hanning-smoothed with a width of three channels, giving a velocity resolution of 10 km s-1 and a noise of 0.75 mJy channel-1 beam-1. The final beam resolution (from 2-D Gaussian fitting on the 670 mJy continuum source 4C +24.59 which is close to NGC 7332; Condon et al. 1998) was 3.4 arc minutes (the same as the input beam).
2.1. Extended Sources
The standard AGES pipeline is optimized for point sources and, as such, does not give the correct flux for extended sources such as NGC 7339 (in the NGC 7332 field) and NGC 1156. There are two reasons for this: firstly the baseline estimation carried out in Livedata can remove flux if a strong source fills a significant portion of a scan and secondly the gridding is optimised to correctly reconstruct the flux of a point-source at the pixel center.
In order to overcome this problem, we have formed a extended-source cubes of the regions around NGC 1156 and NGC 7332 using the MinMed bandpass estimator in Livedata (Putman et al. 2002) and without applying the beam normalization in Gridzilla. This gives a reduction in the flux of point sources but gives correct fluxes for gas that overfills the beam. Following Hanning smoothing, the noise in the extended-source cubes was 0.4 mJy beam-1 for the NGC 7332 and 0.7 mJy beam-1 for NGC 1156 (implying that the bandpass estimate from MinMed was not as effective for NGC 1156 as for NGC 7332). The gridded beam remained at 3.4 arc minutes, giving a 3 sensitivity to extended emission that fills or overfills the beam of atoms cm-2 in NGC 7332 and atoms cm-2 in NGC 1156.
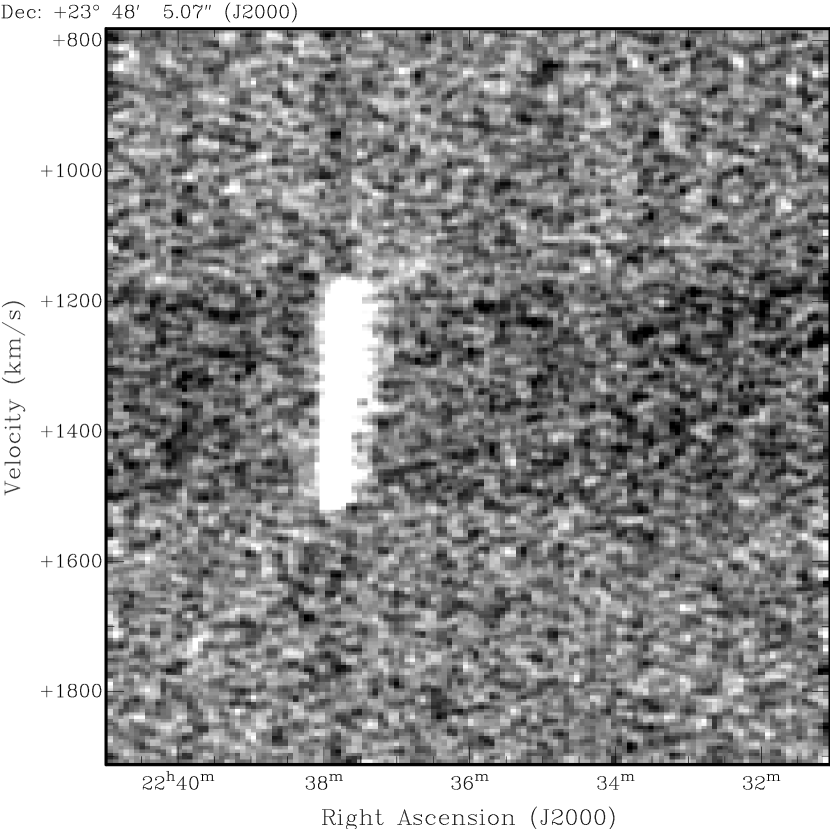
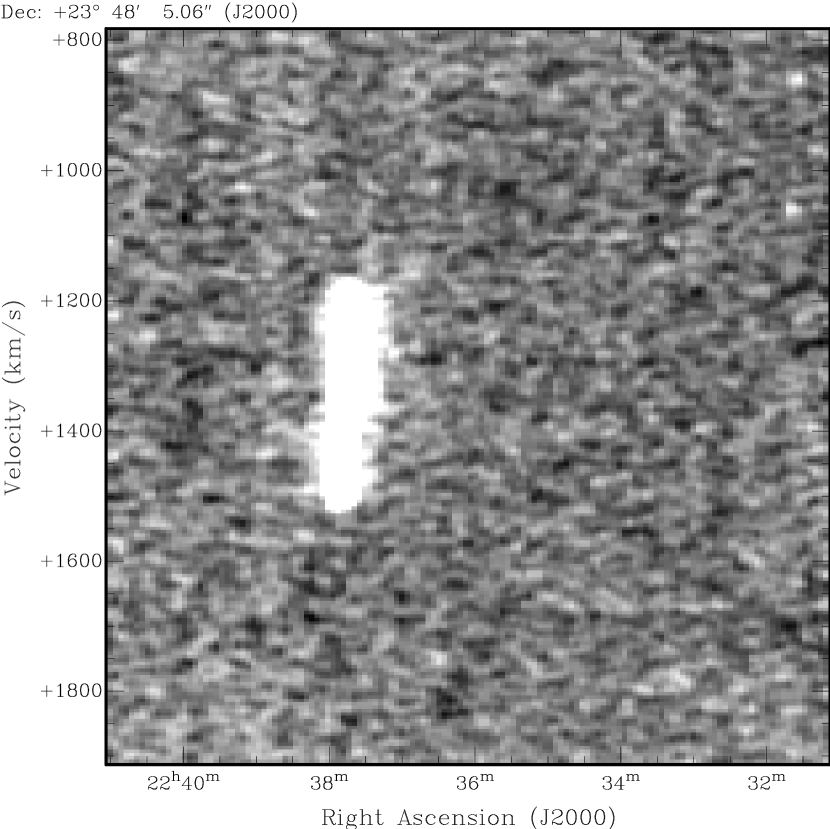
The difference between the standard and extended cubes can be seen in Fig. 1. The standard cube has a ‘shadow’ in the scan direction (R.A.) caused by NGC 7332 being included in the determination of the baseline. This causes the extension of NGC 7332 in the R.A. direction to be visibly truncated on the standard cube as well as removing flux from the whole galaxy.
The fluxes of the extended sources (NGC 7339 and NGC 1156) were found by fitting a 2D Gaussian (using the Miriad routine Imfit to a moment 0 map of each source made from the relevant extended-source optimised cube. The measured flux was then beam-corrected using a size for the beam of 3.4 arc minutes. In addition to the flux, this method fits the position , deconvolved size, and position angle of the source. As described in the sections on NGC 7339 and NGC 1156, this gives an estimate of the flux of these galaxies that is consistent with previous measurements. The spectral parameters of the extended sources were measured on summed and beam-corrected spectra formed in an 11 by 11 arc minute box, also on the extended-source optimised cubes
2.2. Radio Frequency Interference
The survey data is affected by radio frequency interference (RFI) at 1350 MHz from the Federal Aviation Authority radar at Pico del Este. This is seen at km s-1. An intermod of the Punta Salinas radar at 1241.7 MHz appears in the data at km s-1. As these radar signals are present in all or nearly all of the observations, they are not removed by median combining the data.
The other major source of RFI is the GPS L3 beacon at 1380 MHz, which is seen at km s-1 in the data. However, this only transmits intermittently and is therefore mostly removed when the data are combined. Extra care is taken when identifying previously uncataloged sources at this redshift to ensure that they are true H i sources and not GPS transmissions.
3. The AGES catalog
The NGC 7332 cube was searched independently by eye by two members of the team (RM & EM). Detections were classified as ‘solid’ or ‘dubious’. Any detections not classified as ‘solid’ by both searchers were targetted for follow-up observations. These were carried out with the L-Band Wide and ALFA receivers at Arecibo Observatory during the summer of 2008.
The NGC 1156 cube was searched by two members of the team (RA & Luca Cortese) and using an automated searching algorithm (see Cortese et al. 2008 for details). Any detections with a signal to noise of less than 7 (calculated retrospectively from the measured parameters, see below for details) were followed up with the L-band Wide receiver at Arecibo Observatory during the winter of 2006 and the fall of 2009.
All of the sources in the catalog presented here (Table 1) are either therefore considered solid detections on the original AGES cubes or have been confirmed by follow-up observations. The data is presented in the same format as Cortese et al. (2008): Column 1 gives the AGES H i source ID. Columns 2 and 3 give the right ascension of the H i source and its associated error (in seconds of right ascension). Columns 3 and 4 give the declination of the H i source and its associated error (in seconds of arc). Column 6 gives the heliocentric velocity () and associated error, measured as the mid-point of the H i profile at 50 per cent of the peak flux. Columns 7 and 8 give the observed width of the H i profile (not corrected for instrumental broadening, turbulent motions, etc.) at 50 and 20 per cent respectively of the peak flux, along with their associated errors. Column 9 gives the peak flux density and its associated error. Column 10 gives the integrated flux and its associated error. Column 11 gives the object flags, defined as follows: flag 0 is a source securely detected in the survey data; flag 1 is a source confirmed by follow-up observations; flag 2 is a source contaminated by RFI (none of the sources in the regions reported in this paper have this flag); flag 3 marks extended sources, measured as described in Section 2.1.
The H i parameters in Table 1 were derived as in Cortese et al. 2008 using the Miriad routine MBSpect. Uncertainties were derived using the equations from Koribalski et al. (2004), e.g. , where is the channel width and is taken to be the quadrature sum of the rms measured off-source and , e.g. . The uncertainty is the sytematic velocity is given by ; errors in the widths are given by and . The positions and their associated errors are from the fitting of a gaussian to the source in MBSpect, the errors are the formal errors on the fit and, while they are indicative of the quality of the fit, do not correspond directly to the offset between the Hi position and the optical position and appear to underestimate the true uncertainty in the position by a factor of around three (see Section 5.3).
| H i ID | R.A. | Dec. | V | W50 | W20 | Flag | ||||
|---|---|---|---|---|---|---|---|---|---|---|
| (J2000) | (s) | (J2000) | (arc sec) | (km s-1) | (km s-1) | (km s-1) | (mJy) | (Jy km s-1) | ||
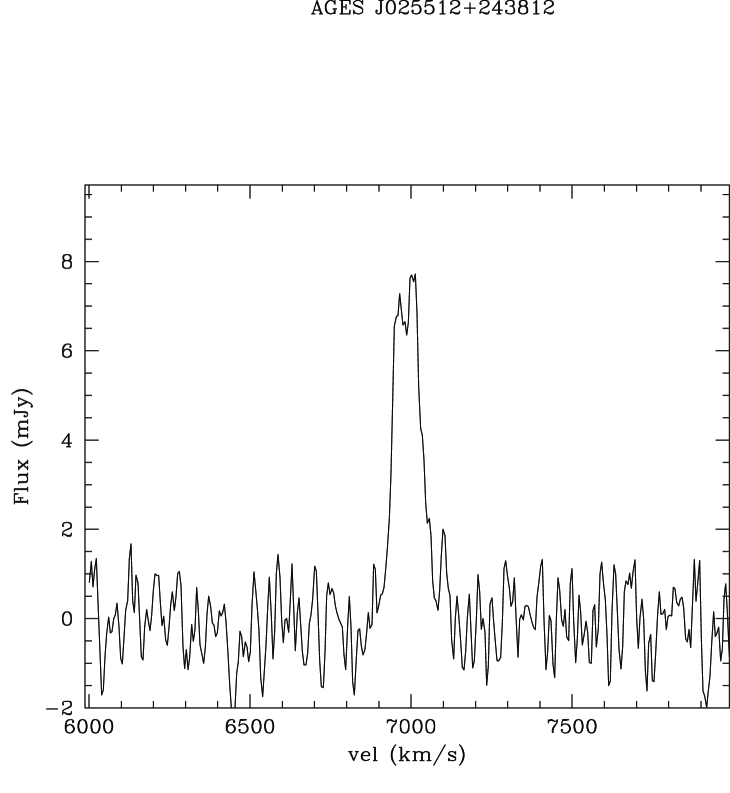
| AGES J025512+243812 | 02:55:11.9 | 1.1 | 24:38:12 | 19 | 6988 6 | 98 12 | 180 18 | 8.0 0.8 | 0.679 0.094 | 0 |
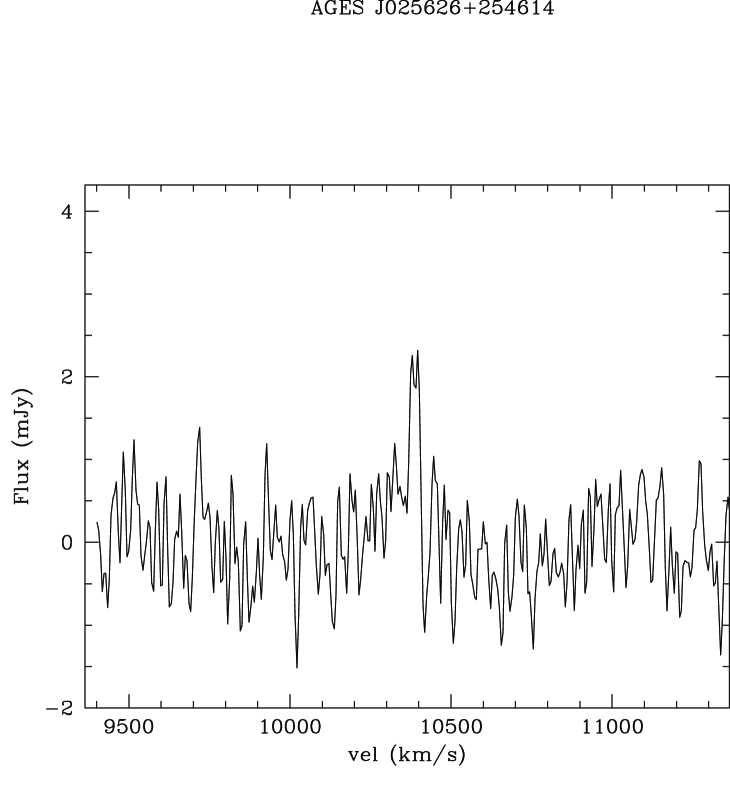
| AGES J025626+254614 | 02:56:26.0 | 1.4 | 25:46:14 | 14 | 10364 7 | 80 15 | 107 22 | 2.4 0.5 | 0.080 0.037 | 1 |
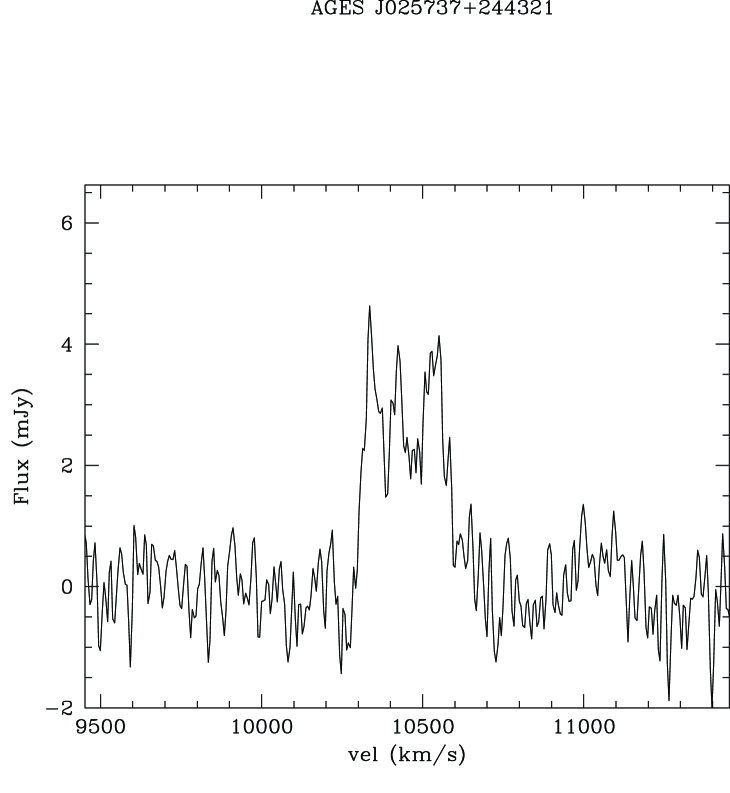
| AGES J025737+244321 | 02:57:36.5 | 0.7 | 24:43:21 | 12 | 10452 11 | 265 21 | 434 32 | 4.5 0.5 | 0.824 0.094 | 0 |
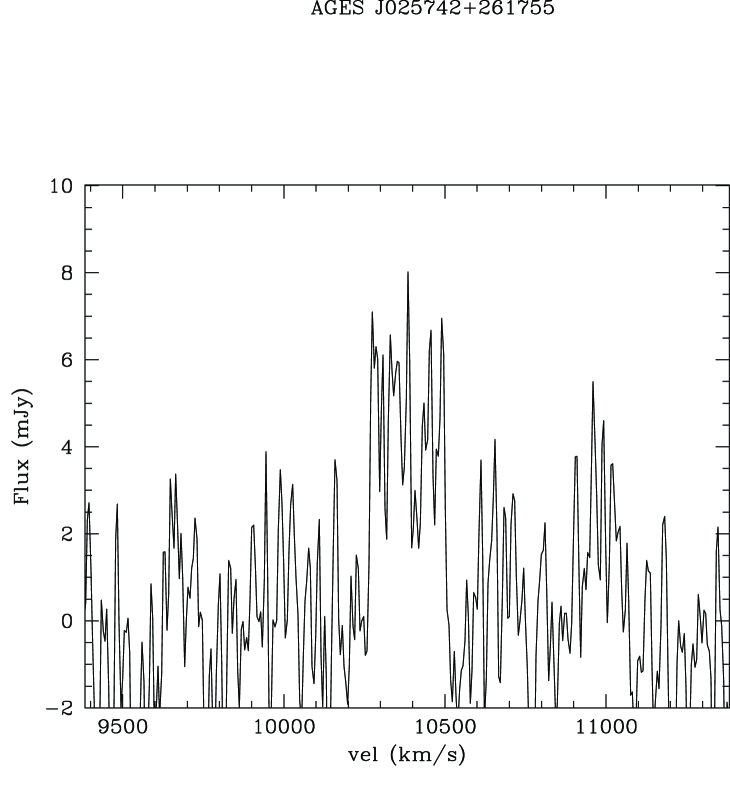
| AGES J025742+261755 | 02:57:42.4 | 0.8 | 26:17:55 | 12 | 10383 4 | 231 8 | 239 12 | 7.9 1.6 | 1.093 0.245 | 1 |
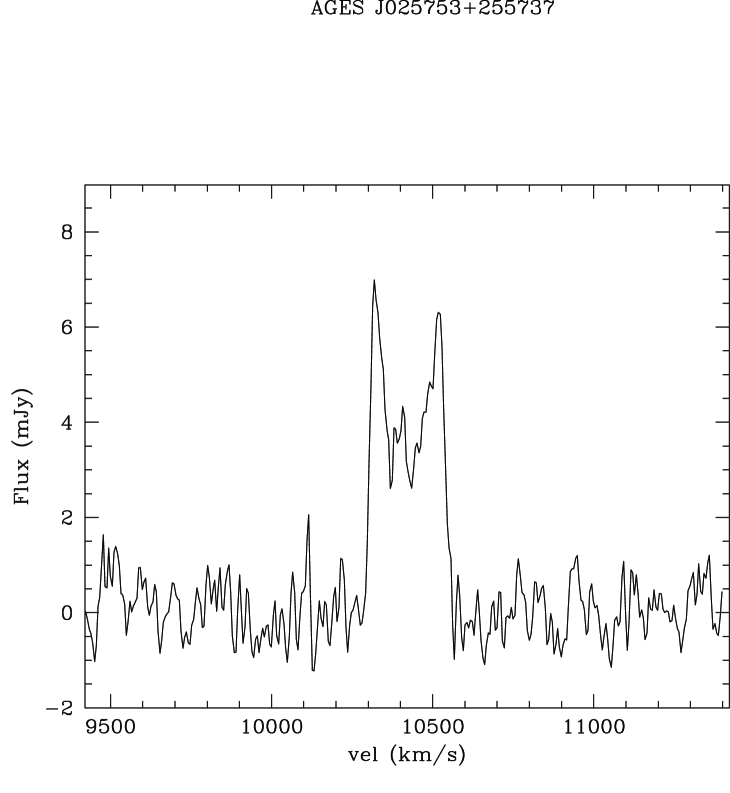
| AGES J025753+255737 | 02:57:53.2 | 0.7 | 25:57:37 | 11 | 10421 3 | 234 5 | 254 8 | 6.9 0.6 | 1.088 0.097 | 0 |
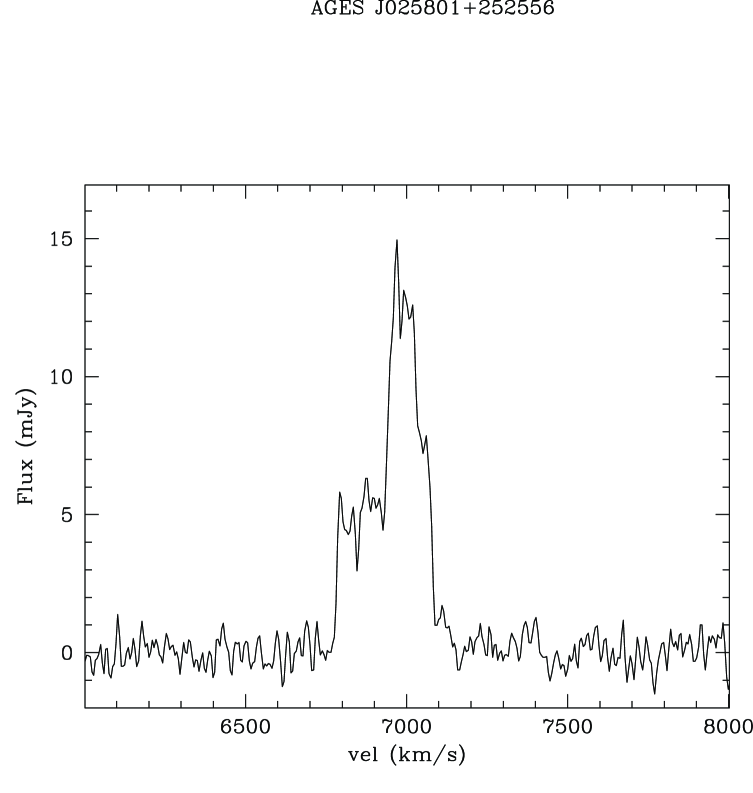
| AGES J025801+252556 | 02:58:00.7 | 0.7 | 25:25:56 | 12 | 7002 5 | 125 11 | 298 16 | 15.4 0.9 | 1.936 0.130 | 0 |
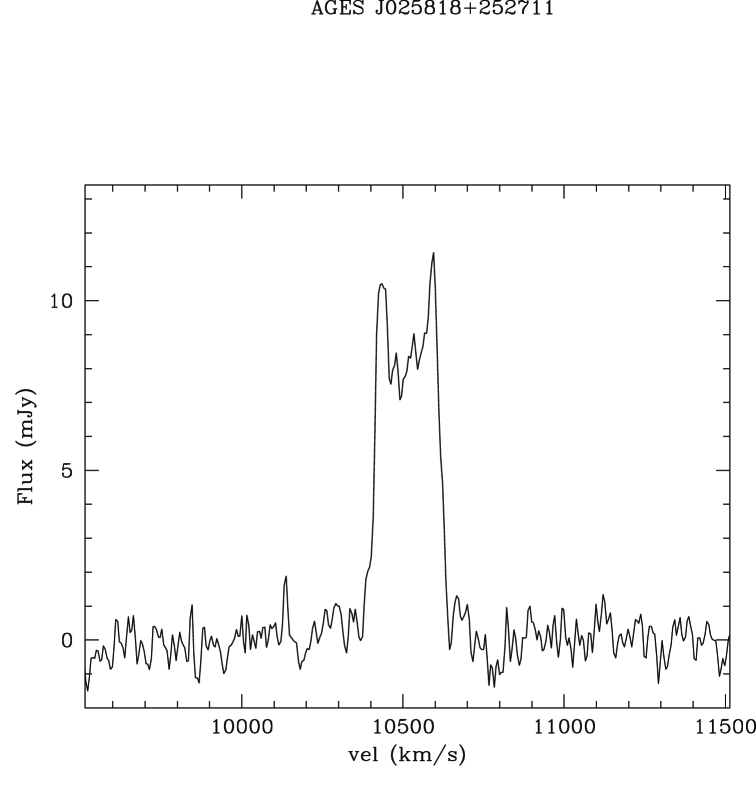
| AGES J025818+252711 | 02:58:17.6 | 0.7 | 25:27:11 | 11 | 10514 2 | 204 5 | 233 7 | 12.5 0.8 | 1.956 0.127 | 0 |
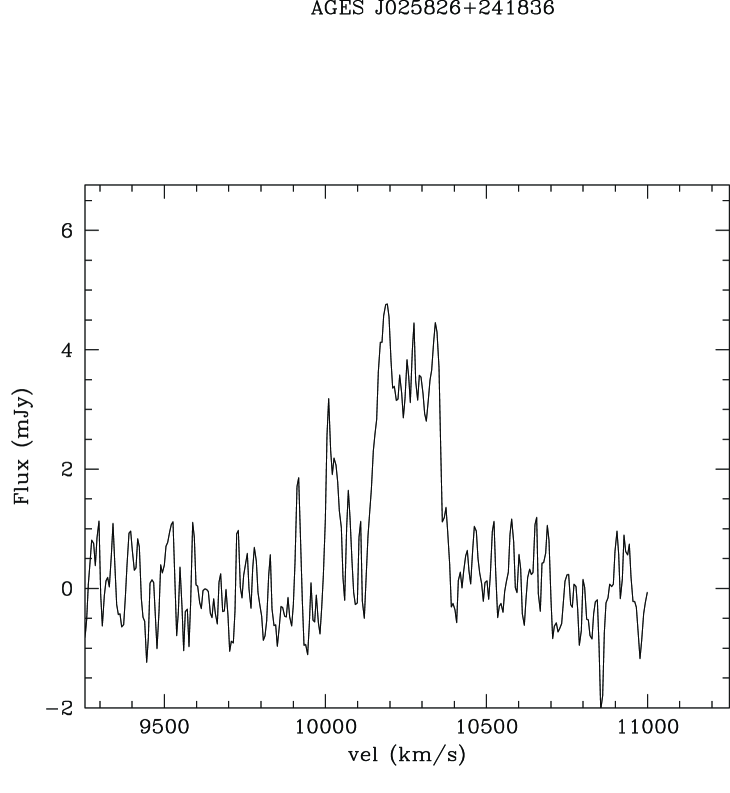
| AGES J025826+241836 | 02:58:25.6 | 2.3 | 24:18:36 | 13 | 10254 7 | 208 14 | 274 21 | 5.2 0.7 | 0.815 0.104 | 0 |
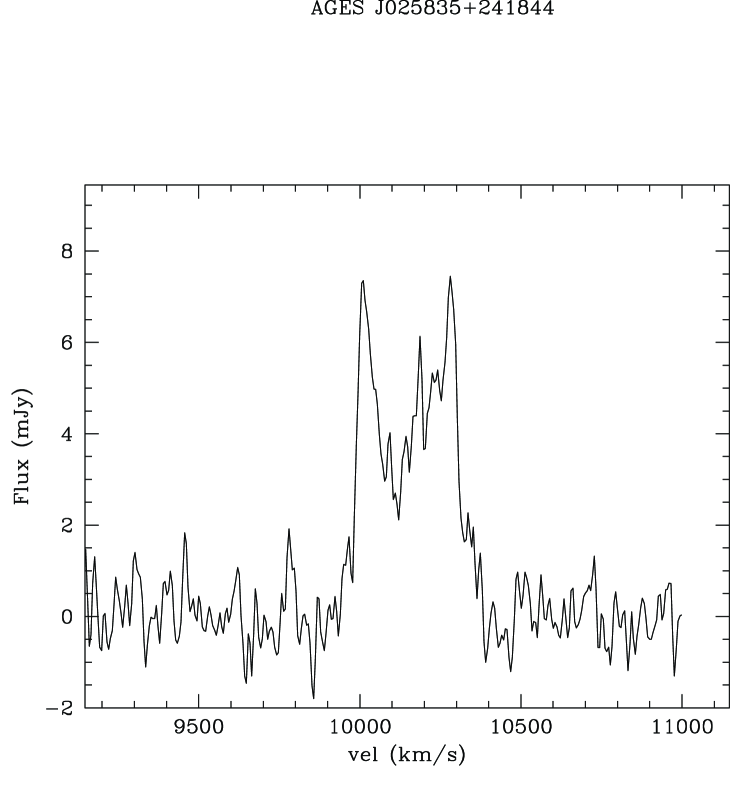
| AGES J025835+241844 | 02:58:34.8 | 0.7 | 24:18:44 | 10 | 10147 5 | 317 10 | 394 15 | 7.0 0.6 | 1.678 0.119 | 0 |
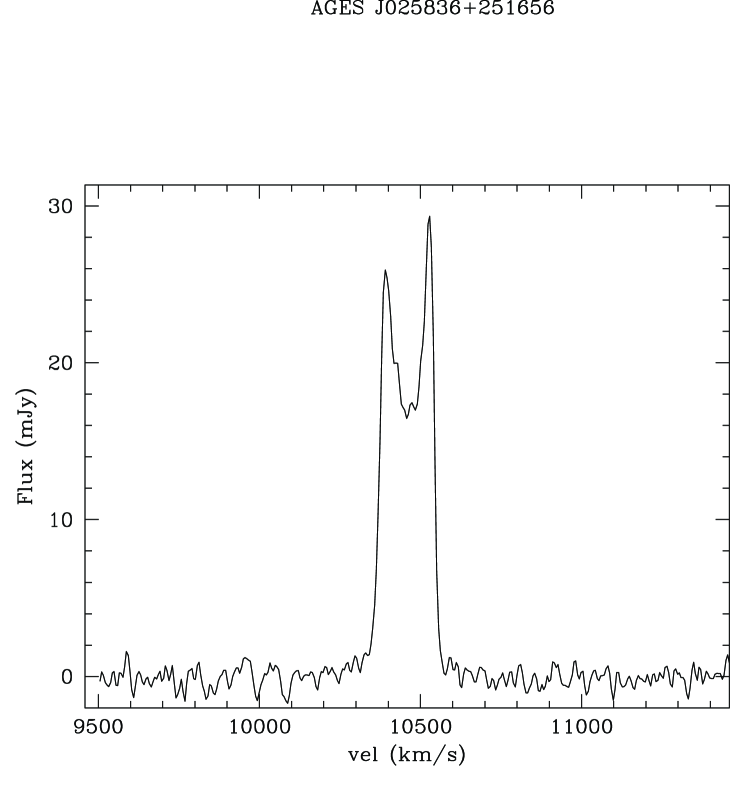
| AGES J025836+251656 | 02:58:35.5 | 0.7 | 25:16:56 | 10 | 10459 2 | 171 3 | 191 5 | 30.2 1.6 | 3.866 0.228 | 0 |
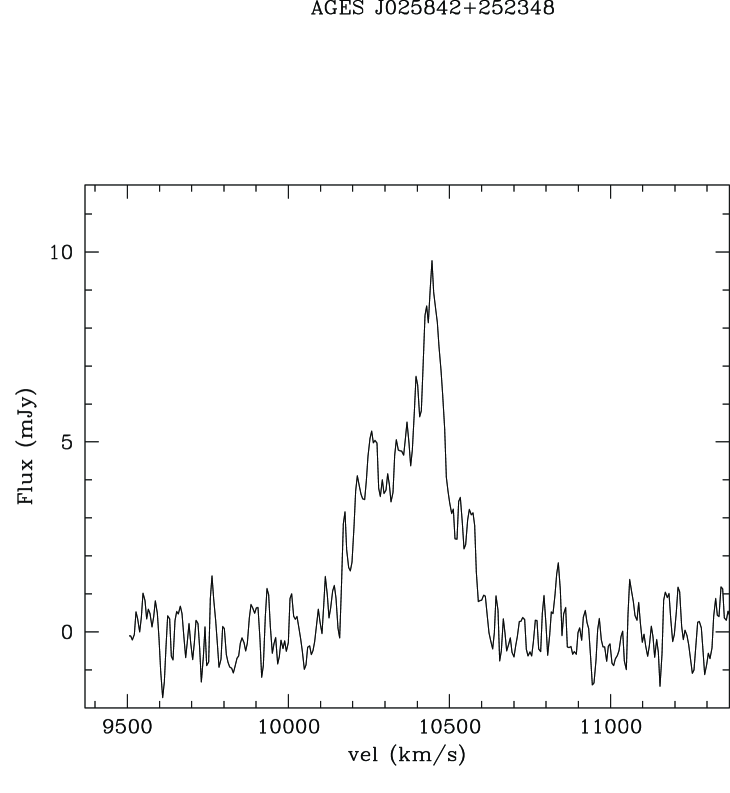
| AGES J025842+252348 | 02:58:42.2 | 1.3 | 25:23:48 | 29 | 10369 7 | 236 15 | 415 22 | 9.2 0.8 | 1.854 0.136 | 0 |
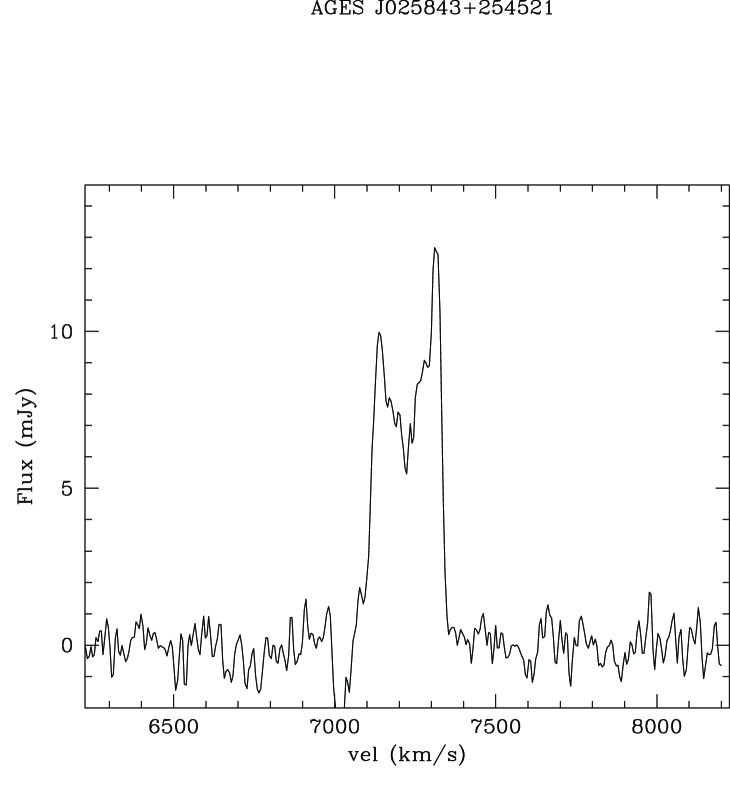
| AGES J025843+254521 | 02:58:42.6 | 0.7 | 25:45:21 | 10 | 7225 2 | 218 4 | 239 6 | 12.8 0.8 | 1.955 0.127 | 0 |
| AGES J025902+253518 | 02:59:01.8 | 1.2 | 25:35:18 | 13 | 7176 10 | 272 19 | 354 29 | 3.3 0.5 | 0.262 0.059 | 1 |
| AGES J025917+244756 | 02:59:17.4 | 0.9 | 24:47:56 | 12 | 4658 3 | 56 6 | 77 8 | 6.7 0.6 | 0.342 0.054 | 0 |
| AGES J025930+255419 | 02:59:30.3 | 0.7 | 25:54:19 | 14 | 10407 7 | 221 13 | 306 20 | 5.2 0.6 | 0.928 0.095 | 0 |
| AGES J025936+253446 | 02:59:36.0 | 0.8 | 25:34:46 | 11 | 10253 7 | 68 15 | 125 22 | 3.6 0.5 | 0.216 0.052 | 1 |
| AGES J025942+251430 | 02:59:42.3 | 0.7 | 25:14:30 | 10 | 379 2 | 75 4 | 113 6 | 925.0 46.3 | 75.6 6.4 | 3 |
| AGES J025953+254350 | 02:59:53.0 | 0.8 | 25:43:50 | 13 | 7192 11 | 19 23 | 117 34 | 3.1 0.5 | 0.114 0.040 | 0 |
| AGES J025954+241323 | 02:59:54.1 | 0.7 | 24:13:23 | 10 | 10224 2 | 303 5 | 329 7 | 15.8 1.1 | 3.302 0.193 | 0 |
| AGES J030008+241600 | 03:00:08.3 | 0.7 | 24:16:00 | 10 | 15081 5 | 430 10 | 441 15 | 6.2 1.4 | 1.483 0.280 | 0 |
| AGES J030014+250315 | 03:00:14.0 | 0.7 | 25:03:15 | 10 | 11308 2 | 76 4 | 92 7 | 7.7 0.6 | 0.492 0.064 | 0 |
| AGES J030025+255335 | 03:00:24.9 | 0.7 | 25:53:35 | 15 | 10612 5 | 104 9 | 111 14 | 2.3 0.6 | 0.169 0.066 | 1 |
| AGES J030027+241301 | 03:00:27.2 | 0.8 | 24:13:01 | 10 | 9877 5 | 57 10 | 170 14 | 15.4 1.0 | 0.933 0.102 | 0 |
| AGES J030036+241156 | 03:00:36.4 | 1.1 | 24:11:56 | 11 | 15183 9 | 112 17 | 158 26 | 4.9 0.9 | 0.427 0.110 | 1 |
| AGES J030039+254656 | 03:00:39.3 | 1.6 | 25:46:56 | 15 | 308 3 | 19 7 | 44 10 | 5.8 0.6 | 0.114 0.032 | 0 |
| AGES J030112+242411 | 03:01:11.5 | 0.7 | 24:24:11 | 10 | 9781 4 | 392 7 | 429 11 | 6.8 0.6 | 1.594 0.117 | 0 |
| AGES J030136+245602 | 03:01:36.1 | 0.7 | 24:56:02 | 11 | 10417 8 | 188 16 | 243 24 | 3.3 0.5 | 0.366 0.070 | 0 |
| AGES J030139+254442 | 03:01:39.2 | 0.7 | 25:44:42 | 13 | 6722 4 | 149 7 | 187 11 | 7.0 0.6 | 0.952 0.090 | 0 |
| AGES J030146+254314 | 03:01:45.8 | 0.8 | 25:43:14 | 14 | 11216 3 | 312 6 | 332 8 | 6.5 0.6 | 1.378 0.110 | 0 |
| AGES J030200+250030 | 03:01:59.7 | 0.7 | 25:00:30 | 11 | 7025 2 | 264 5 | 286 7 | 9.2 0.7 | 1.808 0.120 | 0 |
| AGES J030204+254745 | 03:02:04.0 | 0.7 | 25:47:45 | 10 | 6791 3 | 253 6 | 280 9 | 7.4 0.6 | 1.421 0.109 | 0 |
| AGES J030234+244938 | 03:02:34.1 | 0.7 | 24:49:38 | 10 | 3260 1 | 48 3 | 63 4 | 22.4 1.2 | 0.983 0.103 | 0 |
| AGES J030254+260028 | 03:02:54.2 | 0.7 | 26:00:28 | 10 | 10625 2 | 117 4 | 135 5 | 13.9 0.9 | 1.555 0.114 | 0 |
| AGES J030309+260407 | 03:03:08.6 | 0.7 | 26:04:07 | 11 | 14014 9 | 209 18 | 281 27 | 3.4 0.5 | 0.433 0.075 | 0 |
| AGES J030325+241510 | 03:03:25.3 | 0.7 | 24:15:10 | 11 | 14750 8 | 158 17 | 292 25 | 7.4 0.8 | 0.933 0.112 | 0 |
| AGES J030355+241922 | 03:03:54.7 | 0.7 | 24:19:22 | 12 | 14517 11 | 102 23 | 286 34 | 5.3 0.7 | 0.496 0.080 | 0 |
| AGES J030450+260045 | 03:04:50.3 | 0.8 | 26:00:45 | 11 | 9424 10 | 134 20 | 183 31 | 2.9 0.6 | 0.239 0.071 | 1 |
| AGES J030453+251532 | 03:04:53.1 | 0.7 | 25:15:32 | 10 | 14206 5 | 239 10 | 267 16 | 5.1 0.7 | 0.735 0.113 | 0 |
| H i ID | R.A. | Dec. | V | W50 | W20 | Flag | ||||
|---|---|---|---|---|---|---|---|---|---|---|
| (J2000) | (s) | (J2000) | (arc sec) | (km s-1) | (km s-1) | (km s-1) | (mJy) | (Jy km s-1) | ||
| AGES J223111+234146 | 22:31:11.0 | 0.7 | 23:41:46 | 14 | 16645 3 | 266 7 | 276 10 | 3.9 0.6 | 0.491 0.090 | 1 |
| AGES J223122+230436 | 22:31:22.1 | 0.7 | 23:04:36 | 10 | 17017 3 | 200 7 | 214 10 | 5.7 0.8 | 0.692 0.105 | 0 |
| AGES J223143+244513 | 22:31:43.0 | 0.7 | 24:45:13 | 13 | 16130 7 | 167 13 | 233 20 | 4.5 0.5 | 0.565 0.078 | 1 |
| AGES J223213+232657 | 22:32:12.6 | 0.7 | 23:26:57 | 10 | 16892 3 | 160 7 | 193 10 | 8.6 0.7 | 1.226 0.111 | 0 |
| AGES J223218+235131 | 22:32:17.8 | 0.7 | 23:51:31 | 10 | 11950 6 | 367 12 | 403 18 | 3.6 0.5 | 0.731 0.096 | 0 |
| AGES J223223+232613 | 22:32:23.4 | 0.7 | 23:26:13 | 10 | 11427 8 | 51 16 | 288 24 | 9.8 0.8 | 0.727 0.084 | 0 |
| AGES J223231+231601 | 22:32:30.5 | 0.8 | 23:16:01 | 11 | 11787 10 | 361 20 | 475 31 | 3.7 0.5 | 0.902 0.105 | 1 |
| AGES J223236+235555 | 22:32:36.3 | 0.7 | 23:55:55 | 10 | 7457 2 | 329 4 | 349 6 | 11.3 0.8 | 2.628 0.146 | 0 |
| AGES J223237+231209 | 22:32:37.2 | 0.7 | 23:12:09 | 11 | 16614 6 | 209 11 | 236 17 | 3.2 0.5 | 0.444 0.079 | 1 |
| AGES J223245+243816 | 22:32:45.2 | 0.7 | 24:38:16 | 11 | 15968 8 | 117 16 | 199 23 | 5.1 0.7 | 0.515 0.083 | 0 |
| AGES J223318+244545 | 22:33:17.8 | 0.8 | 24:45:45 | 11 | 12232 4 | 450 8 | 462 12 | 4.3 0.7 | 0.946 0.137 | 1 |
| AGES J223320+230400 | 22:33:20.2 | 0.7 | 23:04:00 | 10 | 7623 4 | 92 8 | 125 12 | 5.4 0.6 | 0.476 0.068 | 0 |
| AGES J223329+231109 | 22:33:29.1 | 0.7 | 23:11:09 | 10 | 13600 6 | 187 11 | 248 17 | 6.3 0.7 | 0.930 0.104 | 0 |
| AGES J223342+242712 | 22:33:42.1 | 0.8 | 24:27:12 | 11 | 9975 5 | 130 10 | 184 15 | 5.8 0.6 | 0.687 0.079 | 0 |
| AGES J223355+243114 | 22:33:54.9 | 0.9 | 24:31:14 | 22 | 10012 4 | 115 9 | 132 13 | 3.4 0.5 | 0.265 0.059 | 1 |
| AGES J223415+233057 | 22:34:15.0 | 0.8 | 23:30:57 | 12 | 16476 8 | 136 15 | 186 23 | 3.3 0.5 | 0.370 0.070 | 1 |
| AGES J223449+240744 | 22:34:48.8 | 0.7 | 24:07:44 | 12 | 16289 2 | 40 5 | 58 7 | 8.9 0.7 | 0.315 0.056 | 0 |
| AGES J223502+235258 | 22:35:01.7 | 0.7 | 23:52:58 | 11 | 9713 8 | 151 16 | 192 23 | 2.9 0.5 | 0.255 0.062 | 1 |
| AGES J223502+242131 | 22:35:02.4 | 0.7 | 24:21:31 | 12 | 12241 9 | 170 18 | 235 28 | 3.1 0.5 | 0.332 0.069 | 1 |
| AGES J223506+233707 | 22:35:05.6 | 0.7 | 23:37:07 | 10 | 5655 3 | 139 6 | 159 8 | 6.4 0.6 | 0.754 0.082 | 0 |
| AGES J223517+244317 | 22:35:16.8 | 0.7 | 24:43:17 | 11 | 9954 8 | 193 15 | 233 23 | 3.4 0.6 | 0.348 0.079 | 1 |
| AGES J223605+242407 | 22:36:04.7 | 0.7 | 24:24:07 | 11 | 16062 5 | 68 11 | 104 16 | 4.0 0.5 | 0.262 0.055 | 1 |
| AGES J223613+243504 | 22:36:13.0 | 0.7 | 24:35:04 | 10 | 12790 3 | 265 5 | 284 8 | 7.9 0.7 | 1.179 0.111 | 0 |
| AGES J223627+234258 | 22:36:27.2 | 0.7 | 23:42:58 | 10 | 1410 2 | 59 4 | 74 6 | 9.5 0.7 | 0.522 0.065 | 0 |
| AGES J223628+245307 | 22:36:27.8 | 2.2 | 24:53:07 | 54 | 12893 10 | 195 20 | 242 29 | 7.2 1.5 | 0.771 0.202 | 1 |
| AGES J223631+240823 | 22:36:30.6 | 0.7 | 24:08:23 | 10 | 12041 6 | 68 11 | 124 17 | 6.1 0.7 | 0.366 0.066 | 0 |
| AGES J223701+225532 | 22:37:00.8 | 0.7 | 22:55:32 | 10 | 11519 3 | 195 7 | 229 10 | 6.8 0.6 | 1.146 0.099 | 0 |
| AGES J223715+232957 | 22:37:15.0 | 0.7 | 23:29:57 | 12 | 18562 9 | 142 17 | 188 26 | 3.3 0.6 | 0.324 0.078 | 1 |
| AGES J223739+244947 | 22:37:39.1 | 0.7 | 24:49:47 | 12 | 15071 4 | 276 9 | 291 13 | 5.9 0.9 | 0.944 0.152 | 0 |
| AGES J223741+242520 | 22:37:41.0 | 0.7 | 24:25:20 | 10 | 8782 2 | 165 4 | 181 6 | 8.2 0.6 | 1.033 0.092 | 0 |
| AGES J223745+225309 | 22:37:45.0 | 0.7 | 22:53:09 | 11 | 11500 5 | 63 9 | 94 14 | 5.2 0.7 | 0.240 0.056 | 1 |
| AGES J223746+234712 | 22:37:46.5 | 0.7 | 23:47:12 | 10 | 1341 2 | 325 4 | 348 5 | 36.3 2.0 | 9.1 0.9 | 3 |
| AGES J223823+245207 | 22:38:22.7 | 0.7 | 24:52:07 | 11 | 15323 6 | 205 12 | 230 17 | 8.4 1.5 | 0.556 0.150 | 1 |
| AGES J223829+235135 | 22:38:29.4 | 0.7 | 23:51:35 | 10 | 1414 3 | 36 6 | 73 8 | 8.3 0.6 | 0.351 0.047 | 0 |
| AGES J223834+231114 | 22:38:34.4 | 0.7 | 23:11:14 | 11 | 8770 6 | 154 12 | 192 18 | 5.2 0.7 | 0.691 0.108 | 0 |
| AGES J223839+234247 | 22:38:39.0 | 0.7 | 23:42:47 | 11 | 8797 7 | 90 14 | 163 21 | 5.4 0.7 | 0.422 0.073 | 0 |
| AGES J223842+233156 | 22:38:42.3 | 0.7 | 23:31:56 | 10 | 11824 4 | 239 8 | 265 12 | 4.7 0.6 | 0.689 0.085 | 0 |
| AGES J223846+234923 | 22:38:45.6 | 0.8 | 23:49:23 | 21 | 8788 6 | 153 11 | 195 17 | 4.3 0.5 | 0.436 0.070 | 0 |
| AGES J223900+244752 | 22:39:00.1 | 0.8 | 24:47:52 | 11 | 14965 4 | 302 8 | 328 12 | 6.6 0.8 | 0.950 0.117 | 0 |
| AGES J223905+240651 | 22:39:05.1 | 0.7 | 24:06:51 | 10 | 8842 6 | 169 11 | 248 17 | 6.2 0.6 | 1.024 0.096 | 0 |
| AGES J223946+242157 | 22:39:46.3 | 0.7 | 24:21:57 | 11 | 7493 5 | 44 10 | 120 16 | 6.8 0.6 | 0.350 0.055 | 0 |
| AGES J224005+244154 | 22:40:04.6 | 0.7 | 24:41:54 | 10 | 12805 4 | 379 8 | 469 13 | 16.2 1.1 | 3.981 0.212 | 0 |
| AGES J224016+244658 | 22:40:16.3 | 0.7 | 24:46:58 | 11 | 15979 7 | 71 15 | 120 22 | 4.8 0.7 | 0.257 0.069 | 0 |
| AGES J224024+243019 | 22:40:24.0 | 0.7 | 24:30:19 | 11 | 8856 5 | 43 11 | 90 16 | 5.7 0.7 | 0.222 0.052 | 0 |
| AGES J224025+243925 | 22:40:24.9 | 0.8 | 24:39:25 | 12 | 16026 3 | 237 6 | 245 9 | 4.1 0.6 | 0.549 0.093 | 1 |
| AGES J224039+243229 | 22:40:39.0 | 0.7 | 24:32:29 | 11 | 12855 4 | 171 9 | 189 13 | 3.5 0.5 | 0.450 0.076 | 0 |
| AGES J224052+234635 | 22:40:52.3 | 0.8 | 23:46:35 | 11 | 11745 2 | 85 5 | 95 7 | 5.6 0.7 | 0.336 0.065 | 0 |
| AGES J224110+243500 | 22:41:09.9 | 0.7 | 24:35:00 | 10 | 9047 2 | 192 5 | 212 7 | 12.3 0.9 | 1.957 0.149 | 0 |
| AGES J224125+232228 | 22:41:25.5 | 0.8 | 23:22:28 | 11 | 7181 5 | 62 10 | 181 15 | 29.0 1.9 | 1.927 0.201 | 1 |

Following Giovanelli et al. (2005), Cortese et al. (2008), Kent et al. (2009) and Henning et al. (2010), we characterise the effective signal to noise ratio of the galaxies retrospectively using the measured parameters on sources originally detected by-eye. The SNR is estimated as:
| (1) |
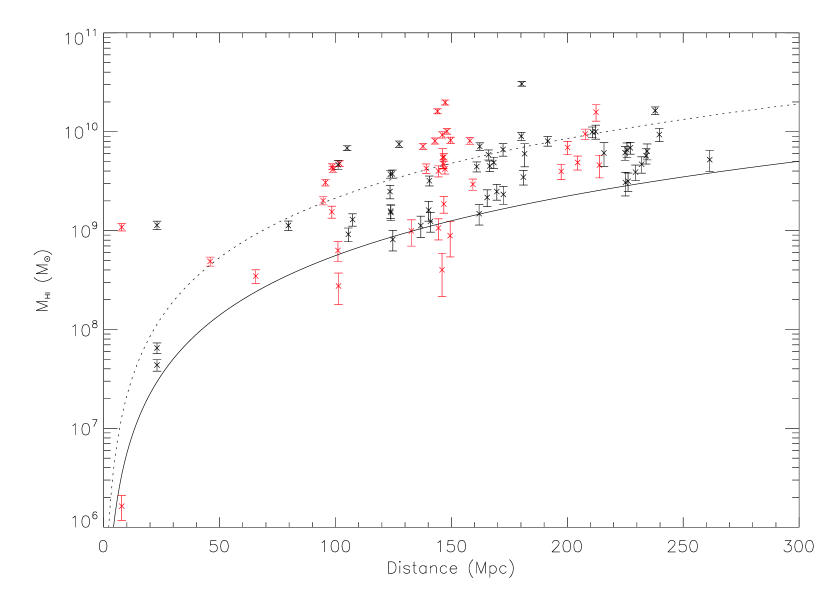
Where (the velocity width at 50 per cent of the peak height) for km s-1 and km s-1 for higher velocity widths. This corresponds to optimal selection () at lower velocity widths and peak-flux selection at higher velocity widths. We find that most of our data fall above an approximate detection limit of , as can be seen in Fig. 3. Fig. 4 shows how the sensitivity (in terms of detectable H i mass) varies with distance. Both also give the ALFALFA limit for comparison purposes (note that ALFALFA and AGES do not use entirely consistent definitions of , so this limit is necessarily only an approximation).
4. Follow-up observations
4.1. L-band Follow-up Observations
A number of sources that were not secure detections in the AGES cubes were confirmed by follow-up observations. NGC 1156 sources were followed up in October 2006 with the L-Band Wide (LBW) receiver using the Interim Correlator (IC) backend and in September 2009 with the same receiver using the WAPP backend. NGC 7332 sources were followed up in July to September 2008 using either the L-Band Wide receiver or the central pixel of ALFA, both using the WAPP backend. The observations are summarised in Table 2. The AGES ID matches the catalog AGES ID for confirmed sources, for unconfirmed sources it is merely indicative – these ‘sources’ are most probably noise fluctuations or baseline ripples introduced by continuum sources. ‘No. obs.’ indicates the number of 300s on-source on-off observations that were made of the source. The RA and Dec given here are the targetted RA and Dec and the velocity is the targetted central velocity. These may not always match precisely with the cataloged RA, Dec and central velocity (Table 1).
| AGES ID | Receiver | Backend | No. Obs. | R.A. | Decl.) | Velocity | Status |
|---|---|---|---|---|---|---|---|
| (J2000) | (J2000) | (km s-1) | |||||
| J025542+253222 | LBW | IC | 4 | 02:55:42.0 | 25:32:22 | 14973 | Unconfirmed |
| J025626+254614 | LBW | IC | 1 | 02:56:26.0 | 25:46:14 | 10385 | Confirmed |
| J025711+254925 | LBW | IC | 2 | 02:57:11.0 | 25:49:25 | 10430 | Unconfirmed |
| J025720+245431 | LBW | IC | 1 | 02:57:19.5 | 24:54:31 | 2310 | Unconfirmed |
| J025742+261755 | LBW | IC | 1 | 02:57:42.4 | 26:17:55 | 10384 | Confirmed |
| J025800+252143 | LBW | WAPP | 2 | 02:57:59.7 | 25:21:43 | 6924 | Unconfirmed |
| J025801+255804 | LBW | IC | 2 | 02:58:00.8 | 25:58:04 | 6989 | Unconfirmed |
| J025817+241737 | LBW | IC | 1 | 02:58:17.0 | 24:17:37 | 10243 | Unconfirmed |
| J025824+251514 | LBW | IC | 1 | 02:58:24.2 | 25:15:14 | 560 | Unconfirmed |
| J025828+253058 | LBW | IC | 2 | 02:58:27.9 | 25:30:58 | 6938 | Unconfirmed |
| J025902+253518 | LBW | IC | 1 | 02:59:04.0 | 25:35:10 | 7120 | Confirmed |
| J025924+243433 | LBW | IC | 2 | 02:59:24.0 | 24:34:33 | 14050 | Unconfirmed |
| J025936+253446 | LBW | WAPP | 3 | 02:59:36.0 | 25:34:46 | 10253 | Confirmed |
| J030025+255335 | LBW | WAPP | 1 | 03:00:25.0 | 25:53:35 | 10611 | Confirmed |
| J030036+241156 | LBW | IC | 2 | 03:00:30.0 | 24:11:32 | 15180 | Confirmed |
| J030104+243724 | LBW | IC | 2 | 03:01:03.5 | 24:37:24 | 11109 | Unconfirmed |
| J030107+253206 | LBW | IC | 1 | 03:01:07.4 | 25:32:06 | 436 | Unconfirmed |
| J030114+260059 | LBW | IC | 1 | 03:01:13.9 | 26:00:59 | 14050 | Unconfirmed |
| J030116+245206 | LBW | IC | 1 | 03:01:16.3 | 24:52:06 | 11086 | Unconfirmed |
| J030214+250805 | LBW | IC | 1 | 03:02:13.8 | 25:08:05 | 458 | Unconfirmed |
| J030313+245749 | LBW | IC | 2 | 03:03:13.0 | 24:57:49 | 9790 | Unconfirmed |
| J030428+244322 | LBW | IC | 1 | 03:04:28.0 | 24:43:22 | 15968 | Unconfirmed |
| J030450+260045 | LBW | IC | 1 | 03:04:50.0 | 26:00:45 | 9420 | Confirmed |
| J030506+244308 | LBW | IC | 1 | 03:05:06.0 | 24:43:08 | 14450 | Unconfirmed |
| J030528+242441 | LBW | IC | 2 | 03:05:28.0 | 24:24:41 | 15000 | Unconfirmed |
| J223111+234146 | LBW | WAPP | 2 | 22:31:11.0 | 23:41:46 | 16645 | Confirmed |
| J223143+244513 | LBW | WAPP | 1 | 22:31:42.9 | 24:45:11 | 16130 | Confirmed |
| J223226+231111 | ALFA+LBW | WAPP | 2+1 | 22:32:26.1 | 23:11:11 | 18256 | Unconfirmed |
| J223231+231601 | LBW | WAPP | 1 | 22:32:31.3 | 23:16:11 | 11797 | Confirmed |
| J223237+231209 | ALFA | WAPP | 3 | 22:32:37.0 | 23:12:05 | 16619 | Confirmed |
| J223240+224548 | ALFA | WAPP | 1 | 22:32:40.6 | 22:45:48 | 11481 | Unconfirmed |
| J223314+241428 | LBW | WAPP | 1 | 22:33:14.8 | 24:14:28 | 7463 | Unconfirmed |
| J223318+244545 | LBW | WAPP | 1 | 22:33:17.5 | 24:45:38 | 12233 | Confirmed |
| J223355+243114 | ALFA | WAPP | 1 | 22:33:54.8 | 24:31:17 | 10011 | Confirmed |
| J223404+240213 | ALFA | WAPP | 1 | 22:34:04.1 | 24:02:13 | 16121 | Unconfirmed |
| J223415+233057 | LBW | WAPP | 2 | 22:34:15.8 | 23:30:59 | 16487 | Confirmed |
| J223502+235258 | ALFA+LBW | WAPP | 1+1 | 22:35:02.5 | 23:52:33 | 9637 | Confirmed |
| J223502+242142 | ALFA | WAPP | 1 | 22:35:02.7 | 24:21:42 | 12242 | Confirmed |
| J223517+244317 | ALFA | WAPP | 1 | 22:35:16.7 | 24:43:15 | 9956 | Confirmed |
| J223544+235401 | ALFA | WAPP | 1 | 22:35:44.0 | 23:54:01 | 16471 | Unconfirmed |
| J223605+242407 | LBW | WAPP | 1 | 22:36:04.6 | 24:24:06 | 16067 | Confirmed |
| J223628+245307 | LBW | WAPP | 1 | 22:36:27.7 | 24:53:07 | 12893 | Confirmed |
| J223715+232957 | LBW | WAPP | 2 | 22:37:14.6 | 23:30:04 | 18560 | Confirmed |
| J223745+225309 | LBW | WAPP | 1 | 22:37:45.2 | 22:53:04 | 11499 | Confirmed |
| J223823+245207 | LBW | WAPP | 1 | 22:28:23.9 | 24:52:08 | 15259 | Confirmed |
| J223957+233942 | ALFA | WAPP | 1 | 22:39:57.0 | 23:39:42 | 16574 | Unconfirmed |
| J224025+243925 | ALFA+LBW | WAPP | 1+2 | 22:40:25.0 | 24:39:27 | 16026 | Confirmed |
| J224125+232228 | LBW | WAPP | 1 | 22:41:25.4 | 23:22:26 | 7181 | Confirmed |
All observations were on-off observations with 300s on-source integration time. Data reduction was performed using the standard routines in the AO-IDL system. The data were smoothed to the same resolution as AGES survey observations (10 km s-1) and reach noise levels of around 0.7 mJy. Multiple observations were carried out on sources which showed a possible signal at the location that was too weak to call a confirmation, this was often due to the presence of continuuum radiation causing baseline ripple and increased noise levels.
The confirmation rate for follow-up on the NGC 1156 field was 28 per cent (7 out of 25), while the confirmation rate on the NGC 7332 field was substantially higher, at 74 per cent (17 out of 23), similar to the confirmation rate in the NGC 1156 field (Cortese et al. 2008). This is due to the difference in the selection critera for follow-up observations used in the two fields (see §3) – these were changed after most of the follow-up of NGC 1156 had been completed and continue to be modified in order to make the most efficient use of follow-up time.
4.2. Optical survey of the NGC 7332 region
In addition to the neutral hydrogen observations, we have carried out a careful search of the blue and red POSS-II plates within 300 kpc (45 arc minutes) of NGC 7332. This repeated the search of Karachentseva et al. (1999) but included galaxies with a smaller diameter to account for the group being at 23 Mpc while Karachentseva et al. were primarily searching for objects within 10 Mpc. This search turned up a further three candidate dwarf galaxies: J223450+240757 lies 41 arc minutes from NGC 7332 and appears to be a background galaxy although it could be a dIrr, J223558+234825 is 20 arc minutes away and has the appearence of a dSph, while J223631+240814 is 13 arc minutes away and also appears to be a dSph.
On cross-referencing this with the main AGES source list, it became apparent that J223450+240757 and J223631+240814 were background galaxies. We therefore add one candidate dSph, J223558+234825, to the list of possible group members.
4.3. Optical spectroscopy
Optical redshifts were obtained for a number of galaxies in the NGC 1156 and NGC 7332 regions using a dispersion grism on the 1.5-m telescope at Loiano Observatory. Data reduction was carried out in iraf. The frames were bias-subtracted and flat-fielded and spectral calibration was carried out using a template spectrum from an Ar-He lamp. No flux calibration was applied. Post-calibration, the data were sky subtracted to minimise the impact of night sky lines. A final 1-D spectrum was produced by integrating over pixels that appeared to contain emission from the target galaxy. The results of these observations are given in Table 3, along with the AGES H i velocities for these galaxies.
| AGES ID | Optical Velocity (km s-1) | H i Velocity (km s-1) |
|---|---|---|
| J025737+244321 | 10437 82 | 10452 11 |
| J025753+255737 | 10422 82 | 10421 3 |
| J025835+241844 | 10170 133 | 10147 5 |
| J030008+241600 | 15090 64 | 15081 5 |
| J030112+242411 | 9892 142 | 9781 4 |
| J030136+245602 | 10372 74 | 10417 8 |
| J030146+254314 | 11238 64 | 11216 3 |
| J030325+241510 | 14786 76 | 14750 8 |
| J223213+232657 | 16916 119 | 16892 3 |
| J223449+240744 | 16298 81 | 16289 2 |
| J223613+243504 | 12742 69 | 12790 3 |
| J223627+234258 | 1440 88 | 1410 2 |
| J224005+244154 | 12799 100 | 12805 4 |
| J224110+243500 | 9030 94 | 9047 2 |
4.4. VLA observations of AGES J224005+244154
AGES J224005+244154 is a galaxy in the background of the NGC 7332 field with a very large H i mass of . Its has a 1.4 GHz luminosity of W Hz-1 (fron the NVSS; Condon et al. 1998) and a far IR (FIR) luminosity of (from IRAS; Moshir et al. 1990). Neither the NVSS source nor the IR source had previously been associated either with each other or with an optical counterpart.
The ratio of the FIR and 1.4 GHz fluxes gives a value of (Helou 1985). A value of less than 1.64 would indicate that a radio-loud AGN dominated the 1.4 GHz continuum, while higher values indicate that star formation is dominant. The value for AGES J224005+244154 thus implies that the source of the 1.4 GHz continuum is star formation rather than an AGN. Using the equations of Yun, Reddy & Condon (2001), the FIR flux indicates a current SFR of yr-1 while the 1.4 GHz flux gives a current SFR of yr-1. These are both consistent with an SFR of yr-1; at this rate, the galaxy has a gas-consumption timescale of just 1 Gyr, putting it in the starburst category.
We observed this galaxy with the VLA of NRAO666The National Radio Astronomy Observatory is a facility of the National Science Foundation operated under cooperative agreement by Associated Universities, Inc. in order to determine firstly whether it was a single source and, if so, whether it showed signs of a recent interaction that might have triggered a star burst. The galaxy was observed in C configuration in April 2008 for a total of 6 hours. The observations were centered at a frequency of 1362.22 MHz (corresponding to 12805 km s-1, the AGES velocity of the galaxy) with a bandwidth of 6.25 MHz over 64 spectral channels, resulting in a velocity resolution of 21.5 km s-1. The data were reduced using the Astronomical Image Processing System (AIPS).
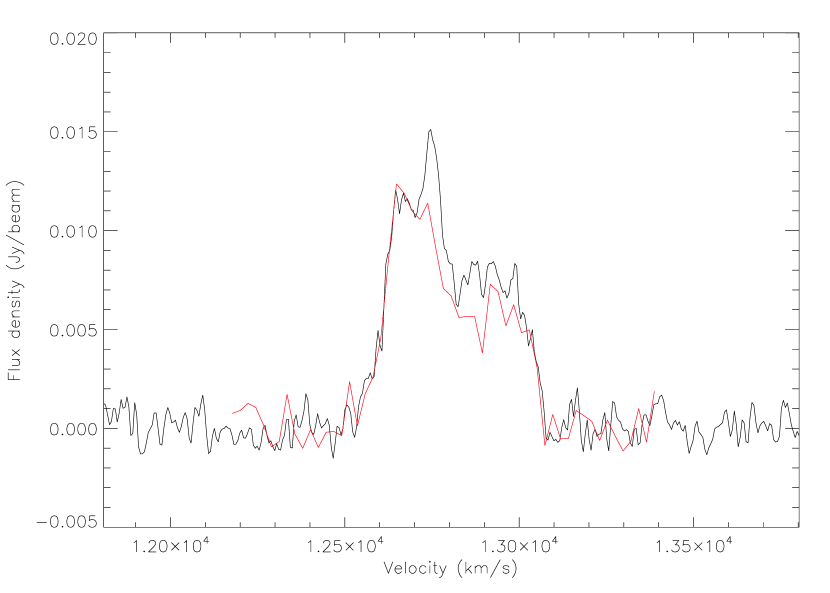
The VLA data reached a noise level of mJy. Cleaning was carried out to a depth of 1 mJy, and a moment 0 map was made using a 1 mJy clipping. This map was used to mask the part of the image containing signal from the galaxy. The flux recovered from this region with the VLA was Jy km s-1, compared to Jy km s-1 with Arecibo, a difference of less than 2.5 . The spectrum from this region of the VLA data appears consistent with the Arecibo spectrum (Fig. 5. It thus appears that little extended or lower-level flux has been missed with the VLA.
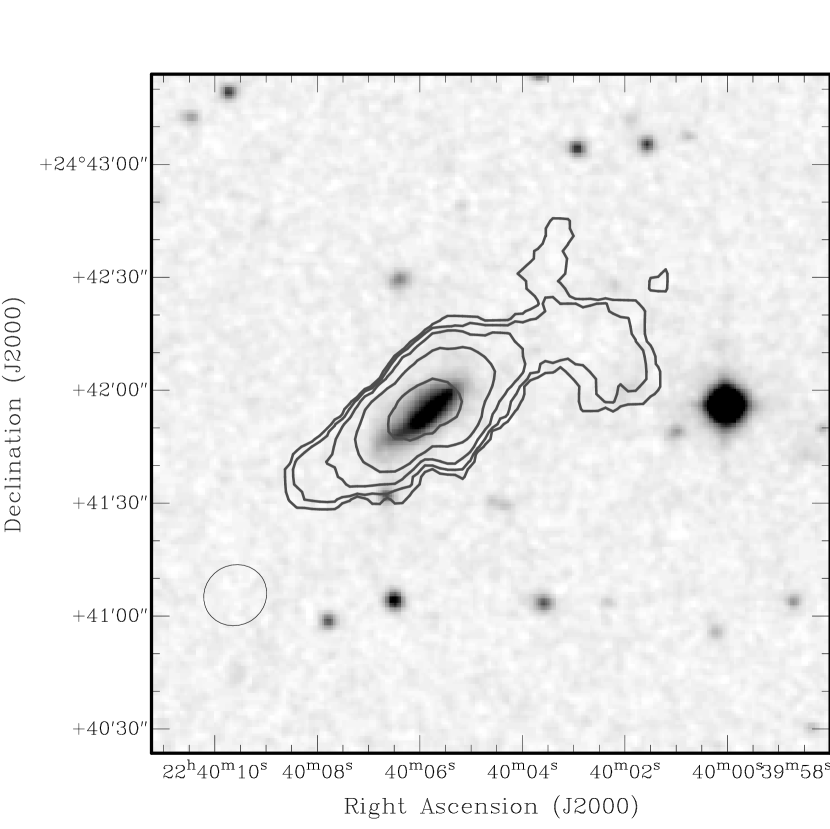
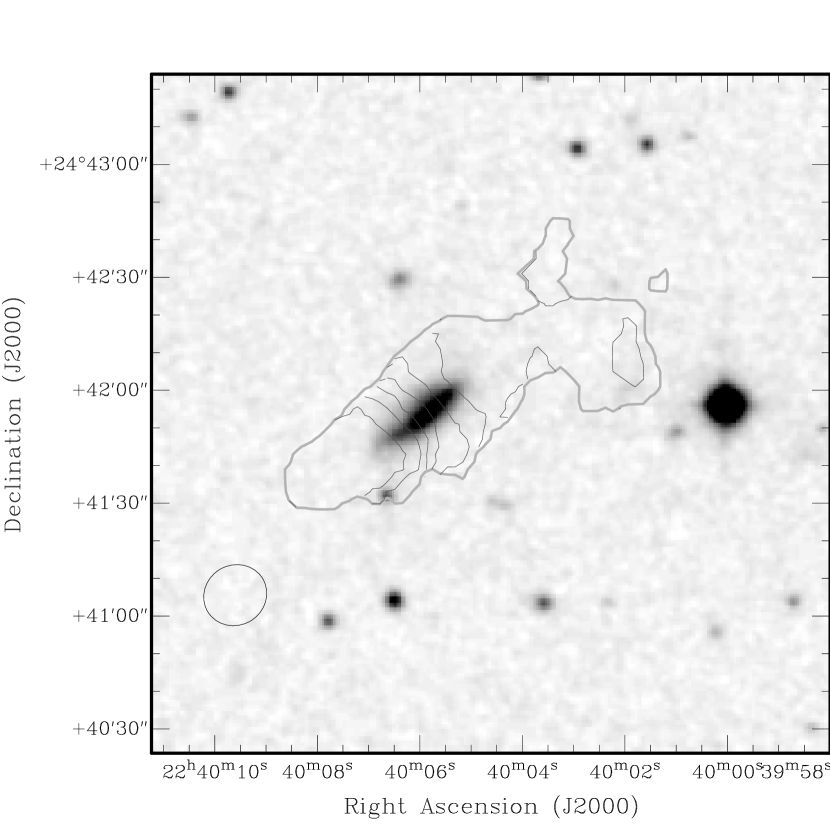
As can be seen from Figure 6, the galaxy is disturbed in both the H i and the optical. The optical disturbance can be seen as a faint plume at the eastern end of the galaxy; the H i disturbance is much more visible and takes the form of a large plume at the western end of the galaxy. The velocity field is fairly smooth over the main disc of the galaxy, but is again disturbed at the western end.
AGES J224005+244154 is clearly not evolving in isolation. It seems most likely that it has recently undergone a merger with a smaller galaxy that has triggered the current starburst phase and has resulted in the disturbances seen in the optical and H i images.
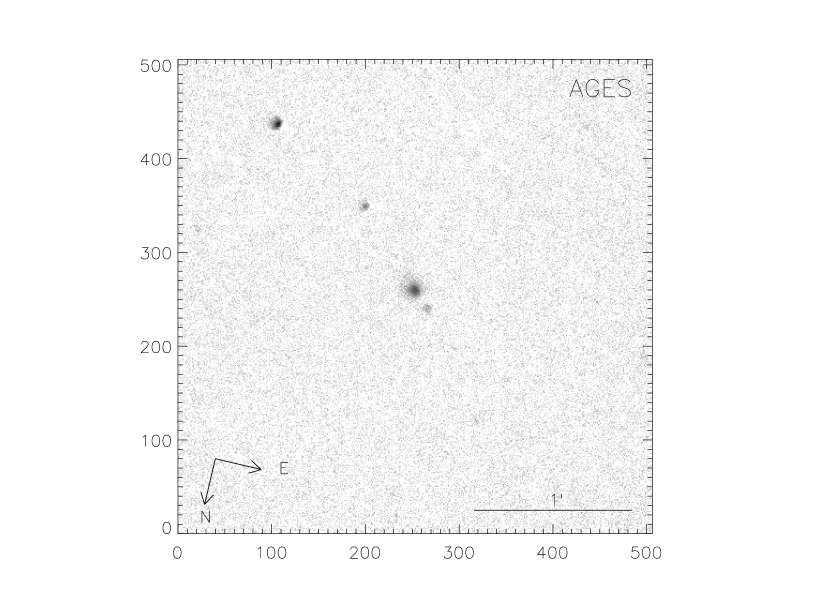
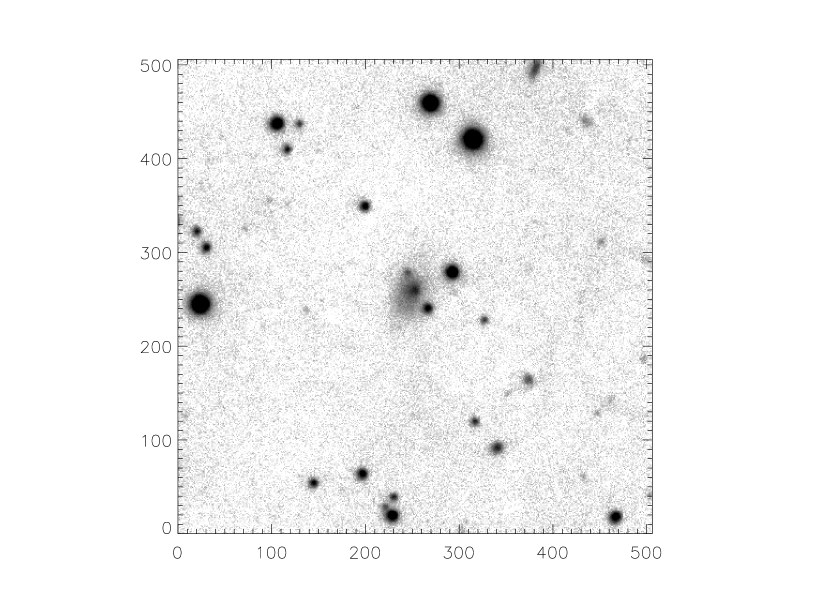
4.5. H observations of AGES J030039+254656
AGES J030039+254656 is a new dwarf galaxy discovered by AGES in the neighborhood of NGC 1156. CCD images in the -line and continuum were obtained during an observing run in November 2007 under seeing of . The observations were performed by Serafim Kaisin with the BTA 6-m telescope of the Special Astrophysical Observatory equipped with the SCORPIO focal reducer. A CCD chip of 20482048 pixels provides a total field of view of about 6.1 with a scale of 0.18/pixel. The images in +[NII] and continuum were obtained via observing the galaxy though a narrow-band interference filter 75Å) with an effective wavelength =6555Å and two medium-band filters for the continuous spectrum SED607 with =167Å, =6063Å and SED707 with =207Å, =7063Å, respectively. Exposure times for the galaxy were s in the continuum and s in .
Our data reduction followed the standard practice and was performed within the MIDAS package. For all the data bias was subtracted and the images were flat-fielded by twilight flats. Cosmic particles were removed and the sky background was subtracted. Then the images in the continuum were normalized to images using 5–15 field stars and subtracted. fluxes were obtained for the continuum-subtracted images, using spectrophotometric standard stars observed in the same nights as the object. The continuum-subtracted and -band continuum images are shown in Figure 7. The investigation of measurement errors contributed from the continuum subtraction, flat-fielding and scatter in the zeropoints has shown that they have typical values within 10%. We did not correct fluxes for the contribution of the [NII] lines, because it is likely to be small for the low-luminosity galaxy. We find an H flux of W cm-2, which (after correction for galactic absorption) gives a star formation rate of M⊙ yr-1.
5. Results and Discussion
5.1. The NGC 7332 group
Three galaxies were detected in neutral hydrogen within the NGC 7332 group. In addition to NGC 7339, two new sources, AGES J223829+235135 and AGES J223627+234258, were found in H i. Both of these have optical counterparts in the Digitized Sky Survey but have not been previously catalogued.
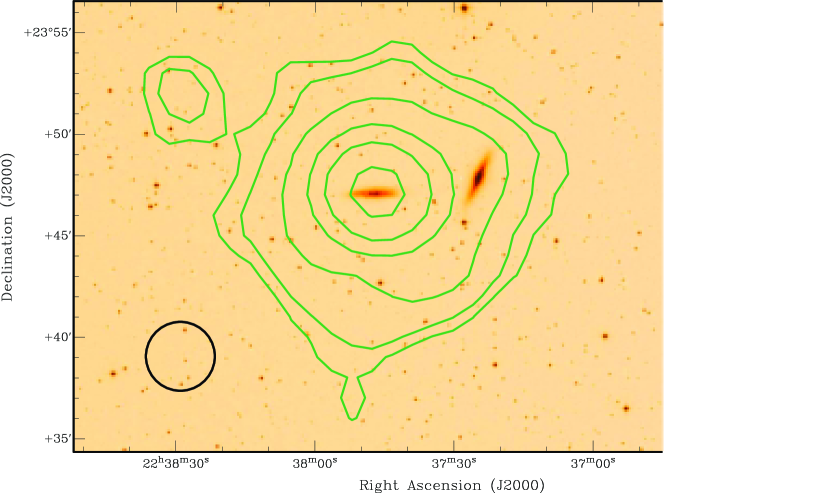
Figure 8 shows the integrated H i (moment 0) map of the group over the velocity range 1160 – 1520 km s-1, overlaid on the digitized sky survey image of the region. The two new sources can be seen, and it is also clear that the H i detected at the position of NGC 7332 is associated with NGC 7339.
No obvious tidal streams or H i clouds were found in the group. For a velocity width of 50 km s-1, the 5 detection limit would be a column density of cm-2 for features that fill the beam (FWHM = 23 kpc at the distance of NGC 7332). The limit for features that do not fill the beam will rise as the reciprocal of their filing factor; a feature with a column density of 1020 cm-2 would be seen down to a filling factor of 4 per cent, for instance.
5.1.1 NGC 7332 and NGC 7339
The flux of NGC 7339 was found by fitting a 2D Gaussian as described in Section 2.1. This gave a beam-corrected flux of Jy km s-1 and deconvolved major and minor axes (FWHM of the Gaussian) for the H i of arc seconds, at a position angle of degrees (north through east). The fitted position for the H i is 22:37:46.2, 23:47:12, 0.2 arc minutes from the position in NED (taken from the 2MASS catalog, Jarrett et al. 2000). The position angle is consistent with alignment of the neutral hydrogen with the optical disc of the galaxy.
Our results are consistent with the flux measured using the Lovell Telescope at Jodrell Bank by Staveley-Smith & Davies (1987) of Jy km s-1. From our determination of the size of the H i, the galaxy should appear as a point source to the Lovell Telescope (beam size arc minutes), so the Staveley-Smith & Davies flux should not be affected by the size of the source.
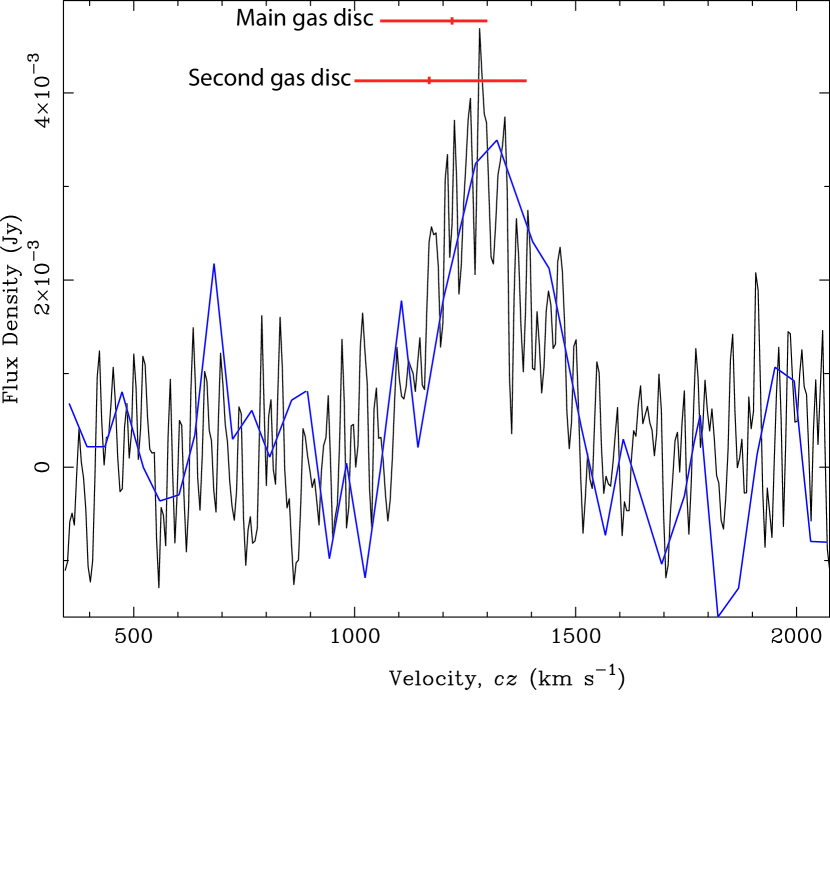
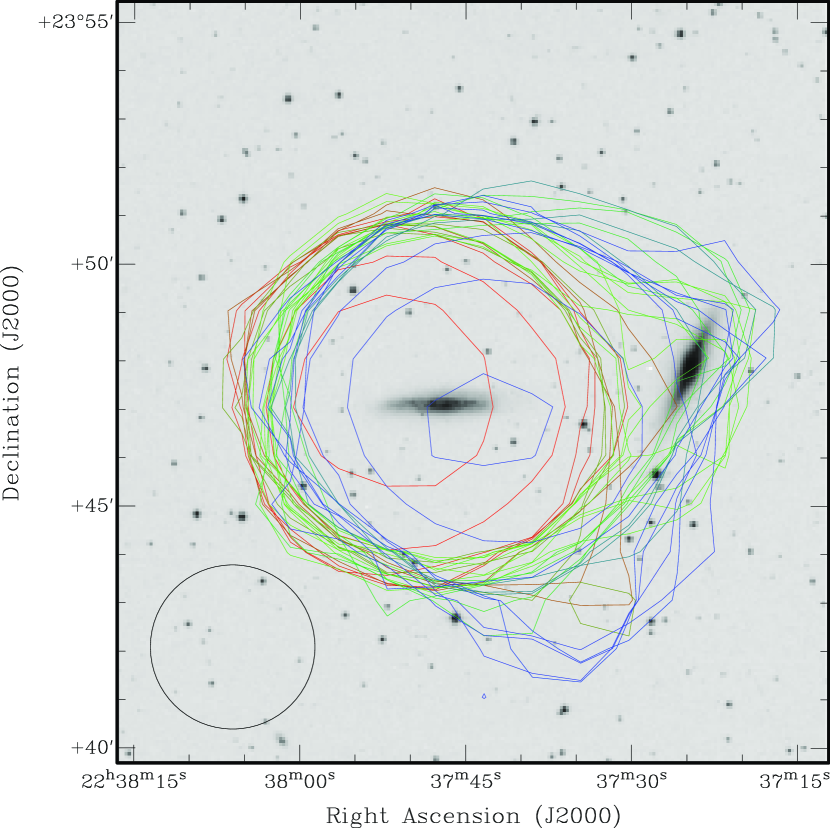
We find flux at the position of NGC 7332 (Fig. 9) which matches very well with the detection of Knapp et al. (1978). As the ALFA receiver has much lower sidelobes than the old circular feed used by Knapp et al., such a match would not be expected if their detection were merely NGC 7339 in the sidelobes, as has been suggested (Biermann, Clarke & Fricke 1979; Haynes 1981). Our mapping of the region (Figs. 8 and 10) shows that the gas disc of NGC 7339 is distorted, presumably by an interaction with NGC 7332. The gas at this position appears to be part of this distorted disc rather than a separate peak in the H i distribution associated with NGC 7332.
Morganti et al. (2006) detected a small gas cloud between NGC 7332 and NGC 7339 with the WSRT (FWHM ). This is too small and distant to account for the neutral hydrogen we see at the position of NGC 7332. It seems likely that we are seeing lower column-density gas not seen by the WSRT that is at or near the position of NGC 7332 – our observations are times more sensitive to low column-density gas that fills the beam (albeit with a larger beam). It is possible that the Morganti et al. cloud is part of a low column-density stream that is feeding the counter-rotating disc in NGC 7332.
5.1.2 Dwarf galaxies in the NGC 7332 group
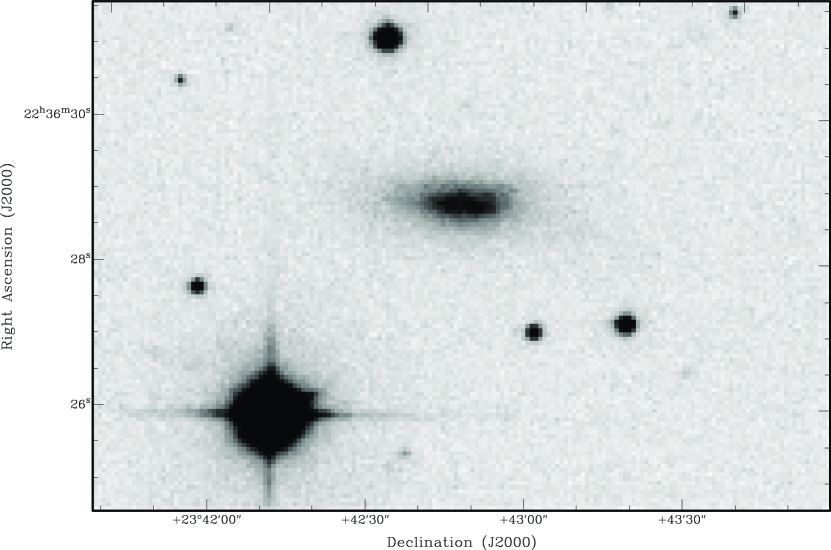
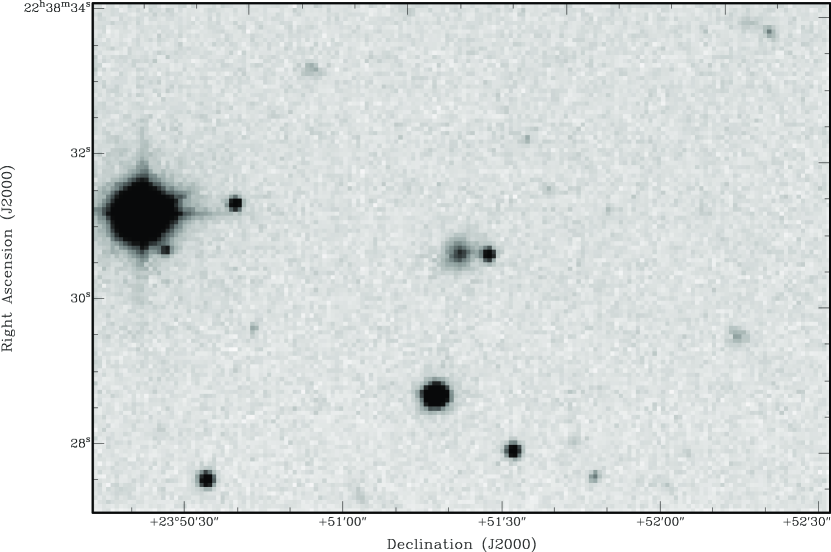
The two new H i sources reported here (AGES J223627+234258 and AGES J223829+235135) both lie in the same velocity range as NGC 7339, at around 1400 km s-1 and outside the area mapped by Haynes (1981). The spectra and optical (SDSS) images of these galaxies are shown in Figure 11. Both of the new galaxies appear to be narrow, single-peaked sources, which is consistent with their being dwarf galaxies. No tidal features can be definitively identified linking them to the NGC 7332/9 pair, but that these could be present at even lower column-densities than we reach here cannot be ruled out.


The data cube was examined at the positions of the candidate dSph galaxy identified in our optical survey of the region (see §4.2) and also at the positions of the candidate dSph galaxies KKR 73 and KKR 72 identified by Karachentseva et al. (1999). This search found no neutral hydrogen signals in the redshift range of the group.
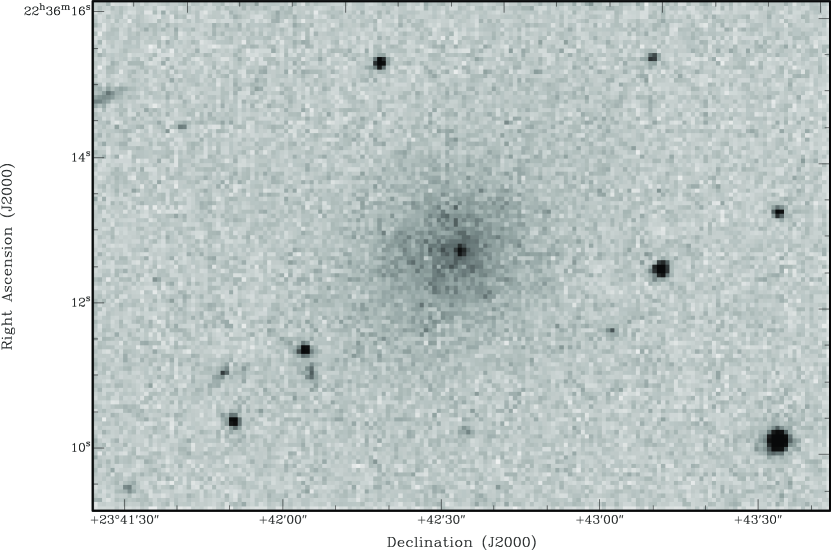
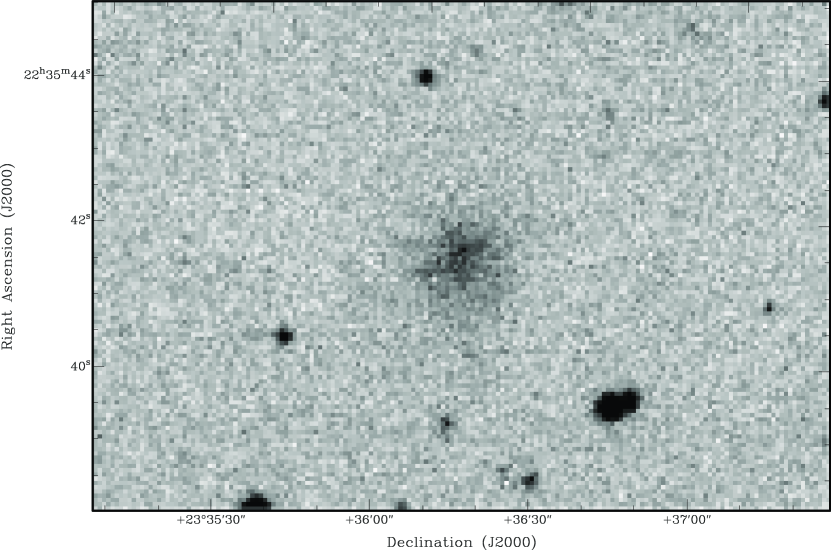
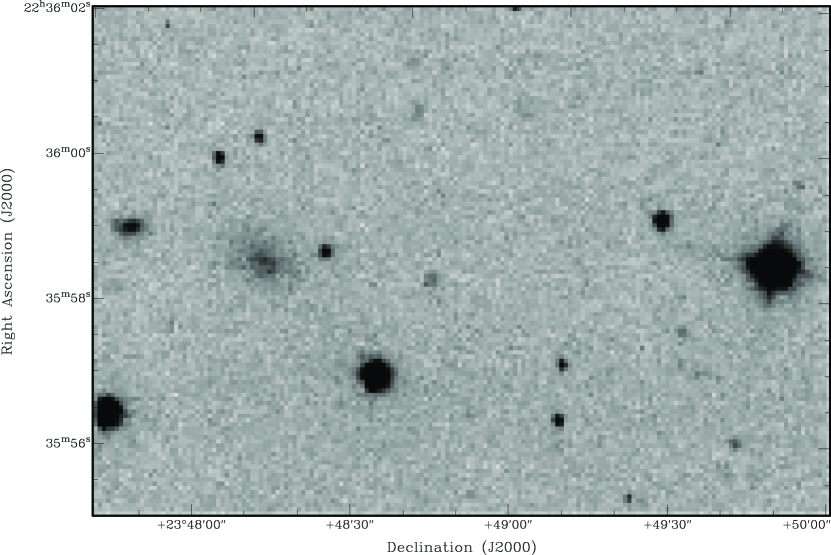
Our observations can place a limit on the H i mass of these three undetected galaxies (assuming them to be in the group) of , almost an order of magnitude lower than the Huchtmeier et al. (2000) observations. However, if these are dSph galaxies, as appears to be the case from their optical morphologies, then their non-detection at this limit is not surprising and we can neither confirm nor rule out their being members of the group. The spectra and DSS images are shown in Fig. 12.


Our H i mapping and optical search have brought the total number of possible dwarf galaxies in the group to five, two of which are gas-rich and are confirmed as group members. This gives an overall ratio of small to large galaxies of 1 – 2.5 and of small to large H i-rich galaxies of 2. The group appears, therefore, to be less dwarf-rich than would be expected from the HIPASS H i mass function (Zwaan et al. 2005), which (for our limit of ) predicts galaxies less than for each galaxy above . However, this under-density is less than a 2 result and thus may simply be due to random fluctiations.
5.1.3 Properties of the group galaxies
All of the members and potential members of the NGC 7332 group have been covered by the SDSS. We have carried out ellipse fitting on the SDSS -band data using the Starlink ESP package in order to find the surface-brightness profiles of the dwarf galaxies (including those from Karachentseva et al. 1999) and have made exponential fits to these profiles. These fits were extrapolated to find the total luminosity of the galaxy. colours were found using apertures fitted to cover as much of the galaxy as possible without including other sources. One galaxy (KKR 72) had a significant inner component on the surface-brightness profile, this was fitted with a second exponential after subtraction of the fit to the outer regions and was found to contribute negligibly to the overall luminosity.
The results of our fitting are shown in Table 4. Column (1) gives the ID of the galaxy. Columns (2) and (3) give the optical R.A. and declination, as found from the SDSS. Columns (4) and (5) give the central surface-brightness and the scale length for the exponential fit. Column (6) gives the extrapolated total -band magnitude. Column (7) gives the colour and Column (8) gives the -band absolute luminosity, corrected for a -band extinction of 0.15 mag. (from the IRSA extinction calculator).
We find that AGES J223627+234258 has a fairly low H i mass to light ratio for a dwarf irregular of . AGES J223829+235135 is more interesting, with a high H i mass to light ratio of , a very blue colour (), and a fairly low surface brightness (although not as low as the dSph candidates). From both its optical appearance and its high gas fraction, this would appear to be an underevolved dIrr galaxy, possibly similar to those studied in the Cen A group by Grossi et al. (2007).
The neutral hydrogen properties of the known or suspected members of the NGC 7332 group are given in Table 5. Column (1) gives the ID of the galaxy. Column (2) gives the velocity. This is the H i velocity measured from our datacube where the source is detected and the optical velocity from Simien & Prugniel (1997) for NGC 7332. Column (3) gives the velocity width at 50% of the peak flux. For the detections, this is measured from our datacube, otherwise it is the velocity width assumed in producing the flux limit (shown in italics). Column (4) gives the integrated flux, with an upper limit (based on a 3- limit of 2.25 mJy multiplied by the assumed velocity width) for non-detections and Column (5) gives this translated into a mass (or mass limit) at the adopted distance of 23 Mpc for the group. Column (6) gives the H i mass to light ratio derived from the measured H i mass and the SDSS -band luminosity. For NGC 7332 and NGC 7339, the -band luminosity has been calculated using the and magnitudes from the RC3 (de Vaucouleurs et al. 1991) and the transformation from the SDSS web pages, giving for NGC 7332 and for NGC 7339.
| ID | RA | Dec. | |||||
|---|---|---|---|---|---|---|---|
| (J2000) | (J2000) | (mag arcsec-2) | (arcsec) | (mag) | (mag) | () | |
| (1) | (2) | (3) | (4) | (5) | (6) | (7) | (8) |
| KKR 73 | 22:35:40.60 | 23:36:26.6 | |||||
| J223558+234825 | 22:35:58.04 | 23:48:22.4 | |||||
| KKR 72 | 22:36:11.75 | 23:42:43.46 | |||||
| AGES J223627+234258 | 22:36:27.82 | 23:42:59.4 | |||||
| AGES J223829+235135 | 22:38:29.69 | 23:51:31.1 |
| ID | Vel. | ||||
|---|---|---|---|---|---|
| (km s-1) | (km s-1) | (Jy km s-1) | () | ||
| (1) | (2) | (3) | (4) | (5) | (6) |
| KKR 73 | 50 aaValue used in estimating upper limits | ||||
| J223558+234825 | 50 aaValue used in estimating upper limits | ||||
| KKR 72 | 50 aaValue used in estimating upper limits | ||||
| AGES J223627+234258 | 1409 | 58 | |||
| NGC 7332 | 1172 | 300 aaValue used in estimating upper limits | |||
| NGC 7339 | 1341 | 327 | |||
| AGES J223829+235135 | 1414 | 32 |
5.2. NGC 1156 and the surrounding region.
NGC 1156 was analysed in the same manner as NGC 7339 (above). This gave a beam-corrected integrated flux of Jy km s-1, which is consistent with the values of Swaters et al. (2002) and Haynes et al. (1998). This gives an H i mass for the galaxy of . The fitted gaussian has deconvolved major and minor axes of and arc seconds respectively, at a position angle of degrees (north through east), which appears consistent with the Swaters et al. WSRT map of the galaxy. The fitted position of the galaxy is 02:59:52.3, 25:14:30 (J2000), 0.3 arc minutes from the NED position (taken from the 2MASS catalog, Jarrett et al. 2000).
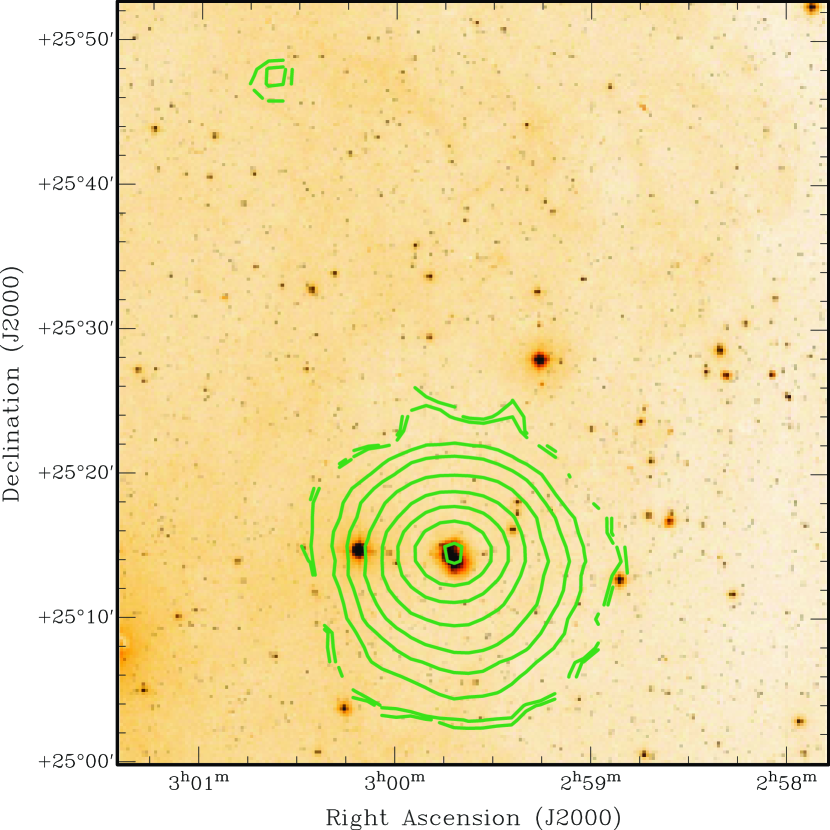
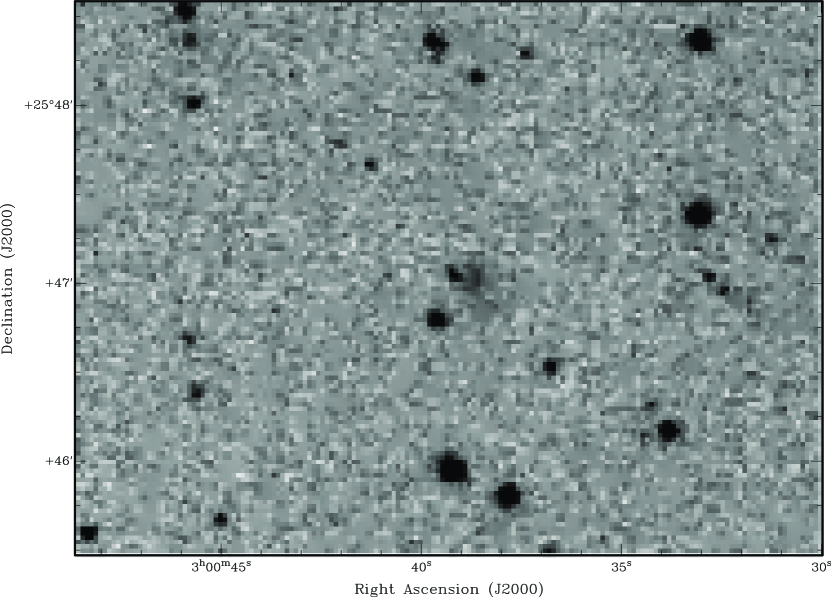
AGES J030039+254656 is a small dwarf galaxy found 35 arc minutes north-north-east of NGC 1156 (80 kpc in projection), as can be seen in Figure 13 showing the integrated H i (moment 0) map. An optical counterpart is clearly visible on the digitized sky survey (see Figure 14) at 03:00:38.6, 25:47:02 (J2000. It has an H i flux of Jy km s-1, giving it a neutral hydrogen mass of .
As stated in §4.5, we measure a SFR of yr-1 for AGES J030039+254656, compared to yr-1 for NGC 1156. The star-formation rate and H i mass are thus both around three order of magnitudes lower than NGC 1156. From the SuperCOSMOS plate-scanning survey (see §5.3), we find , and . Using the extinction maps of Schlegel et al. (1998), we find a very blue corrected color of and , giving .

The new galaxy is on the same side of the galaxy as the possible tidal tail reported by Hunter et al. (2002) as having been seen in VLA observations. This possible tail stretched 3′ south-east from an H i complex to the north-east of the galaxy that has an unsually large velocity spread. The tail is not seen in the AGES data, however as its length is less than the Arecibo beam size we would not expect to be able to distinguish it from the main body of H i in NGC 1156.
Following Verley et al. (2007), we can estimate the ratio of the tidal force being exerted currently by AGES J030039+254656 to the binding force of NGC 1156. If we assume that the H i mass can be related to the total mass by and use the H i radius of 212 arcseconds measured for NGC 1156 by Swaters et al. (2002), then:
| (2) |
Where is the mass of the interactor (AGES J030039+254646), is the mass of the primary (NGC 1156), is the diameter of the primary, and is the separation between the two galaxies.
This gives , where a value of or greater indicates significant tidal forces. The ratio would therefore have to be of order a thousand for this to be significant, that is AGES J030039+254656 would have to have a ratio of total mass to H i mass a thousand times higher than that of NGC 1156. It seems unlikely, therefore, that AGES J030039+254656, in its current position, could be exerting any significant tidal force on NGC 1156. However, the possibility of a past interaction cannot be ruled out.
From the radio velocity difference ( km s-1) and the projected separation of 80 kpc between NGC 1156 and AGES J030039+254656, the minimum dynamical mass of the pair is calculated to be , giving .
Having only one (known) dwarf companion, NGC 1156 appears to be well below the average. Between our limit of and , the HIPASS H i mass function (Zwaan et al. 2005) predicts dwarf galaxies for each galaxy of over , 3 above what we observe in NGC 1156.
5.3. The AGES Volume
The AGES cubes are bandpass-limited at a redshift of around 20,000 km s-1 and have a combined area of 10 deg2. This gives a comoving volume behind NGC 1156 and NGC 7332 of 24,000 Mpc3. In this volume we find a further 82 confirmed sources: 46 in the NGC 7332 cube and 36 in the NGC 1156 cube. All the sources have been associated with optical counterparts (see Table 6). Radio sources were correlated both with the APM777see http://www.ast.cam.ac.uk/{̃}apmcat/ on-line sky catalogue and with the SuperCOSMOS888see http://www-wfau.roe.ac.uk/sss/pixel.html sky surveys, yielding identifications within 85 arcseconds in all cases. Table 6 gives the positions of the optical counterparts, the offsets from the H i positions (H i–optical), the and magnitudes from the SuperCOSMOS survey (with errors of 0.3 mag for m 15; Hambly, Irwin & MacGillivray (2001), the H i to luminosity ratio, the literature name (if any), and the radial velocity (where available) from the NED database999see http://nedwww.ipac.caltech.edu (sources for quoted velocities are given in Table 6). For some galaxies in the NGC 1156 region, photometry is available from CFHT observations in and -bands with the megacam imager. Aperture photometry for these sources is given in footnotes to the table. It should be noted that for low surface-brightness galaxies, the SuperCOSMOS magnitudes may dramatically underestimate the luminosity (c.f. Disney & Phillipps 1983); an example of this can be seen with AGES J030014+255335, which has from the SuperCOSMOS photometry, while the deeper CFHT imaging gives a much more feasible .
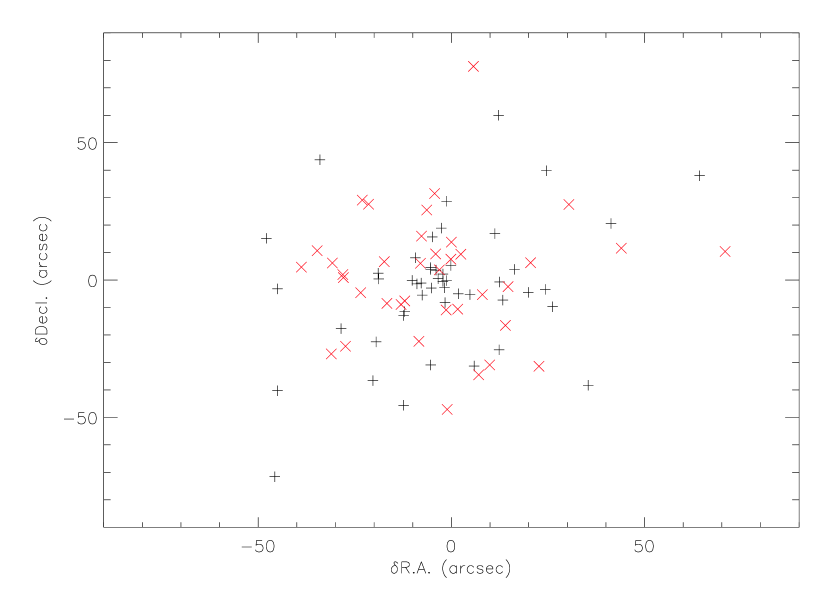
The distribution of separations can be seen in Fig. 15. The median offset between the H i source and the identified optical counterpart is 20 arcsec, with 90 per cent of counterparts falling within 51 arcsec of the H i source. It can be seen that the NGC 1156 field appears to have a less centrally condensed distribution of offsets than the NGC 7332 field, this is borne out by the statistics with the median offset being 26 arcsec in NGC 1156 and only 19 arcsec in NGC 7332. This may be simply natural variation, but could also be due to the strong and variable optical absorption (AB = 0.89 to 1.45 mags) in the NGC 1156 region which makes identification of optical counterparts difficult. Low surface-brightness counterparts could have been missed, or areas of high absorption on spatial scales smaller than that mapped by Schlegel et al. (1998) could have led to the correct counterpart being dismissed as being too faint.
Examining the corresondance between the errors on the H i positions (Table 1 and the the offsets between the optical and H i positions, it appears that 40/87 of the optical counterparts lie within the R.A. error and 47/87 within the declination error. Treating the RA and dec errors as defining an error ellipse rather than as indepdendent, only 22/87 sources fall within the error ellipse. In order to enclose 69 per cent of the sources (e.g. 1 sigma), the error radius needs to be increased by a factor of 2.95 – it thus appears that the error on the H i position underestimates the true positional uncertainty by around a factor of three.
| AGES ID | R.A. | Dec | Literature Name | Velocity | |||||
|---|---|---|---|---|---|---|---|---|---|
| (J2000) | (J2000) | (sec) | (arcsec) | () | (km s-1) | ||||
| J025512+243812 | 02:55:12.49 | 24:38:05.9 | -0.59 | 6.1 | 15.85 | 15.59 | CGCG 484-024 | 6996 | |
| J025626+254614 | 02:56:27.73 | 25:46:18.6 | -1.73 | -4.6 | 20.29 | 19.38 | |||
| J025737+244321 | 02:57:38.56 | 24:43:20.1 | -2.06 | 0.9 | 17.01 | 16.27 | 2MASX J02573860+2443194 | ||
| J025742+261755aaFainter galaxy closer at 02:57:43.6, 26:17:54 with . | 02:57:41.98 | 26:16:37.2 | 0.42 | 77.8 | 18.78 | 18.04 | AGC 122807 | 10370 | |
| J025753+255737bbFainter galaxy closer at 02:47:53.0, 25:57:34 with . | 02:57:52.68 | 25:58:11.5 | 0.52 | -34.5 | 17.08 | 16.69 | 2MASX J02575260+2558114 | ||
| J025801+252556ccCGCG 484-026 at 6966 km s-1 also lies within the beam at 02:58:03.2, 25:26:57 with . Spectrum appears to show two distinct components, consistent with two confused galaxies. | 02:57:59.12 | 25:25:26.9 | -1.70 | 29.1 | 16.05 | 15.50 | CGCG 485-002B | 6904 | |
| J025818+252711ddCFHT observations give , . | 02:58:18.23 | 25:26:54.9 | -0.57 | 16.0 | 16.54 | 15.61 | CGCG 485-004 | 10510 | |
| J025826+241836 | 02:58:22.35 | 24:18:24.4 | 3.24 | 11.6 | 18.01 | 16.97 | 2MASX J02582235+2418241 | ||
| J025835+241844 | 02:58:37.36 | 24:18:33.3 | -2.56 | 10.7 | 17.21 | 16.66 | 2MASX J02583738+2418331 | ||
| J025836+251656eeCFHT observations give , . | 02:58:35.51 | 25:16:48.3 | -0.01 | 7.6 | 16.05 | 15.14 | UGC 02442 | 10452 | |
| J025842+252348ffCFHT observations give , . | 02:58:44.47 | 25:23:41.8 | -2.27 | 6.2 | 16.19 | 15.24 | V Zw 298 | 10375 | |
| J025843+254521 | 02:58:43.83 | 25:45:28.5 | -1.23 | -8.5 | 18.74 | 17.63 | UGC 02445 | 7215 | |
| J025902+253518 | 02:59:00.29 | 25:35:12.7 | 1.51 | 6.3 | 18.31 | 17.34 | |||
| J025917+244756ggCFHT observations give , . Fainter galaxy closer at 02:59:16.4, 24:48:30 with , and other faint galaxies in the vicinity. | 02:59:17.48 | 24:48:43.1 | -0.08 | -47.1 | 19.80 | 19.29 | |||
| J025930+255419 | 02:59:31.58 | 25:54:12.3 | -1.28 | 6.7 | 17.02 | 16.11 | 2MASX J02593158+2554122 | ||
| J025936+253446hhCFHT observations give , . | 02:59:34.97 | 25:35:02.5 | 1.03 | -16.5 | 19.22 | 18.43 | |||
| J025942+251430iiToo bright for SuperCOSMOS photometry, RC3 value of used to calculate . | 02:59:42.30 | 25:14:16.2 | 0.00 | 13.8 | – | – | NGC 1156 | 375 | |
| J025953+254350jjFainter galaxy closer at 02:59:53.8, 25:43:58 with . | 02:59:51.33 | 25:44:21.4 | 1.67 | -31.4 | 20.43 | 18.32 | |||
| J025954+241323 | 02:59:54.98 | 24:13:30.6 | -0.89 | -7.6 | 16.25 | 14.75 | UGC 02457 | 10217 | |
| J030008+241600 | 03:00:08.12 | 24:15:50.6 | 0.18 | 9.4 | 17.43 | 16.06 | 2MASX J03000813+2415503 | ||
| J030014+250315kkCFHT observations give , . | 03:00:13.88 | 25:03:25.6 | 0.12 | -10.6 | 21.50 | – | |||
| J030025+255335 | 03:00:26.97 | 25:53:32.9 | -2.07 | 2.0 | 22.41 | 20.58 | |||
| J030027+241301llFainter galaxy closer at 03:00:25.6, +24:13:13 with , and other even fainter galaxies closer than this. | 03:00:21.98 | 24:12:50.6 | 5.22 | 10.4 | 18.63 | 17.88 | |||
| J030036+241156mmFainter galaxy closer at 03:00:37.3, +24:11:44 with . | 03:00:38.69 | 24:12:22.9 | -2.29 | -26.9 | 19.05 | 18.45 | |||
| J030039+254656 | 03:00:38.71 | 25:47:01.3 | 0.59 | -5.3 | 20.14 | 19.69 | |||
| J030112+242411 | 03:01:12.46 | 24:24:19.9 | -0.96 | -8.9 | 16.92 | 15.58 | 2MFGC 02447 | ||
| J030136+245602nnCFHT observations give , . Fainter galaxy closer at 03:01:37.2, +24:56:13 with . | 03:01:37.68 | 24:55:34.4 | -1.58 | 27.6 | 17.96 | 17.12 | |||
| J030139+254442 | 03:01:39.68 | 25:44:16.5 | -0.47 | 25.5 | 18.92 | 18.37 | |||
| J030146+254314ooCFHT observations give , . | 03:01:43.56 | 25:42:46.5 | 2.24 | 27.5 | 17.17 | 16.02 | 2MASX J03014354+2542474 | ||
| J030200+250030 | 03:02:00.32 | 25:00:52.3 | -0.62 | -22.3 | 17.68 | 16.65 | 2MASX J03020033+2500524 | ||
| J030204+254745 | 03:02:04.30 | 25:47:35.5 | -0.30 | 9.5 | 17.16 | 15.86 | FGC 0378 | 6786 | |
| J030234+244938 | 03:02:34.20 | 24:49:48.9 | -0.10 | -10.9 | 20.03 | 18.07 | |||
| J030254+260028 | 03:02:54.43 | 26:00:24.3 | -0.23 | 3.7 | 18.33 | 17.37 | LSBC F480-V04 | 10618 | |
| J030309+260407 | 03:03:08.92 | 26:03:35.5 | -0.32 | 31.5 | 18.41 | 17.90 | |||
| J030325+241510ppMay have star superposed. Some much fainter galaxies lie closer. | 03:03:27.46 | 24:15:05.3 | -2.86 | 4.7 | 16.78 | 15.81 | |||
| J030355+241922 | 03:03:53.63 | 24:19:24.4 | 1.08 | -2.4 | 19.56 | 18.94 | |||
| J030450+260045 | 03:04:49.57 | 26:01:15.8 | 0.73 | -30.9 | 19.37 | 18.39 | |||
| J030453+251532 | 03:04:55.12 | 25:15:56.1 | -2.02 | -24.1 | 17.81 | 17.07 | 2MASX J03045528+2515558 |
| AGES ID | R.A. | Dec | Literature Name | Velocity | |||||
|---|---|---|---|---|---|---|---|---|---|
| (J2000) | (J2000) | (sec) | (arcsec) | () | (km s-1) | ||||
| J223111+234146 | 22:31:11.09 | 23:41:17.2 | -0.09 | 28.7 | 18.15 | 17.13 | |||
| J223122+230436 | 22:31:21.98 | 23:04:41.0 | 0.13 | -5.0 | 16.77 | 15.97 | 2MASX J22312197+2304404 | ||
| J223143+244513 | 22:31:43.36 | 24:44:58.0 | -0.36 | 15.7 | 16.02 | 14.91 | MCG +04-53-003 | ||
| J223213+232657 | 22:32:13.17 | 23:26:58.1 | -0.57 | -1.1 | 16.76 | 15.92 | 2MASX J22321321+2326574 | ||
| J223218+235131qqA similar galaxy is found at 22:32:38.5 +23:11:41 with . | 22:32:19.88 | 23:51:48.7 | -2.08 | -17.7 | 15.98 | 15.11 | CGCG 474-005 | 11947 | |
| J223223+232613 | 22:32:20.82 | 23:26:51.3 | 2.58 | -38.3 | 18.84 | 17.87 | |||
| J223231+231601 | 22:32:31.98 | 23:16:37.6 | -1.48 | -36.6 | 15.80 | 11.03 | KUG 2230+230 | 11782 | |
| J223236+235555 | 22:32:36.55 | 23:55:54.4 | -0.25 | 0.5 | 16.41 | 15.43 | UGC 12072 | 7454 | |
| J223237+231209rrElongated image at 22:35:02.7 +23:52:55 with . | 22:32:37.59 | 23:12:39.9 | -0.39 | -30.9 | 17.23 | 16.63 | |||
| J223245+243816 | 22:32:44.30 | 24:38:41.4 | 0.90 | -25.4 | 17.98 | 18.15 | |||
| J223318+244545 | 22:33:16.60 | 24:45:41.1 | 1.19 | 3.9 | 16.76 | 15.75 | 2MASX J22331661+2445408 | ||
| J223320+230400 | 22:33:20.29 | 23:04:00.2 | -0.09 | -0.2 | 19.52 | 18.72 | |||
| J223329+231109 | 22:33:27.31 | 23:10:29.2 | 1.79 | 39.8 | 17.51 | 16.87 | |||
| J223342+242712 | 22:33:37.42 | 24:26:34.0 | 4.68 | 38.0 | 17.49 | 16.92 | |||
| J223355+243114 | 22:33:58.23 | 24:32:25.6 | -3.33 | -71.6 | 19.20 | 18.29 | |||
| J223415+233057 | 22:34:18.28 | 23:31:00.2 | -3.28 | -3.2 | 17.07 | 17.11 | |||
| J223449+240744 | 22:34:49.68 | 24:07:55.5 | -0.88 | -11.5 | 17.35 | 16.71 | |||
| J223502+235258ssMay have star superposed. Some much fainter galaxies lie closer. | 22:35:00.25 | 23:53:02.5 | 1.45 | -4.5 | 17.61 | 16.51 | |||
| J223502+242131ttSmaller and fainter galaxie s at 22:35:04.4, +24:21:57 with and at 22:35:17.5 +24:43:31 with . | 22:35:01.51 | 24:20:31.0 | 0.89 | 60.0 | 19.09 | 18.04 | |||
| J223506+233707 | 22:35:06.15 | 23:37:12.5 | -0.55 | -5.5 | 19.00 | 18.51 | |||
| J223517+244317uuAn elongated compact object lies at 22:38:29.65 +23:51:34.5, =19.75, =17.63, =17.15 | 22:35:14.88 | 24:43:26.7 | 1.91 | -9.7 | 17.93 | 17.17 | |||
| J223605+242407vvPair of interacting galaxies. is average for the pair. | 22:36:02.40 | 24:24:12.0 | 2.30 | -5.0 | 17.93 | 16.67 | |||
| 22:36:03.47 | 24:24:08.7 | 1.23 | -1.7 | 18.03 | 16.97 | ||||
| J223613+243504 | 22:36:13.39 | 24:34:59.5 | -0.39 | 4.5 | 16.75 | 15.31 | 2MASX J22361331+2434596 | ||
| J223627+234258 | 22:36:27.85 | 23:42:59.4 | -0.65 | -1.4 | 17.04 | 15.94 | |||
| J223628+245307 | 22:36:30.28 | 24:52:23.2 | -2.48 | 43.8 | 19.29 | – | |||
| J223631+240823 | 22:46:31.28 | 24:08:14.9 | -0.68 | 8.1 | 19.72 | 18.27 | |||
| J223701+225532 | 22:36:59.83 | 22:55:39.3 | 0.97 | -7.3 | 17.95 | 17.88 | KUG 2234+226 | 11511 | |
| J223715+232957 | 22:37:15.19 | 23:29:38.1 | -0.19 | 18.9 | 17.62 | 16.76 | |||
| J223739+244947 | 22:37:38.28 | 24:49:30.1 | 0.82 | 16.9 | 17.73 | 16.34 | |||
| J223741+242520 | 22:37:41.12 | 24:25:28.2 | -0.12 | -8.2 | 18.57 | 18.13 | |||
| J223745+225309wwMultiple faint galaxies in the region. | 22:37:48.49 | 22:52:53.8 | -3.49 | 15.2 | 21.39 | 19.37 | |||
| J223746+234712 | 22:37:47.24 | 23:47:12.1 | -0.74 | -0.1 | 13.50 | 11.60 | NGC 7339 | 1313 | |
| J223823+245207xxFainter galaxy closer at 22:38:23.1, +24:51:56 with . | 22:38:26.39 | 24:51:14.4 | 3.01 | 20.6 | 17.52 | 16.22 | |||
| J223829+235135 | 22:38:29.69 | 23:51:31.4 | -0.29 | 3.6 | 19.95 | – | |||
| J223834+231114 | 22:38:34.56 | 23:11:11.7 | -0.16 | 2.2 | 18.24 | 16.93 | |||
| J223839+234247yyFainter galaxy closer at 22:38:39.0, +23:42:56 with . | 22:38:39.38 | 23:42:49.9 | -0.38 | -2.9 | 17.89 | 16.26 | |||
| J223842+233156 | 22:38:43.20 | 23:32:08.9 | -0.90 | -12.9 | 18.13 | 16.91 | |||
| J223846+234923 | 22:38:47.02 | 23:49:45.5 | -1.42 | -22.5 | 19.56 | 18.76 | |||
| J223900+244752 | 22:38:59.75 | 24:47:57.3 | 0.35 | -5.3 | 16.75 | 15.11 | 2MASX J22385968+2447579 | ||
| J223905+240651 | 22:39:05.23 | 24:06:53.8 | -0.13 | -2.8 | 17.86 | 16.48 | |||
| J223946+242157zzFainter galaxy closer at 22:39:46.9, +24:21:33 with . | 22:39:47.20 | 24:22:42.6 | -0.90 | 45.6 | 17.12 | 15.45 | 2MASX J22394715+2422428 | ||
| J224005+244154 | 22:40:05.97 | 24:41:53.6 | -1.37 | 0.4 | 16.50 | 14.94 | NSF J224006.18+244157.1 | 11992 | |
| J224016+244658 | 22:40:16.69 | 24:46:54.1 | -0.39 | 3.9 | 16.62 | 15.22 | 2MASX J22401669+2446537 | ||
| J224024+243019 | 22:40:25.38 | 24:30:16.5 | -1.38 | 2.5 | 19.08 | 17.85 | |||
| J224025+243925 | 22:40:28.19 | 24:40:05.3 | -3.28 | -40.3 | 16.68 | 15.07 | 2MASX J22402816+2440055 | ||
| J224039+243229 | 22:40:39.16 | 24:32:29.5 | -0.16 | -0.5 | 18.77 | 18.06 | |||
| J224052+234635 | 22:40:52.34 | 23:46:29.3 | -0.01 | 5.3 | 19.37 | 19.01 | |||
| J224110+243500 | 22:41:09.47 | 24:34:28.7 | 0.43 | -31.3 | 18.22 | 16.87 | |||
| J224125+232228 | 22:41:24.59 | 23:22:28.7 | 0.91 | -0.7 | 14.95 | 14.09 | IC 5243 | 7144 |
5.3.1 Large Scale Structure
The large velocity range covered by AGES allows us to look at the large scale structure behind the targetted regions. Pie slices (Fig. 16 for NGC 7332 and Fig. 17 for NGC 1156) show the distribution of galaxies in declination and right ascension. These figures also show the previously known galaxies with redshifts, given in Table 6
| ID | Redshift (km s-1 | Reference |
|---|---|---|
| CGCG 484-024 | 6996 | Springob et al. 2005 |
| AGC 122807 | 10370 | Saintonge et al. 2008 |
| CGCG 485-002B | 6904 | Springob et al. 2005 |
| CGCG 484-026 | 7003 | Springob et al. 2005 |
| CGCG 485-003 | 10429 | Springob et al. 2005 |
| CGCG 485-004 | 10510 | Springob et al. 2005 |
| UGC 02442 | 10452 | Springob et al. 2005 |
| UGC 02445 | 7215 | Springob et al. 2005 |
| V Zw 298 | 10375 | Springob et al. 2005 |
| UGC 02457 | 10217 | Springob et al. 2005 |
| FGC 0378 | 6786 | Springob et al. 2005 |
| LSBC F480-V04 | 10618 | Saintonge et al. 2008 |
| CGCG 474-005 | 11947 | Springob et al. 2005 |
| KUG 2230+230 | 11782 | Springob et al. 2005 |
| UGC 12072 | 7454 | Springob et al. 2005 |
| 2MASX J22335064+2426393 | 10103 | Lawrence et al. 1999 |
| IC 5231 | 7473 | Gregory et al. 2000 |
| KUG 2234+226 | 11511 | Springob et al. 2005 |
| NSF J224006.18+244157.1 | 11992 | Aldering et al. 2007 |
| IC 5242 | 7145 | Springob et al. 2005 |
| IC 5243 | 7154 | Springob et al. 2005 |
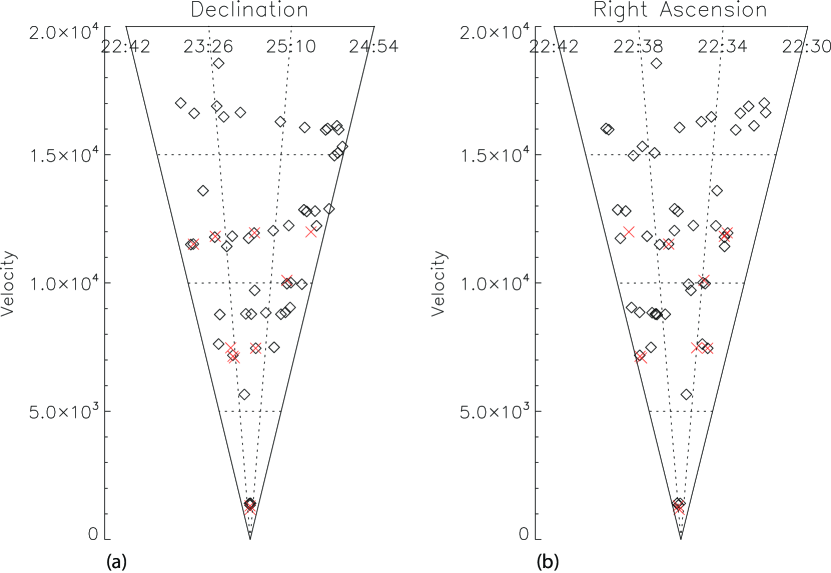
From Fig. 16, two structures appear to be present behind NGC 7332. The first, between 11000 and 12500 km s-1 can be seen most easily in the declination slice. The second, between 14000 and 18000 km s-1, can be seen in both slices. Fitting surfaces to the distribution of galaxies confirms that all 10 galaxies in the lower redshift range and 12 out of 14 in the higher redshift range fall within 300 km s-1 of the fitted surface. The two in the higher redshift range that do not seem to be in the structure both have R.A., while the other twelve are all at lower R.A.s.
The redshift range 2000 – 7000 km s-1 behind NGC 7332 is identified by Fairall (1990) as being through void regions. This region does appear to have a lower than normal galaxy density, with only one source (AGES J223506+233707) found. AGES J223506+233707 is a nearly edge-on spiral at a recessional velocity of 5655 km s-1, giving a distance of 80 Mpc for km s-1 Mpc-1. It does not seem disturbed either in its H i profile or in its optical (SDSS) appearance and has an H i mass of , similar to NGC 1156 and the Large Magellanic Cloud. From aperture photometry performed on SDSS images, it has a , giving and . This gives it a high . The color (again from aperture photometry on SDSS images) is , making this a rather blue galaxy – which is consistent with its high H i mass to light ratio and makes this appear to be an under-evolved galaxy. This may be a good example of a galaxy that has evolved in a void region without interacting significantly with other galaxies and thus has not evolved as fast as other galaxies, but determining whether this is the case would require much future study.
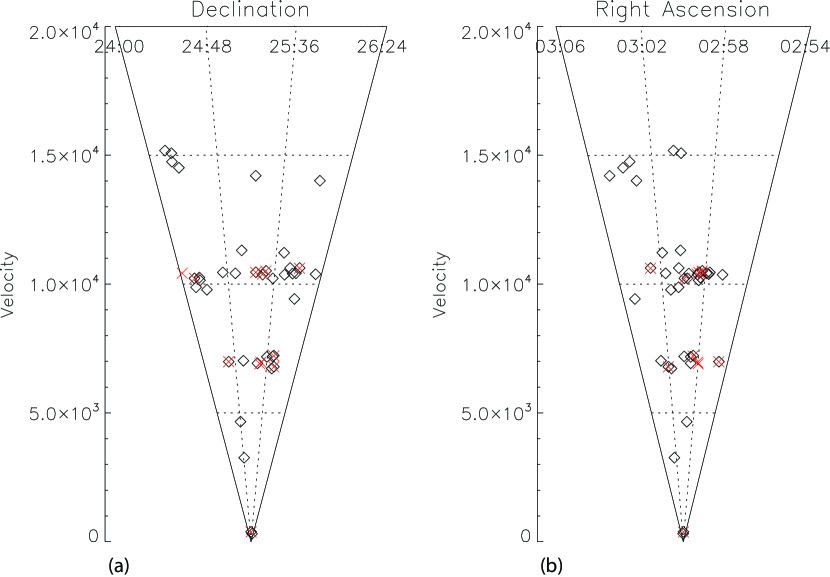
Figure 17 shows large scale structure in the NGC 1156 region, which is clearly present at km s-1 and just about 10 000 km s-1. However, unlike NGC 7332, these are both visible in literature redshift data, with galaxies around UGC 2445 making up the closer structure and the further structure including the WBL 091 and PPS2 187 groups (White et al. 1999; Trasarti-Battistoni 1998).
6. Conclusions
One of the principle goals of the AGES is to investigate the population of dwarf galaxies in different environments. Our H i mapping of the NGC 7332 group has revealed two new dwarf members, doubling the number of confirmed group members. An additional possible member has been found in an optical search, bringing the number of possible dSph companions without redshift information to three and the total number of possible galaxies in the group to seven. In the NGC 1156 group, we found a single dwarf companion that had not been previously catalogued. This does not appear to be large enough or currently close enough to NGC 1156 to have a significant effect on that galaxy.
In the background regions, we have detected 82 sources, 45 of which are entirely new discoveries. We find evidence of large scale structure in both cubes, with newly-discovered structures at and km s-1 behind NGC 7332 and confirm structures visible in the literature redshifts at and km s-1 behind NGC 7332. We also find one galaxy in the void region between 2000 and 7000 km s-1 behind NGC 7332.
Acknowledgements
We thank Mike Irwin for keeping the archive of the APM surveys available, Mark Calabretta and the ATNF for maintaining the Livedata and Gridzilla multibeam processing packages and for modifying them to read Arecibo data and Giuseppe Gavazzi and Luca Cortese for useful discussions and the optical spectroscopy observations presented in Section 4.3. We also thank the anonymous referee for his useful comments that helped improve the paper.
I.D.K. was partially supported by RFBR gants 10-02-00123 and RUS-UKR 09-02-90414.
This research is partly based on observations obtained at the Canda-France-Hawaii Telescope (CFHT) which is operated by the National Research Council of Canada, the Insitut National des Sciences de l’Univers of the Centre National de la Recherche Scientifique of France, and the University of Hawaii.
This research has made use of data obtained from the SuperCOSMOS Science Archive, prepared and hosted by the Wide Field Astronomy Unit, Institute for Astronomy, University of Edinburgh, which is funded by the UK Science and Technology Facilities Council.
References
- a (1) Aldering G. et al., 2007, Central Bureau Electronic Telegram, 991
- a (1) Ajhar E. A., Lauer T. R., Tonry J. L., Blakeslee J. P., Dressler A., Holtzman J. A.; Postman M., 1997, AJ, 114, 626
- a (1) Auld R. et al., 2006, MNRAS, 371, 1617
- a (1) Balkowski C., Chamaraux P., 1983, A&AS, 51, 331
- a (1) Barazza F. D, Binggelli B., Prugniel P., 2001, A&A, 373, 12
- a (1) Barnes D. G. et al., 2001, MNRAS, 322, 486
- a (1) Biermann P., Clarke J. N., Fricke K. J., 1979, A&A, 75, 19
- a (1) Burstein D., Krumm N., Salpeter E. E., 1987, AJ, 94, 88
- a (1) Condon J., Cotton W. D., Greisen E. W., Yin Q. F., Perley R. A., Taylor G. B., Broderick J. J., 1998, AJ, 115, 1693
- a (1) Cortese L. et al., 2008, MNRAS, 383, 1519
- a (1) De Vaucouleurs G., de Vaucouleurs A., Corwin H. G., But R. J., Paturel G., Fouque P., 1991, “Third Reference Catalogue of Bright Galaxies”, Springer-Verlag, New York.
- a (1) Disney M. J., Phillpps S., 1983, MNRAS, 205, 1253
- a (1) Fairall A. P., 1998, “Large Scale Structures in the Universe”, Wiley, New York.
- a (1) Falcón-Barroso J. et al., 2004, MNRAS, 350, 35
- a (1) Giovanelli R. et al., 2005, AJ, 130, 2613
- a (1) Gregory S. A., Tifft W. G., Moody J. W., Newberry M. V., Hall S. M., 2000, AJ, 119, 545
- a (1) Grossi M., Disney M. J., Pritzl B. J., Knezek P. M., Gallagher J. S., Minchin R. F., Freeman, K. C., 2007, MNRAS, 374, 107
- a (1) Hambly N. C., Irwin M. J., MacGillivray H. T., 2001, MNRAS, 326, 1295
- a (1) Haynes M. P., 1981, AJ, 86, 1126
- a (1) Haynes, M. P., van Zee, L., Hogg, D. E., Roberts, M. S., Maddalena, R. J., 1998, AJ, 115, 62
- a (1) Henning P. A. et al. 2010, AJ, 139, 2130
- a (1) Helou G., Soifer B. T., Rowan-Robinson M., 1985, ApJ, 298, L7
- a (1) Huchtmeier W. K., Karachentsev I. D., Karachentseva V. E., 2000, A&AS, 147, 187
- a (1) Hunter D. A., Rubin V. C., Swaters R. A., Sparke L. S., Levine S. E., 2002, ApJ, 580, 194
- a (1) James P. A. et al., 2004, A&A, 414, 23
- a (1) Karachentseva V. E., Lebedev V. S., Shcherbanovskij A. L., 1973, Communications of the Special Astrophysical Observatory of the USSR AS, No. 8.
- a (1) Karachentseva V. E., Karachentsev I. D., Richter G. M., 1999, A&AS, 135, 221
- a (1) Karachentsev I,; Musella I., Grimaldi A., 1996, A&A, 310, 722
- a (1) Kent B. R., Spekkens K., Giovanelli R., Haynes M. P., Momjian E., Cortes J. R., Hardy E., West A., 2009, Ap.J., 691, 1595
- a (1) Knapp G. R., Kerr F. J., Williams B. A., 1978, ApJ, 222, 800
- a (1) Koribalski B. S. et al., 2004, AJ, 128, 16
- a (1) Lawrence A. et al., 1999, MNRAS, 308, 897
- a (1) Morganti R. et al., 2006, MNRAS, 371, 157
- a (1) Moshir M. et al., 1990, “IRAS Faint Souce Catalog, Version 2.0”
- a (1) Plana H., Boulesteix J., 1996, A&A, 307, 391
- a (1) Putman M. E. et al., 2002, AJ, 123, 873
- a (1) Saintonge A., Giovanelli R., Haynes M., Hoffman, G. L., Kent B. R.,Martin A. M., Stierwalt S., Brosch N. , 2008, AJ, 135, 588
- a (1) Schlegel D. J., Finkbeiner D. P., Davis M., 1998, ApJ, 500, 525
- a (1) Simien F., Prugniel Ph., 1997, A&AS, 126, 519
- a (1) Springob C. M., Haynes M. P., Giovanelli R., Kent B. R., 2005, ApJS, 160, 149
- a (1) Tully R. B., Fisher J. R., 1988, Catalog of Nearby Galaxies, CUP, Cambridge
- a (1) Staveley-Smith L., Davies R. D., 1987, MNRAS, 224, 953
- a (1) Swaters R. A., van Albada T. S., van der Hulst J. M., Sancisi R.. 2002, A&A, 390, 829
- a (1) Tonry J. L. et al., 2001, ApJ, 546, 681
- a (1) Trasarti-Battistoni R., 1998, A&AS, 130, 341
- a (1) Verley S., Leon S., Verdes-Montenegro L., Combes F., Sabater J., Sulentic J., Bergond G., Espada D., García E., Lisenfeld U., Odewahn S. C., 2007, A&A, 472, 121
- a (1) White R. A., Bliton M., Bhavsar S. P., Bornmann P., Burns J. O., Ledlow M. J., Loken C., 1999, AJ, 118, 2014
- a (1) Yun M. S., Reddy N. A., Condon J. J., 2001, ApJ, 554, 803
- a (1) Zwaan M. A., Meyer M. J., Staveley-Smith L., Webster R. L., 2005, MNRAS, 359, 30L