Implication of the observable spectral cutoff energy evolution in XTE J1550-564
Abstract
The physical mechanisms responsible for production of the non-thermal emission in accreting black holes (BH) should be imprinted in the observational apperances of the power law tails in the X-ray spectra from these objects. Different spectral states exhibited by galactic BH binaries allow examination of the photon upscattering under different accretion regimes. We revisit the data collected by Rossi X-ray Timing Explorer (RXTE) from the BH X-ray binary XTE J1550-564 during two periods of X-ray activity in 1998 and 2000 focusing on the behavior of the high energy cutoff of the power law part of the spectrum. For the 1998 outburst the transition from the low-hard state to the intermediate state was accompanied by a gradual decrease in the cutoff energy which then showed an abrupt reversal to a clear increasing trend as the source evolved to the very high and high-soft states. The 2000 outburst showed only the decreasing part of this pattern. Notably, the photon indexes corresponding to the cutoff increase for the 1998 event are much higher than the index values reached during the 2000 rise transition. We attribute this difference in the cutoff energy behavior to the different partial contributions of the thermal and non-thermal (bulk motion) Comptonization in photon upscattering. Namely, during the 1998 event the higher accretion rate presumably provided more cooling to the Comptonizing media and thus reducing the effectiveness of the thermal upscattering process. Under these conditions the bulk motion takes a leading role in boosting the input soft photons. Monte Carlo simulations of the Comptonization in a bulk motion region near an accreting black hole by Laurent & Titarchuk (2010) strongly support this scenario.
Subject headings:
accretion, accretion disks—black hole physics—stars: individual (XTE J1550-564):radiation mechanisms: non-thermal—physical data and processes1. Introduction
The main feature of the X-ray spectrum observed from an accreting black hole (BH) is a strong non-thermal component phenomenologically described by a power law with exponential cutoff at energies above 20 keV. The origin of this emission is attributed to multiple Compton upscattering of the soft photons off energetic electrons near the compact object (Compton cloud). The balance between the thermal and non-thermal components in a source spectrum is the primary parameter used to define a BH spectral state. The low hard state (LHS) is dominated by the non-thermal power law emission with the photon index below 2.0, while in the high soft state (HSS) the spectrum exhibits strong thermal component with the temperature around 1 keV accompanied by a weak power law tail with index above 2.0. Transitions between these two states are classified as the intermediate state (IS). During rare episodes, when an accretion rate presumably reaches the Eddington limit, both thermal and power law components appear strong in the source spectrum. These episodes are identified as the very high state (VHS) (see Remillard & McClintock, 2006; Belloni, 2005; Klein-Wolt & van der Klis, 2008, for different flavors of BH states definitions). Constraining the nature of the spectral energy cutoff of the power law component is essential for understanding the processes occurring in the immediate vicinity of the accreting BHs.
Until recently, the observational picture on the extended spectral tails in BH X-ray binaries was based largely on the OSSE results presented by Grove et al. (1998). The main conclusion of the authors was that in the LHS the power law has a clear cutoff at 100 keV, while the HSS the non-thermal part of the spectrum shows no overturn at high energies. The presence of the non-thermal electron population was proposed as an explanation. The latest observational findings, however, reveal much more detailed picture of the cutoff energy behavior. Recently Motta et al. (2009) pointed out the specific pattern in the high energy cutoff evolution during the LHS-to-HSS spectral transition in GX 339-4. Namely, the authors reported the monotonic decrease of the cutoff from 120 keV in the LHS to 60 keV in the IS and then its sharp increase during the transition to the HSS. They also pointed out the close connection of the cutoff energy and the fast variability in the source lightcurve. The results by Motta et al. (2009) along with the cutoff energy behavior in XTE J1550-564 reported here present much more detailed cutoff phenomenology due to the RXTE frequent monitoring capability. These results show, in particular, that the cutoff energy exhibits a gradual evolution from the LHS to the HSS, which is difficult to reconcile with a simplistic no-cutoff picture for the HSS set forth by Grove et al. (1998).
An extended power law distribution of photons with respect to energy is a natural consequence of the repetitive scattering of the “seed” input photons off energetic electrons. The thermal Comptonization is a result of upscattering when electrons have a Maxwellian energy distribution. In this case the resulting power law has a high energy turnover at the energy approximately twice of the electron temperature (Hua & Titarchuk, 1995). While the thermal Comptonization is able to explain the X-ray spectra of accreting BHs in the LHS, it encounters difficulties in the case of the HSS. To account for the steep extended power-law tail one needs to invoke geometrical configuration for the Comptonization region with the temperature of 100-150 keV and optical depth of 0.1, which is shown to be very unstable [see Titarchuk & Lyubarskij (1995), Borozdin et al. (1999)]. On the other hand, Laurent & Titarchuk (1999), hereafter LT99, showed that these steep power-law photon distributions (with the photon index higher than 2.0) are produced in the convergent flow into compact objects when the infalling plasma temperature does not exceed 10 keV. The characteristic feature of these spectra is an abrupt cutoff at the energy of the order of keV (where is the electron mass and the speed of light respectively) and can be modeled by an exponential cutoff with the folding energy in the range of 200400 keV.
In Shaposhnikov & Titarchuk (2009, hereafter ST09) we presented an observational evidence that the bulk inflow motion phenomenon is imprinted in the correlation pattern of the spectral and variability properties in the form of the photon index saturation effect. It was shown that in the IS state, when the thermal and bulk motion Comptonization (BMC) are equally important, the index depends strongly on the mass accretion rate , indicated either by the spectrum normalization or by the frequency of quasi-periodic oscillations (QPOs). However, in the HSS spectral index tends to saturate. High mass accretion rate in this state provides an effective cooling mechanism for the Compton cloud. Therefore, the BMC effect should take over the thermal process. The saturation effect was found in a number of the galactic BH binaries including XTE J1550-564. It was also shown analytically and numerically that the slope of the radiation spectrum resulting from the BMC in a cold converging inflow does not depend on the for high mass accretion rates [Titarchuk & Zannias (1998), LT99].
In this Paper we study, in detail, the behavior of the energy spectrum observed by RXTE from the galactic BH candidate XTE J1550-564 during two outbursts occurred in 1998 and 2000. Specifically, we concentrate on the phenomenology of the high energy cutoff of the power law spectral component. These two events were significantly different in strength, with the 2000 outburst being much weaker and shorter in duration. During the 1998 outburst the source started out off the LHS, evolving through IS and reached VHS during an extremely bright flare. The source then returned to IS and transited into HSS later on [Sobczak et al. (2000), ST09]. The high energy cutoff evolution during this episodes is completely consistent with pattern reported by Motta et al. (2009) for the hard-to-soft transition in GX 339-4 in 2007. On the other hand, during the 2000 event the source did not exhibit the VHS and the peak flux was five times lower than that during the 1998 outburst. We find both similarities and differences in the behavior of the high energy part of the spectrum during the events. We explain the observed evolution of the cutoff folding energy by a varying contribution of the thermal and the BMC processes in the upscattering the input soft photons. We find that the cutoff phenomenology is in the excellent agreement with the scenario when thermal and bulk motion Comptonization processes dominate the LHS and HSS correspondingly, while in the IS both processes are equally important in boosting the low energy photons.
In the next section we describe the data reduction and analysis. In §3 we offer the interpretation of the power-law efold energy () evolution in terms of interplay between thermal and non-thermal (bulk motion) Comptonization. Discussions and conclusions follow in §4 and §5 respectively.
2. Observations and data reduction
We use archival RXTE data from the HEASARC111http://heasarc.gsfc.nasa.gov/. For the 1998 outburst we analyzed 64 observations starting on September, 7 1998 (MJD 51063.67) and ending on November, 2 1998 (MJD 51119.0), when the source have completed a transition to the HSS. For the 2000 data we analyzed 47 pointed observations performed from April 10, 2000 (MJD 51644.5) to June 11, 2000 (MJD 51706.0), when the source was in the decay LHS. The first comprehensive analysis of 1998 and 2000 outbursts from XTE J1550-564 was presented in Sobczak et al. (2000). We refer the reader to this paper for an exhaustive account of the data and general phenomenology.
The RXTE/PCA spectra have been extracted and analyzed in the 3.0-50 keV energy range using the most recent release of PCA response calibration (ftool pcarmf v11.7). The relevant deadtime corrections to energy spectra have been applied following “The RXTE Cook Book” recipe.The HEXTE spectra were extracted and analyzed in 20-250 keV energy range. The PCA and HEXTE energy spectra were modeled jointly using XSPEC 12.0 astrophysical spectral analysis package. To fit PCA spectra we used the sum of the generic Comptonization component (BMC model, see Titarchuk, Mastichiadis & Kylafis, 1997) and a GAUSSIAN with the energy keV, which is presumably related to the iron emission line. The model was also modified by the interstellar absorption, using the WABS model in XSPEC, with a hydrogen column value fixed at the Galactic value given by nH HEASARC tool (Dickey & Lockman, 1990) and by a high energy cut-off HIGHECUT. The upper limit of 1.2 keV was applied to the width of the GAUSSIAN. The high energy cutoff component accounts for the exponential overturn of the spectrum. Systematic error of 1.0% have been applied to the analyzed spectra.
The BMC model, initially intended to treat the bulk motion Comtonization, does not specify the particular properties of the upscattering electron gas and therefore is valid for the thermal Comptonization, as well as for the case of the hybrid thermal/non-thermal Comptonization. It describes the outgoing spectrum as a convolution of input “seed” black body spectrum having normalization and the color temperature with a Green function for Comptonization process. Similarly to the ordinary BBODY XSPEC model, the normalization is a ratio of the total input black body luminosity to the square distance
| (1) |
The resulting model spectrum is also characterized by the parameter related to the Comptonized fraction and the Green’s function spectral index where is the photon index.
There are two reasons for using the BMC model. First, the model by the nature of the model is applicable to the general case when photons gain energy not only due to thermal Comptonization but also via dynamic or bulk motion Comptonization (see LT99, Titarchuk, Mastichiadis & Kylafis, 1997; Shaposhnikov & Titarchuk, 2006, for details). The second reason is that the BMC norm is tied to the normalization of the “seed” black body, presumably originated in the disk. The direct correspondence of to the mass accretion rate in the disk follows from the accretion disk theory (see e.g. Shakura & Sunyaev, 1973). The adopted spectral model successfully describes the most spectra. The reduced -statistic value , where is the number of degrees of freedom for a fit, is less or around 1.0 for more than 95% of the observations. For a small fraction (less than 3%) of spectra with high counting statistic the value of reaches 1.5. However, it never exceeds the rejection limit of 2.0.
3. Evolution of the spectral properties during state transitions in XTE J1550-564
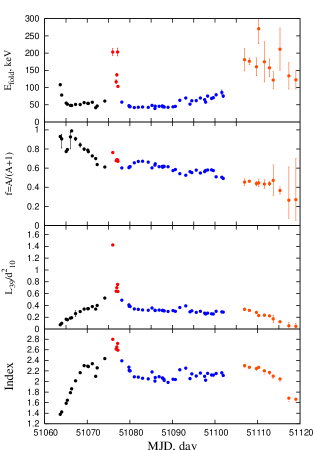
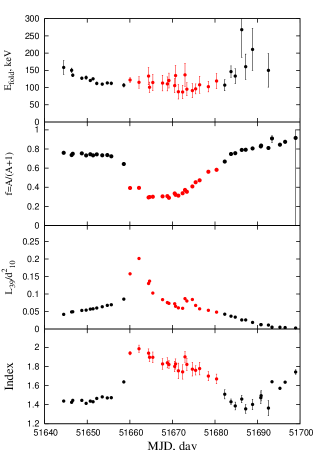
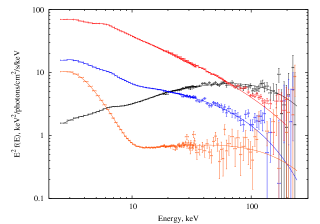
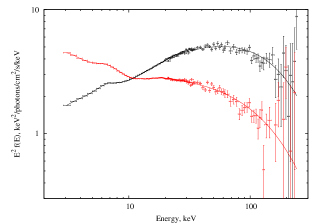
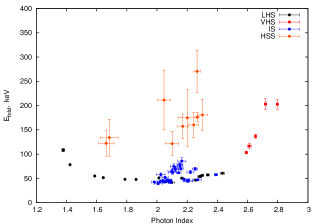
Evolution of the relevant spectral parameters during the 1998 and 2000 outbursts is presented in Figures 1 and 2 correspondingly. Different spectral states are separated by color. In Figure 3 we illustrate the spectral evolution in XTE J1550-564 for two outbursts. The top panel presents four representative unfolded spectra for the 1998 outburst, color coded according to the color legend of Figure 1, i.e. black for the LHS, blue for the IS, red for the VHS and orange for the HSS. The 2000 event is presented in the bottom panel by two spectra for the LHS in black and the HSS in red.
The 1998 outburst of XTE J1550-564 developed as follows. The outburst started on MJD 51063 and went through the initial LHS and then entered the hard IS. Energy dropped from 100 keV to 50 keV during this LHS-IS phase. In Figure 1 this stage is marked by filled black circles. The source exhibited a strong VHS flare on MJD 51076, when photon index peaked at 2.8 marked by red points. On the other hand showed sharp peak up to 250 keV during the flare. We indicate these data by red color. After the flare the source returned to the IS with index and dropped back to 50 keV. For the next 20 days we observe smooth evolution towards the HSS with the photon index increasing to 2.4 (in Fig. 1 the IS-HSS transition data is shown in blue). The cutoff folding energy shows a steady upward trend during this period, accompanied by a slow decrease of the Comptonized fraction . On about MJD 51105 the source entered the HSS, when jumped to 150-200 keV range (see red points in Fig. 1). During the IS-HSS stage the source presumably went through the strong surge of accretion. This cold accretion flow provided strong photon cooling for the innermost part of the accretion flow which is manifested by an increase of the photon index.
The behavior of the source during the 2000 outburst was clearly different (see Figure 2). First, there was no VHS flare and the maximum flux reached for this outburst was five times less than that during the 1998 event. The initial LHS and the hard IS are indicated by black data points from MJD 51644 to MJD 51659. During this state we observe a decrease of energy similar to the LHS-IS stage during the 1998 outburst, however, reaching down only to 100 keV values apart to the 50 keV bottom plateau during 1998 event seen in Fig. 1. No apparent increase of is obseved for the transition to the HSS on MJD 51660. Much lower overall flux observed during this outburst is probably indicating a lower mass accretion rate in the disk with respect to the 1998 event. This is also reflected in the behavior of the source spectrum. Namely, the index does not grow higher than 2.0 but stays high. This is presumably due to the constant presence of the hot thermal Comptonizing media throughout the transition. The level of cold matter supply in the disk is not sufficient to completely cool down the Compton Cloud in the case of 2000 outburst.
4. Discussion
LT99 studied the Comptonization of the soft radiation in the converging inflow (CI) onto a (BH) using Monte Carlo simulations. The fully relativistic treatment has been implemented to reproduce the spectra. The authors show that the spectrum of the soft state can be described as the sum of a thermal (disk) component and the convolution of some fraction of this component with the CI upscattering spread (Green’s) function. The latter is seen as an extended power law tail at the energies much higher than the characteristic energy of the soft photons and plasma temperature. LT99 also demonstrate the stability of the power-law index (the photon index ) over a wide range of the plasma temperatures 010 keV and mass accretion rates (higher than 2 in Eddington units) due to upscattering and photon trapping in the CI. However, the spectrum is practically the same as that produced by standard thermal Comptonization when the CI plasma temperature is of the order of 50 keV (typical for the LHS) and the photon index is around 1.7. LT99 also demonstrate that the change of the spectral shapes from the HSS to the LHS is clearly related to electron temperature and optical depth of the bulk inflow [see also Titarchuk, & Fiorito (2004) for more details of the dependence]. When the mass accretion rate of the flow increases the plasma temperature decreases and thus the high energy cutoff decreases until the effects of bulk motion Comptonization becomes dominant. Then increases with mass accretion rate and weakly depends on plasma temperature if it is less than 10 keV.

Observationally this bulk motion effect can be seen as a non-monotonic behavior versus index . This is exactly what is observed during the initial LHS and the VHS flare of the 1998 outburst in Figure 4). Namely, the black and red data points follow clear non-monotonic curve starting from 150 keV and the index of 1.4 in LHS, decreasing to the minimum of 50 keV for the index of 2.0 at the start of the VHS flare and reaching the of 200 keV and the index of 2.9 at the VHS peak. Then the source returned back to the values reached at the minimum. During the IS which followed after the VHS flare the source took a different path marked by smaller index values and transitioned to the HSS, shown by orange points. The versus index shows clearly two-parametric behavior in this case. One possible explanation for this fact is that the VHS episode was triggered by strong surge of the matter with lower angular momentum, which then serves as a second parameter to define the source behavior.
During the 2000 outburst (Fig. 5) we see only the first part of this pattern. Namely, decreases and reaches down to its minimum value of 100-120 keV while does not exceed 2.0 (compare Figs. 4 and 5). It is interesting to note that the HSS data (orange points) for the 1998 outburst in Figure 4 lie close to the 2000 outburst data for the HSS in Figure 5 (red points). This indicates that during transition to the canonical HSS similar accretion regimes are at work for both outbursts, while during the VHS flare a unique and more rare accretion regime occurred possibly due to a supercritical accretion of matter having significant fraction of the low angular momentum gas. The red VHS track on Figs. 4, 6 and 7 is therefore can be attributed to the higher indexes and fluxes due to strong cooling and higher energy release to unusually high mass accretion rate during this state.
We see the strong evidence of the bulk motion effect when the cutoff folding energy first decreases with photon index and then reaching minimum value in the range of 50-100 keV starts to increase to about 200 keV and when index values start to saturate at . On the other hand, Farinelli & Titarchuk (2010) recently show using a number of BeppoSAX observation of accreting neutron stars that photon index of Comptonization spectra does not show strong evolution and, in fact, stays almost constant around 2.0 from the hard to soft states of neutron star binaries.
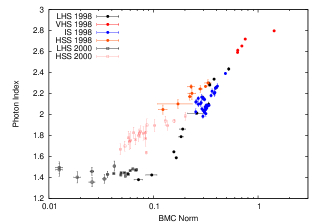
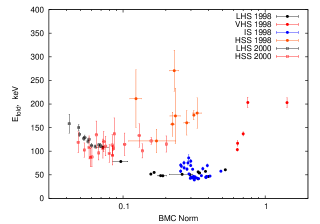
Laurent & Titarchuk (2010) simulated spectra of the converging flow using Monte Carlo method. If was found that the cutoff folding energy of the power law component first decreases and then increases as a function of mass accretion rate . The cutoff energy reaches its minimum around . Also they demonstrate that index of the emergent spectrum monotonically increases for and then saturates in complete agreement with the observed picture shown in Figure 6, where is indicator of the disk mass accretion rate . Because of this monotonic behavior of index vs mass accretion rate up to the saturation level we expect that the same behavior pattern vs and consequently vs should be seen in the observations. In Figure 7 we present the observed dependence of as a function of (). As one can see, the observed patterns of and versus shown are strikingly similar to the Monte Carlo simulated folding energy and photon index evolution as a function of mass accretion rate [see Fig. 8 and details of these simulations in Laurent & Titarchuk (2010)].
Grove et al. (1998) reported the results of OSSE observations of seven transient black hole candidates : GRO J0422+32, GX 339-4, GRS 1716-249, GRS 1009-45, 4U 1543-47, GRO J1655-40, and GRS 1915-105. They found that the last four objects exhibit a “power-law gamma-ray state” with a soft spectral index () and no evidence for a spectral break. For GRO J1655-40, the lower limit on the break energy was found to be 690 keV. Although Grove et al. (1998) suggested that the HSS spectra detected by OSSE are consistent with bulk-motion Comptonization in the convergent accretion flow, Zdziarski et al. (2001) reinterpreted the same data and ruled out the bulk Comptonization as an origin of the HSS spectra because the emergent spectra extended to energies up to 700 keV.
Thus, the question is which instrument more accurately describes the phenomenology of the high energy cutoff, OSSE or RXTE/HEXTE. Answer to this question is crucial for understanding and interpretation of the BH spectral signatures. In that respect we note that the typical OSSE spectrum require exposure time of about s, i.e more than a day, whereas a typical PCA/HEXTE observation lasts a few kiloseconds, two orders of magnitude shorter than a usual OSSE exposure. OSSE observed GRO J1655-40 during the 1996 outburst VHS when the source was very variable on time scales of hours and longer. In this case the long accumulation time can result in a biases in the observed spectral shape. We suggest that the presence of the extended power law up to keV in OSSE spectra can be a result of the long accumulation time scale when specific details of the spectra can be biased particularly at high energies.
Despite the fact that HEXTE is not sensitive above 300 keV, it is able to sample the source spectrum with much more detailed temporal resolution. Our analysis of the PCA/HEXTE from XTE 1550-564 indicates that VHS spectra do show exponential turnover at energies about 200 keV (see Fig. 4). Moreover, our results clearly show that the cutoff energy changes gradually from the LHS through the IS towards the HSS. It is worth noting that Motta et al. (2009) concluded that the cutoff power law in the PCA/HEXTE spectrum of GX 339-4 is most likely due to one spectral component. These facts indicate strongly that HEXTE more be more reliable source of information on the hard tails of X-ray spectra, at least, up to 300 keV than OSSE. In other words, one can definitely see an exponential rollover at energies about 200-300 keV in HEXTE data, it may not be seen in OSSE data due to lower counting statistics and bias introduced by long exposures.

In fact, there are more physical arguments in favor of the PCA/HEXTE versus OSSE observations of the hard X-ray tails in BH X-ray binaries. Specifically, the dynamical time scale which is related to the magneto-acoustic oscillations of the Compton cloud (CC) is where is the CC size and is the magnetoacoustic velocity [see e.g. Titarchuk & Shaposhnikov (2005)]. With the assumption that the characteristic CC size in the HSS is of the order of , where is the Schwarchild radius, is a BH mass in solar units, keV) cm s-1, is Compton cloud temperature, we obtain that keV)] s. Thus, the dynamical time scale of the Compton cloud is only one order magnitude shorter than the PCA/HEXTE spectrum accumulation time of s and we rather believe that the PCA/HEXTE spectra including its turnover more precisely describe the shape of the high/soft emergent spectra than that by the OSSE spectra averaged over 2 magnitudes longer periods.
5. Conclusions
We present further observational evidence supporting the theory of the bulk motion (converging) flow near accreting black holes. We show that when sufficient cooling is provided by the mass supply from the donor star, the Comptonizing media is completely cooled down and the origin of the extended cutoff power law is due to non-thermal bulk motion process. The energy of the high energy cutoff observed during 1998 outbursts from XTE J1550-564 (as well as during 2007 outburst from GX 339-4 reported by Motta et al. (2009)) behaves in striking agreement with the bulk motion scenario.
Combined with the previously reported effect of index saturation in BH X-ray binaries (Shaposhnikov & Titarchuk, 2009) the cutoff energy behavior provides robust observational signature of the bulk motion region near the accreting object. As a direct consequence of the specific drain properties of the BH, this signature presents the most direct observational evidence of the existence of the astrophysical black holes.
The RXTE data for this work was aquired through HEASARC. Authors acknowledge the support of this research by NASA grant NNX09AF02G.
References
- Belloni (2005) Belloni, T. 2005, Interacting Binaries: Accretion, Evolution, and Outcomes, 797, 197
- Borozdin et al. (1999) Borozdin, K., Revnivtsev, M., Trudolyubov, S., Shrader, C. & Titarchuk, L. 1999, ApJ, 517, 367
- Chakrabarti & Titarchuk (1995) Chakrabarti, S.K. & Titarchuk, L. 1995, ApJ, 455, 623
- Dickey & Lockman (1990) Dickey,J.M., & Lockman, F.J. 1990, ARAA, 28, 215
- Farinelli & Titarchuk (2010) Farinelli, R. & Titarchuk, L. 2010, A&A, submitted
- Fiorito & Titarchuk (2004) Fiorito, R. & Titarchuk, L. 2004, ApJ, 614, L113
- Grove et al. (1998) Grove, J.E. et al. 1998, ApJ, 500, 899
- Homan et al. (2006) Homan, J., Wijnands, R., Kong, A., Miller, J. M., Rossi, S., Belloni, T., & Lewin, W. H. G. 2006, MNRAS, 366, 235
- Hua & Titarchuk (1995) Hua, X-M. & Titarchuk, L. 1995, ApJ, 449, 188
- Klein-Wolt & van der Klis (2008) Klein-Wolt, M., & van der Klis, M. 2008, ApJ, 675, 1407
- Laurent & Titarchuk (2010) Laurent, P. & Titarchuk, L. 2010, ApJ, submitted
- Laurent & Titarchuk (1999) Laurent, P. & Titarchuk, L. 1999, ApJ, 511, 289 (LT99)
- Laurent & Titarchuk (2007) Laurent, P. & Titarchuk, L. 2007, ApJ, 656, 1056
- Motta et al. (2009) Motta, S., Belloni, T., & Homan, J. 2009, MNRAS, 400, 1603
- Remillard & McClintock (2006) Remillard, R. A., & McClintock, J. E. 2006, ARA&A, 44, 49
- Rodriguez, Corbel & Tomsick (2003) Rodriguez, J., Corbel, S., & Tomsick, J. A. 2003, ApJ, 595, 1032
- Rodriguez et al. (2003) Rodriguez, J., Corbel, S., & Tomsick, J. A. 2003, ApJ, 595, 1032
- Rybicki & Lightman (1979) Rybicki, G. B., & Lightman, A. P. 1979, Radiative processes in astrophysics, New York, Wiley-Interscience
- Shakura & Sunyaev (1973) Shakura, N.I., & Sunyaev, R.A. 1973, A&A, 24, 337
- Shaposhnikov & Titarchuk (2006) Shaposhnikov, N., & Titarchuk, L. 2006, ApJ, 643, 1098 (ST06)
- Shaposhnikov & Titarchuk (2009) Shaposhnikov, N., & Titarchuk, L. 2009, ApJ, 699, 453
- Shrader & Titarchuk (1999) Shrader, C., & Titarchuk, L.G. 1999, ApJ, 521, L121
- Sunyaev & Titarchuk (1980) Sunyaev, R.A. & Titarchuk, L.G. 1980, A&A, 86, 121
- Sobczak et al. (2000) Sobczak, G. J., McClintock, J. E., Remillard, R. A., Cui, W., Levine, A. M., Morgan, E. H., Orosz, J. A., & Bailyn, C. D. 2000, ApJ, 544, 993
- Titarchuk, & Fiorito (2004) Titarchuk, L.G. & Fiorito, R. 2004, ApJ, 612, 988
- Titarchuk & Lyubarskij (1995) Titarchuk, L., & Lyubarskij, Y. 1995, ApJ, 450, 876
- Titarchuk, Mastichiadis & Kylafis (1997) Titarchuk, L., Mastichiadis, A., & Kylafis, N. D., 1997, ApJ, 487, 834
- Titarchuk & Shaposhnikov (2005) Titarchuk, L. & Shaposhnikov, N. 2005, ApJ, 626, 298
- Titarchuk & Zannias (1998) Titarchuk, L. & Zannias, T. 1998, ApJ, 493, 863
- Zdziarski et al. (2001) Zzdiarski, A.A. ., et al. 2001, ApJ, 554, L45