Radiation thermo-chemical models of protoplanetary discs. III. Impact of inner rims on Spectral Energy Distributions
Abstract
We study the hydrostatic density structure of the inner disc rim around Herbig Ae stars using the thermo-chemical hydrostatic code ProDiMo. We compare the Spectral Energy Distributions (SEDs) and images from our hydrostatic disc models to that from prescribed density structure discs. The 2D continuum radiative transfer in ProDiMo includes isotropic scattering. The dust temperature is set by the condition of radiative equilibrium. In the thermal-decoupled case the gas temperature is governed by the balance between various heating and cooling processes. The gas and dust interact thermally via photoelectrons, radiatively, and via gas accommodation on grain surfaces. As a result, the gas is much hotter than in the thermo-coupled case, where the gas and dust temperatures are equal, reaching a few thousands K in the upper disc layers and making the inner rim higher. A physically motivated density drop at the inner radius (“soft-edge”) results in rounded inner rims, which appear ring-like in near-infrared images. The combination of lower gravity pull and hot gas beyond 1 AU results in a disc atmosphere that reaches a height over radius ratio of 0.2 while this ratio is 0.1 only in the thermo-coupled case. This puffed-up disc atmosphere intercepts larger amount of stellar radiation, which translates into enhanced continuum emission in the 3–30 m wavelength region from hotter grains at 500 K. We also consider the effect of disc mass and grain size distribution on the SEDs self-consistently feeding those quantities back into the gas temperature, chemistry, and hydrostatic equilibrium computation.
keywords:
planetary systems: protoplanetary discs1 Introduction
Circumstellar discs result from the conservation of angular momentum of a collapsing cloud that forms a star at its centre. Discs of various masses and shapes are observed by direct imaging or spectroscopically from low mass brown dwarfs (e.g., Mohanty et al. 2004; Jayawardhana et al. 2003; Natta & Testi 2001) to massive O stars (Cesaroni et al., 2007). Spectral Energy Distributions (SED) are dominated by dust grain emission and are influenced by disc geometry, dust mass, and grain properties. Herbig Ae stars (2–4 M⊙) are among the most studied pre-main-sequence stars surrounded by discs because of their isolated nature and intrinsic brightness (Natta et al., 2007). Their SEDs can be classified into two groups according to the ratio between the far-infrared to near-infrared fluxes (Meeus et al., 2001). Group I objects show much stronger far-infrared to near-infrared fluxes than their group II counterparts. Early versions of the so-called puffed-up rim model succeeded to explain the dichotomy (Dullemond et al., 2001; Dominik et al., 2003). Group II objects are discs that absorb most of the stellar flux within a geometrically thin but optically thick inner rim that faces directly the star, depriving the outer disc of radiation. As a consequence the cold outer disc is geometrically flatter and emits only weakly in the far-infrared. On the contrary, the rim in group I objects does not block enough stellar radiation and the outer disc flares, emitting strongly in the far-infrared. 2D dust radiative transfer models that include dust scattering and hydrostatic disc structure assuming that the gas temperature is equal to the dust temperature, which is derived from dust energy balance, underestimate the flux in the near-infrared around 3 m (Meijer et al., 2008; Vinković et al., 2006). Vinković et al. (2006) invoke the presence of an optically thin halo above the inner disc to explain the excess 3m emission. The problem arises from the insufficient height of the inner rim: a low rim results in a small emitting area. Acke et al. (2009) require that their inner rims have to be 2 to 3 times higher than the hydrostatic solution that fits the SEDs using a Monte-Carlo radiative transfer code. Models that incorporate detailed physics of grain evaporation with grain size distribution change the structure of the inner rim and help to fit simultaneously the SED and near-infrared interferometric data (e.g., Isella et al. 2006; Tannirkulam et al. 2007; Kama et al. 2009). The structure of the inner rim impacts the overall shape of the SEDs up to a few tens of microns. Initially discovered in the SED of Herbig Ae discs, inner rim emission is also detected in discs around classical T Tauri stars (Muzerolle et al., 2003). Observationally, the inner disc geometry is varied. Studies with sufficient baseline-coverage show that either an extra optical thin component is required (Tannirkulam et al., 2008; Benisty et al., 2010) or that the rim has a skewed asymmetric geometry (Kraus et al., 2009). A detailed modelling of these observations is beyond the scope of this paper.
All previous studies of inner disc rims share the assumption that the gas and dust temperatures are equal to simplify the radiative transfer. In these studies, the temperatures are derived from the dust energy balance. This assumption is valid in the inner optically thick parts of disc midplanes where gas and dust are thermally coupled via inelastic collisions, a phenomenon called thermal accommodation (Tielens, 2005). In all other parts, the gas is mostly heated by hot photoelectrons from dust grains and Polycyclic Aromatic Hydrocarbons and attains higher temperatures than the dust. The inner rim is naturally higher than when the gas and dust temperature are equal and the overall disc surfaces are more vertically extended (Woitke, Kamp & Thi, 2009). In discs where the gas and dust are well mixed (i.e. without dust settling), the change in geometry can affect the SEDs.
In this paper we explore the possibility that inner rims are much higher when the gas and dust temperatures are computed separately and self-consistently. A detailed study of inner and outer thermo-chemical disc structures together with emission lines in Herbig Ae discs is presented in Kamp et al. (2010). In this paper we focus on the inner disc structure of well-mixed discs and the images and spectral signature of inner rims in the infrared.
This paper is organized as follow. We briefly describe the ProDiMo code and recent additions to the code such as the SED and image calculation in Sect. 2. We proceed with a presentation of our fiducial disc model, the disc parameters that are varied, and the fixed-structure disc model in Sect. 3. We then present and discuss the results of our simulations when the gas and dust temperatures are equal (thermal-coupled models) and when they are computed self-consistently (thermal-decoupled models), varying several disc parameters in Sect. 4. Finally, we conclude about the inner disc structures and their effects on the SEDs in Sect. 5.
| stellar mass | 2.2 M⊙ | |
| stellar luminosity | 32 L⊙ | |
| effective temperature | 8600 K | |
| disc mass | 10-2, 10-3, 10-4 M⊙ | |
| disc inner radius | 0.5, 1 , 10 AU | |
| disc outer radius | 300 AU | |
| vertical Column density power law index | 1, 1.5, 2 | |
| gas to dust mass ratio | 100 | |
| dust grain material mass density | 2.5 g cm-3 | |
| minimum dust particle size | 0.05 m | |
| maximum dust particle size | 10, 50, 200 m | |
| dust size distribution power law | 3.5 | |
| H2 cosmic ray ionization rate | 1.7 10-17 s-1 | |
| ISM UV field w.r.t. Draine field | 0.1 | |
| abundance of PAHs relative to ISM | 0.01, 0.1 | |
| viscosity parameter | 0.0 |
2 ProDiMo code description
ProDiMo is designed to compute self-consistently the (1+1)D hydrostatic disc structure in thermal balance and kinetic chemical equilibrium. The disc can be active or passive depending on the choice of the viscosity parameter . We first provide here a brief description of ProDiMo. Interested readers are referred to Woitke, Kamp & Thi (2009) to find detailed explanations of the physics implemented in the code. We continue by giving the rational for the “soft-inner edge” surface density profile implemented in ProDiMo. We finish by explaining the computation of Spectral Energy Distributions and images, which is a new feature of the code.
2.1 General description
The code iterates the computation of the disc density, gas and dust temperature, and chemical abundance structure until successive iterations show less than 1% change.
The iteration starts with a given hydrostatic disc structure computed from the previous iteration or from an assumed structure. The dust radiative transfer module computes the dust temperatures and the disc local mean specific intensities . The specific intensities are used to calculate the photochemical rates. The 2D dust radiative-transfer module of ProDiMo has been benchmarked against other codes that use other methods such as Monte-Carlo (Pinte et al., 2009). The continuum radiative transfer includes absorption, isotropic scattering, and thermal emission. The grains are assumed spherical. The lack of anisotropic scattering prevents us to calculate completely accurate images. In case of anisotropic scattering, one expects the far upper part of the disc rim to be dimmer (backward scattering) than the near lower part (forward scattering). However, isotropic scattering is sufficiently accurate for generating precise SEDs.
The grains have sizes between and and follow a power-law size distribution with index . The absorption and scattering efficiencies are computed using Mie theory for compact spherical grains. Grains of different sizes are assumed to have the same temperature. This limitation in our model does not prevent the comparison between self-consistently computed gas temperature models (thermal-decoupled models) and models with (thermo-coupled models). In this paper, the dust composition and size distribution are constant throughout the disc. We adopt the interstellar dust optical constants of Laor & Draine (1993) for amorphous grains since we are only interested in modelling featureless broad SEDs.
Once the dust temperature and the continuum mean specific intensities are known, the gas temperature and chemical concentrations are consistently calculated assuming thermal balance and kinetic chemical equilibrium. The chemistry network includes 71 gas and ice species. The chemical reactions comprise photo-reactions (photoionization and photodissociation) with rates computed using cross-sections and specific intensities calculated by the 2D radiative transfer module, gas phase reactions, gas freeze-out and evaporation (thermal desorption, photodesorption, and cosmic-ray induced desorption), and H2 formation on grain surfaces. The chemical rates are drawn from the UMIST 2007 database (Woodall et al., 2007) augmented by rates from the NIST chemical kinetic website. The photo-cross-sections are taken from van Dishoeck et al. (2006). The H2 formation on grain surfaces follows the prescription of Cazaux & Tielens (2004) with the most recent grain surface parameters.
The gas can be heated by line absorption and cooled by line emission. The line radiative transfer is computed via the escape probability formalism. The gas is also heated by interactions with hot photoelectrons from dust grains and Polycyclic Aromatic Hydrocarbons and with cosmic rays. Thermal accommodation on grain surfaces can either heat or cool the gas depending on the temperature difference between the gas and the dust (Tielens, 2005). Thermal accommodation dominates at high densities and optical depths, driving the gas and dust towards the same temperatures.
Finally, the gas temperature and molecular weight determine the local pressure at each grid point, which is used to modify the disc structure according to the vertical hydrostatic equilibrium. The new disc structure is compared to the previous one to check for convergence.
2.2 Soft Inner edge
The radial dependence of the vertical column density is assumed to deviate from a power-law in the innermost layers, and is implemented according to the ”soft-edge”-description of Woitke, Kamp & Thi, 2009, (see Section 3.1). We assume that the gas has been pushed inwards by the radial pressure gradients around the inner edge, and has spun up according to angular momentum conservation, until the increased centrifugal force balances the radial pressure gradient. The procedure results in a surface layer in radial hydrostatic equilibrium at constant specific angular momentum where the column density increases gradually from virtually zero to the desired value at the point where we start to apply the power-law. The thickness of this ”soft” edge results to be typically a few 10% of the inner radius .
2.3 Spectral Energy Distribution calculation

Based on the results of the continuum dust radiative transfer solution (see Woitke et al. (2009), Sect. 4) we have developed a new ProDiMo module for SED and image calculation based on formal solutions of the dust continuum radiative transfer equation along a bundle of parallel rays that cross the disc at given inclination angle with respect to the disc rotation axis. The rays start at an image plane put safely outside of the disc. The ray direction and the 3D origin of the image plane are given by
| (1) |
and
| (2) |
where is a large enough distance to be sure that the plane cannot intersect the disc. The plane is aligned along the two perpendicular unit vectors
| (3) |
and
| (4) |
The rays are organized in log-equidistant concentric rings in the image plane, using polar image coordinates (,). The 3D starting point of one ray , with image coordinates and , is given by
| (5) |
From these ray starting points , the radiative transfer equation is solved backwards along direction , using an error-controlled ray integration scheme as described in Woitke, Kamp, & Thi (2009, Sect 4.2). The source function and opacity structure in the disc have been saved from the previous run of ProDiMo’s main dust radiative transfer. The resulting intensities at the location of the image plane, , are used to directly obtain monochromatic images.
To retrieve the spectral flux under inclination , we integrate over the image plane as
| (6) |
where is the object’s distance. We use and rays. Due to the log-spacing of the concentric rings, the method safely resolves even tiny structures originating from the inner rim.
3 Disc parameters
3.1 Fiducial model
We modelled circumstellar discs around one typical Herbig Ae star with effective temperature of 8600 K, mass of 2.2 M⊙, and luminosity of 32 L⊙. In this study, we did not try to fit the SED of any particular object. The input stellar spectrum is taken from the PHOENIX database of stellar spectra (Brott & Hauschildt, 2005).
The discs are illuminated from all sides by a low interstellar medium UV flux () in addition to the stellar flux. We chose a low flux because previous studies do not take interstellar UV flux into account. The stellar flux dominates over the standard interstellar flux in the inner disc by orders of magnitude.
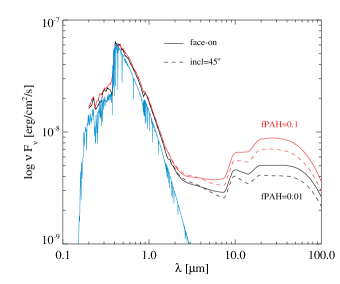
The abundance of PAH () in discs controls the gas temperature and the disc flaring, which in turn affects the dust temperature. The exact value of can only be constrained by a simultaneous fit to the broad SED and the PAH features for a specific object. We chose an arbitrary low abundance (1%) and tested the effects on the SED for the fiducial model with =0.1.
The only parameters that were allowed to change are the disc total mass ( 10-4, 10-3, and 10-2 M⊙), the surface power-law index ( with 1.0, 1.5, and 2.0), the disc inner radius ( 0.5, 1 , 10 AU), and the maximum grain radius ( 10, 50, 200 m).
We chose as our fiducial value for the surface density profile index. Surface density profiles as steep as for the inner disc are a signature of self-gravitating discs (Rice & Armitage, 2009). However, we consider discs with maximum disc mass over star mass ratio of 4.5 10-3. A recent derivation of the Solar Nebula also gives a steep surface density profile inside 50 AU (Desch, 2007). Shallower decreases in surface density () are more commonly observed for the outer disc ( 50 AU).
The density falls off at following the “soft-edge” model described earlier. The minimum grain size is kept at 0.05 m. The power-law index of the dust grain size distribution follows the standard interstellar value of -3.5. A power-law index of -3.5 results from grain-grain collision theory (Dohnanyi, 1969). We mimic grain growth by varying the maximum grain radius from the fiducial value of 50 to 200 m. We also studied the effect of smaller grains by setting the maximum grain size to 10 m.
The choice of the inner disc radius at 0.5 AU was dictated by disc accretion and dust grain physics. A disc is truncated at the co-rotation radius in the absence of a magnetic field or of a low-mass companion, either star, brown dwarf, or giant planet, orbiting close to the star. The co-rotation radius is defined as the distance from the central star where the Keplerian disc rotates at the same speed than the star photosphere (e.g., Shu et al. 1994). Assuming a photospheric rotation speed km s-1, typical of young stars (van den Ancker et al., 1998), we obtain 0.08-0.76 AU for M⊙. Dust grains do not exist above their sublimation temperature, which is around 1500 K for silicate grains. The dust sublimation radius is the distance from the star beyond which dust exists and can be estimated by where the ratio of the dust absorption efficiency at stellar temperature to its emission efficiency at the dust sublimation temperature , is the mean grain radius and is the Stefan constant. For large silicate grains (m), is relatively insensitive to the stellar effective temperature and close to unity because most stellar radiation lies at wavelengths shorter than the grain radius. For smaller grains, the value of is significantly increased (Monnier & Millan-Gabet, 2002). For one micron grains, the sublimation radius in our fiducial model is AU assuming (passive disc) and (large grains). For grains as small as 0.05 m in radius, we obtain and AU. The inner disc location at 0.5 AU in our models is within the theoretical range of inner disc radii. Moreover grains as small as 0.05m can survive at 0.5 AU. Large luminosity ( L⊙) fast rotators ( km s-1) like 51 Oph (with = 260 L⊙ and =2675 km s-1 ) may have a inner dust-free gas-rich region between the co-rotation radius and the dust sublimation radius (Thi et al., 2005; Tatulli et al., 2008). Another example is AB Aur where the corotation radius is smaller than the sublimation radius for the small grains but not for the large grains. Observational evidence of an inner gas-rich dust-poor region has been found for this object (Tannirkulam et al., 2008).
We also chose to simulate discs with inner radius at 1 and 10 AU to model typical gaps possibly created by planets. The outer radius was set at 300 AU. By default passive discs are modelled (i.e., 0). Since we focus on young discs the standard interstellar medium value of 100 for the gas-to-dust mass ratio was adopted for all models. The gas and dust were assumed well-mixed with no dust settling. The common model parameters are summarized in Table 1 with the parameters for the fiducial model printed in boldface . For each parameter set, the code was run in the thermal-coupled mode () and thermal-decoupled mode in a 50 50 non-regular grid. An example of the location of the grid points is given by Kamp et al. (2010). All SEDs were computed for a source located at the typical distance of 140 pc at two inclinations: face-on (0 degree) and 45 degree.
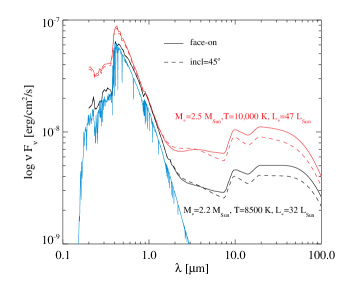
The stellar properties of our fiducial model differs from earlier studies (= 10000 K, =2.5 M⊙, and =47 L⊙). We plot in Fig. 9 the density structure, photospheric height, near-infrared image, and SEDs for two inclinations using the earlier studies properties. The disc structures and SEDs are different for the two sets of stellar parameters. The hotter disc atmosphere around the 47 L⊙ star flares much more than the disc around the lower luminosity star. The infrared luminosity is increased but the shape of the SED does not differ much as the stellar luminosity is increased.
3.2 Fixed-structure model
| reference scale height | 0.72 | AU | |
| reference radius | 10 | AU | |
| flaring index | 1.2, 1.25, 1.3 |
We compare the results of the hydrostatic disc models to the results of a fixed-structure model. The disc height is parametrised by the functional , where is the reference scale height at reference radius and is the flaring index. The scale height is used to compute the density at height by . The value of the parameters are given in Table 2 and were chosen such that the SED matches that produced by the fiducial model with “soft-edge” and computed by thermal balance. We vary the value of the flaring index between 1.2 and 1.3 to study its effects on the SEDs. All the other parameters are the same than for the fiducial model.
4 Results and discussion
In this section, we discuss the effects on the disc gas density structure and SED when we vary a few parameters in the case of equal gas and dust temperature and when they are computed independently. We first show the structure and SED of the fiducial disc in Sect. 4.1. The SEDs and images of the fixed-structure disc is discussed in Sect. 4.2. We continue by addressing the effects on the disc structure and SED when we use the “soft-edge” versus the “sharp-edge” inner rim prescription (Sect. 4.3), when we vary the surface density profile (Sect. 4.5), the disc mass (Sect. 4.6), the maximum grain size (Sect. 4.7), and the inner disc radius (Sect. 4.8).
4.1 Fiducial model
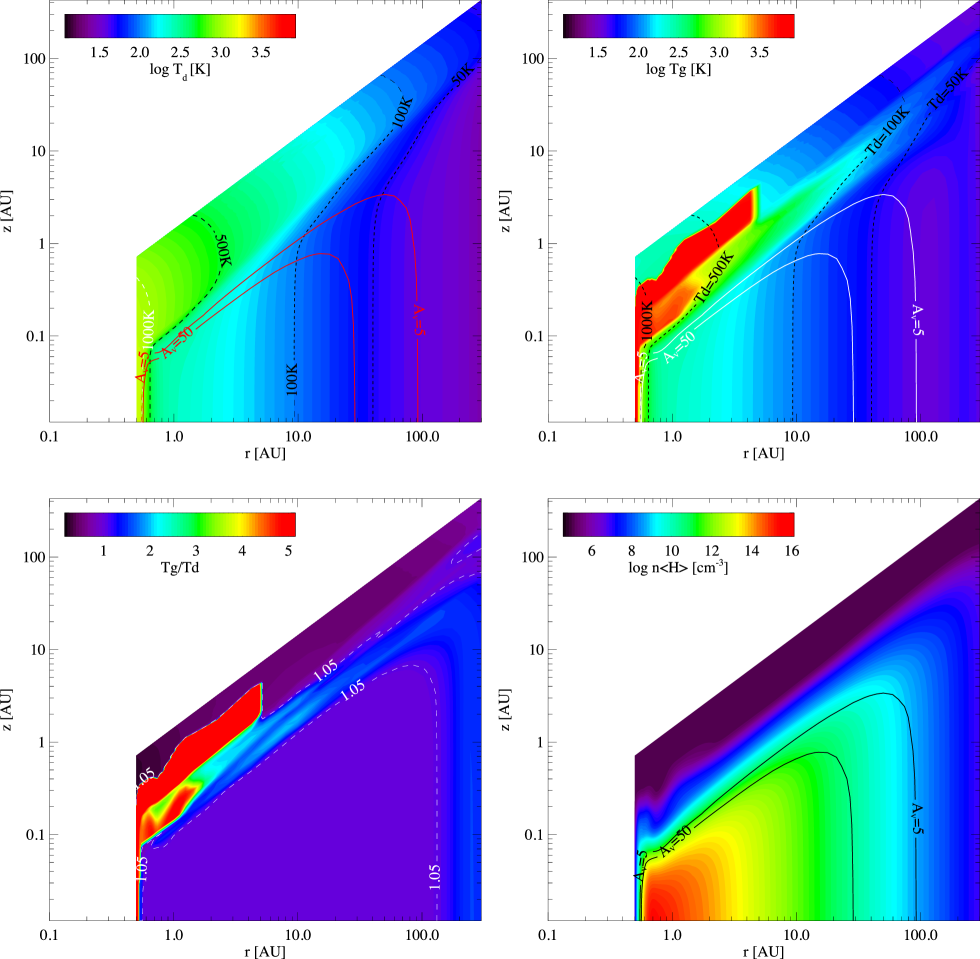
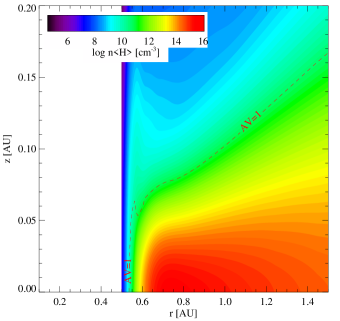
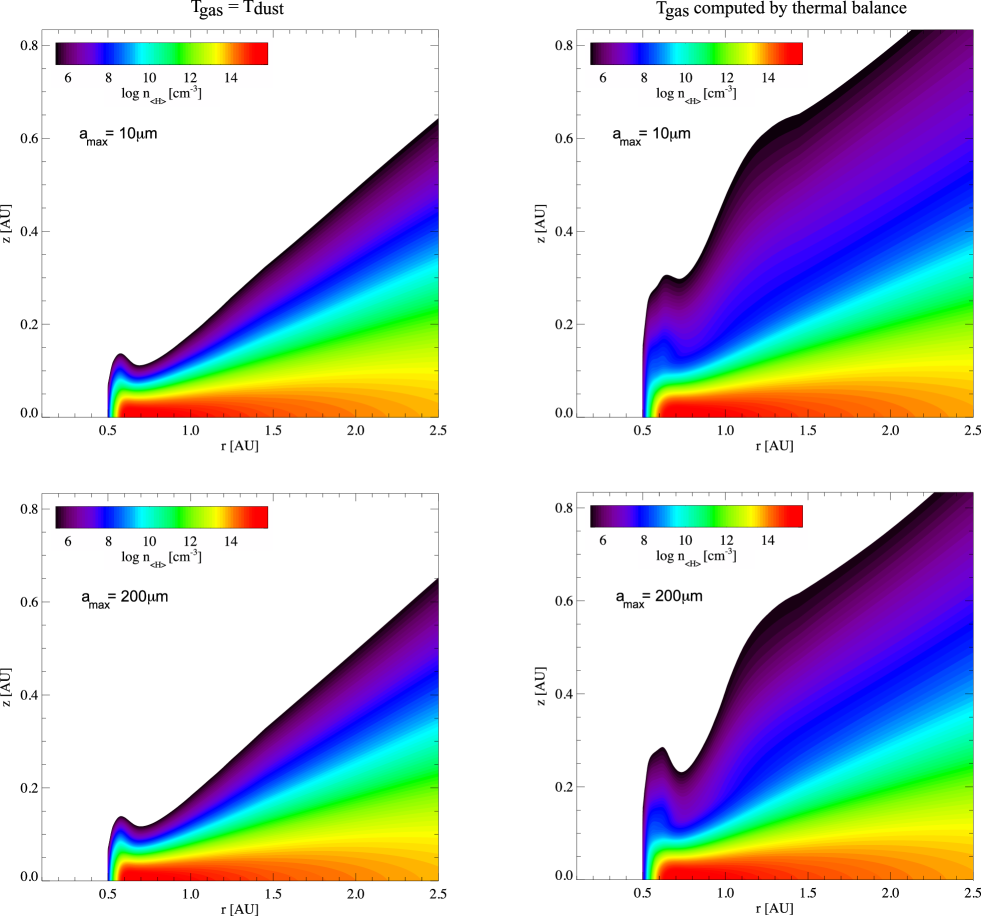
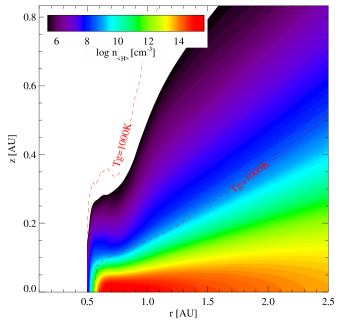
Figure 1 contains some results for the fiducial model. The dust and gas temperature distribution are shown in the upper two panels while the lower-right panel is the disc density structure. The disc areas where the gas and dust temperature are decoupled are emphasized in the lower-left panel. Figure 3 shows the dust opacity (scattering and absorption) for three maximum grain sizes (10, 50, and 200 m). The opacity is dominated by scattering at wavelengths below 10 m and by absorption at longer wavelengths.
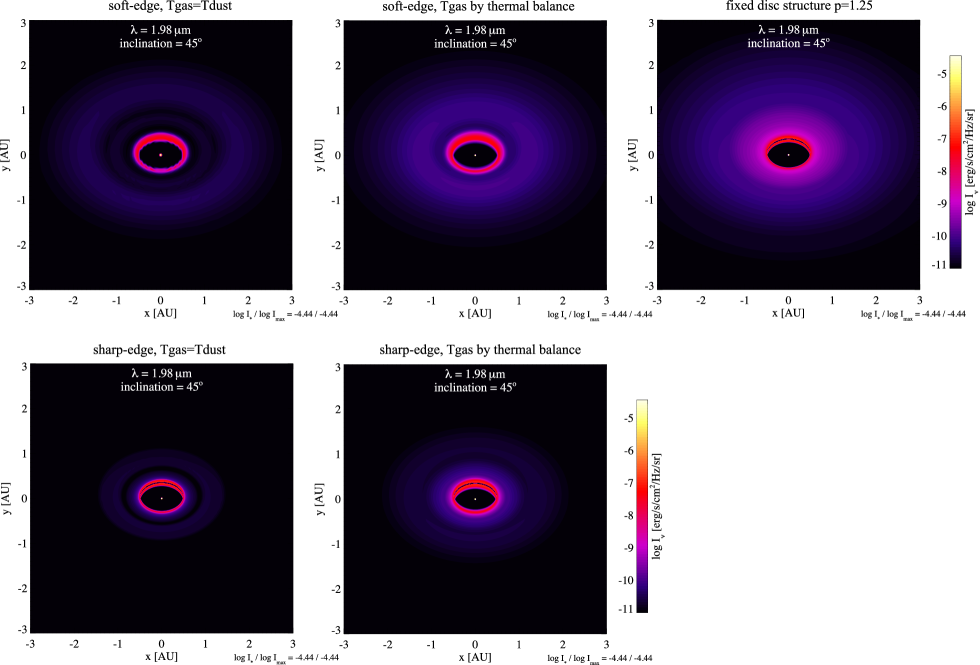
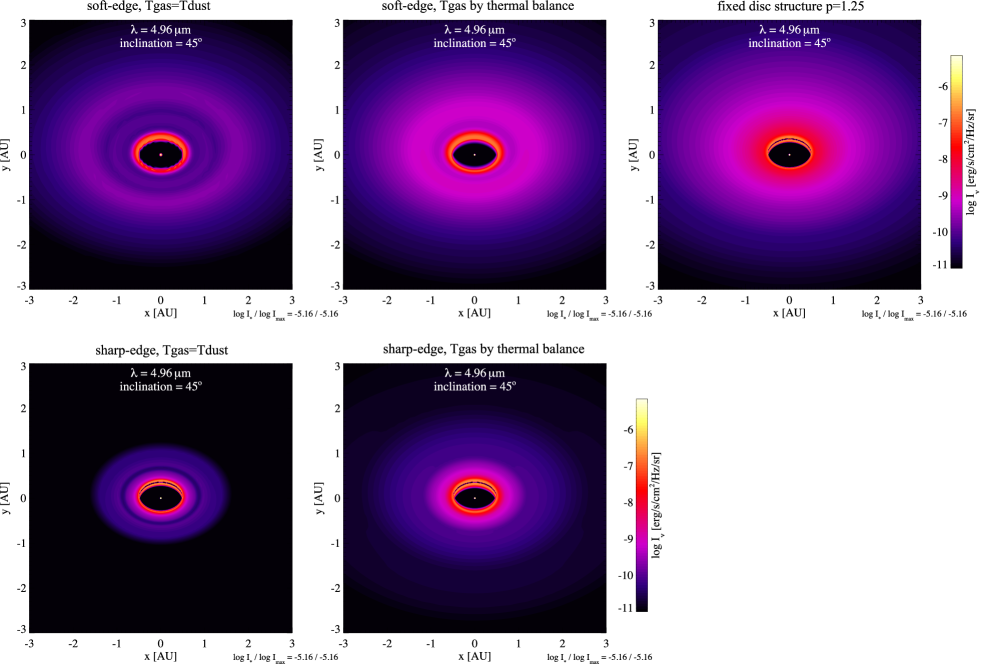
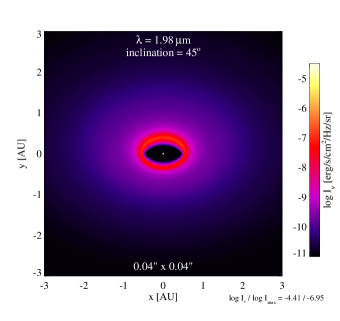
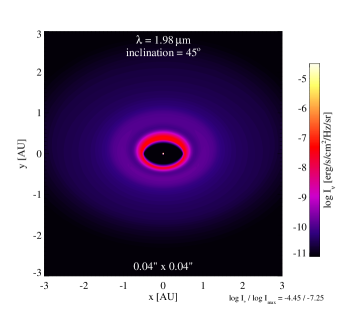
In the thermal-coupled models, the dust temperature structure is divided into a hot inner rim, a warm upper layer, and a vertical isothermal interior. The lower-left panel in Fig. 1 shows the ratio between the gas and dust temperature. The gas and dust temperature are equal at vertical optical depths 1 for a 10-2 M⊙ disc. The 2D dust continuum radiative-transfer results confirm the analytical two-zone decomposition popularized by Chiang & Goldreich (1997). The SED of the fiducial model is shown in solid-red lines in Figure 4. Model images of the inner disc at 1.98 m and 4.96 m are shown in Fig. 6 and Fig. 7 respectively. The flux at 1.98 m comes mostly from the inner rounded rim. The region just behind the rim is deprived of stellar photons, is cooler, and thus does not emit strongly (shadowing effect).
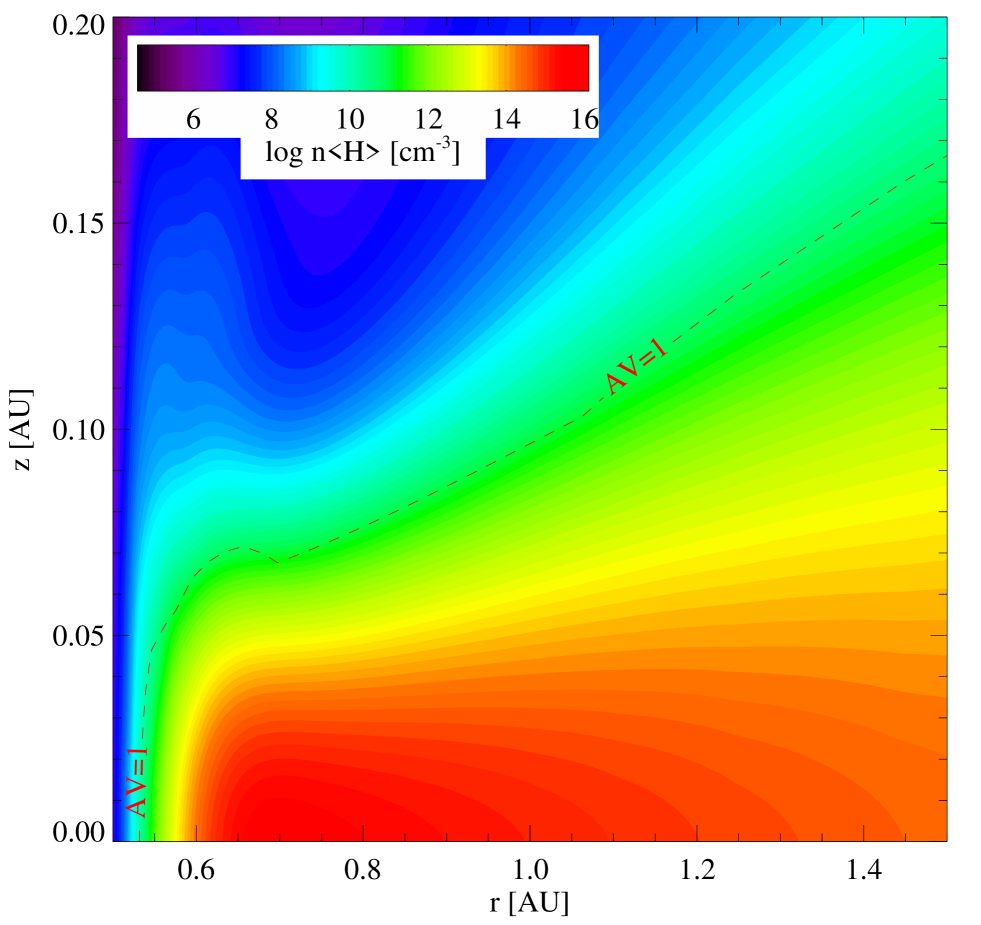
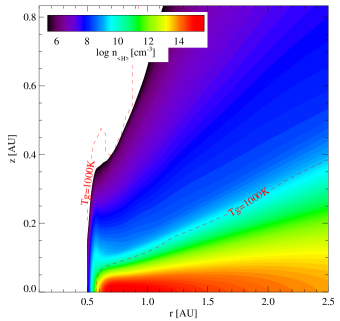
The gas temperature remains above 1000 K in the disc atmosphere up to a few AU. Together with the decrease in the vertical gravitational pull, they explain the emergence of a secondary density bump at 1.3 AU. The presence of the hot ”finger” in disc atmospheres is typical of disc models that compute the gas and dust temperature independently (Ercolano, Clarke & Drake, 2009; Glassgold, Meijerink & Najita, 2009; Woitke, Kamp & Thi, 2009; Nomura & Millar, 2005; Kamp & Dullemond, 2004; Jonkheid, Faas, van Zadelhoff & van Dishoeck, 2004).
The shape of the disc photospheric height (=1 contour) is shown in Figure 2. The height at 0.6 AU is located at 1. The curvature exhibits the same shape than in models where grains of different sizes sublime at different radii (Isella & Natta, 2005) or with density-dependent sublimation temperature (Tannirkulam et al., 2007). The curvature of the inner rim is caused by gas angular momentum conservation and pressure gradient and is independent on the dust physics. Likewise the location of the inner rim is set by hydrodynamic constraints (disc truncation or presence of a companion) and not by dust sublimation physics (see Sect. 3.1). However we have assumed that the gas and the dust are well-mixed. Therefore, the gas and dust grain density structures may be independent if grain-growth and settling occur.
4.2 Fixed-structure model
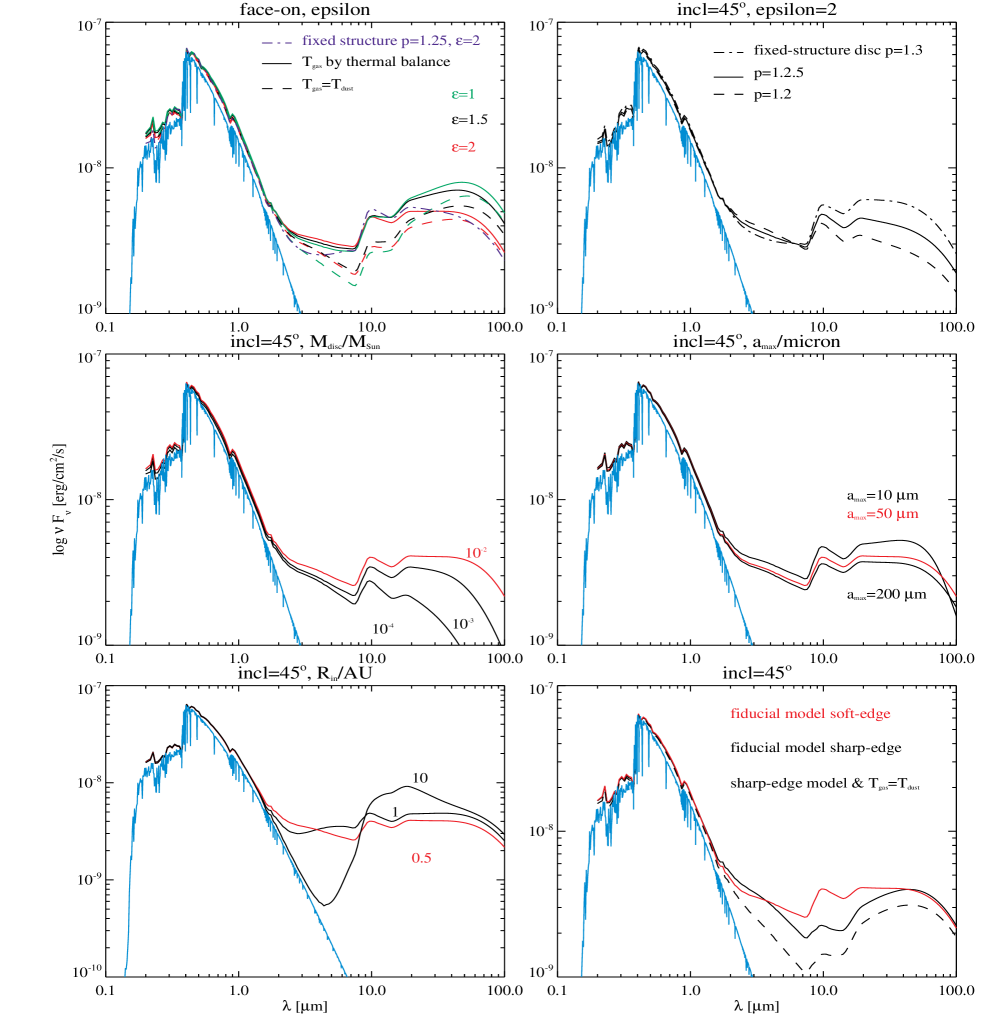
The inner disc structure for the AU and flaring index 1.25 fixed-structure model is shown in the upper-right panel of Fig. 5. The inner rim height is 0.1 AU. The SEDs that correspond to the fixed-structure models are drawn for inclination 0 (=1.25) and 45 degree (=1.2, 1.25, 1.3) on the two top panels of Fig. 4. The flaring index impacts on the amount of warm dust grains in the disc atmosphere that emit beyond 100 m. The SED of the fixed-structure model with flaring index 1.25 matches relatively well the SED of the fiducial model. The images at 1.98 and 4.96 m for the 1.25 model are shown on the upper right panel of Fig. 6 and Fig. 7.
When viewed exactly face-on, the SEDs at 3m of a fixed-structure disc show very weak near-IR fluxes, which arise from the rim (Meijer et al., 2008). The cause of this feature is that the projected inner rim emission area is null when the disc is seen face-on. In contrast, the hot-dust emitting area in the soft-edge models with rounded inner rim show much less dependency on the viewing angle.
At 45 degree inclination the flux at 3 m matches the fluxes from all the other disc-structure models. The flux comes mostly from the edge facing the star, which cannot be seen at null inclination. The SED between 8 and 100 m is extremely sensitive to the value of the flaring index because the more flare a disc is, the more stellar photons are intercepted by the outer disc, which predominately emits in the far infrared. The short wavelength flux (3–8 m) is mostly sensitive to the height of the rim, which is constant, and changes only a little when we vary .
SEDs alone cannot be used to differentiate between the inner disc structures. On the other hand, images at short wavelengths (see Fig. 6) show differences between the models. The emission at 1.98 m of the fiducial model is concentrated in the rounded inner rim with contribution from the second rim. The emission of the fixed-disc model is spread over the first AU. Discriminating disc models by fitting simultaneously the SED and images has already been used successfully to study the disc around the T Tauri star IM Lupi (Pinte et al., 2008).
4.3 Testing the effect of “soft” versus “sharp” edge
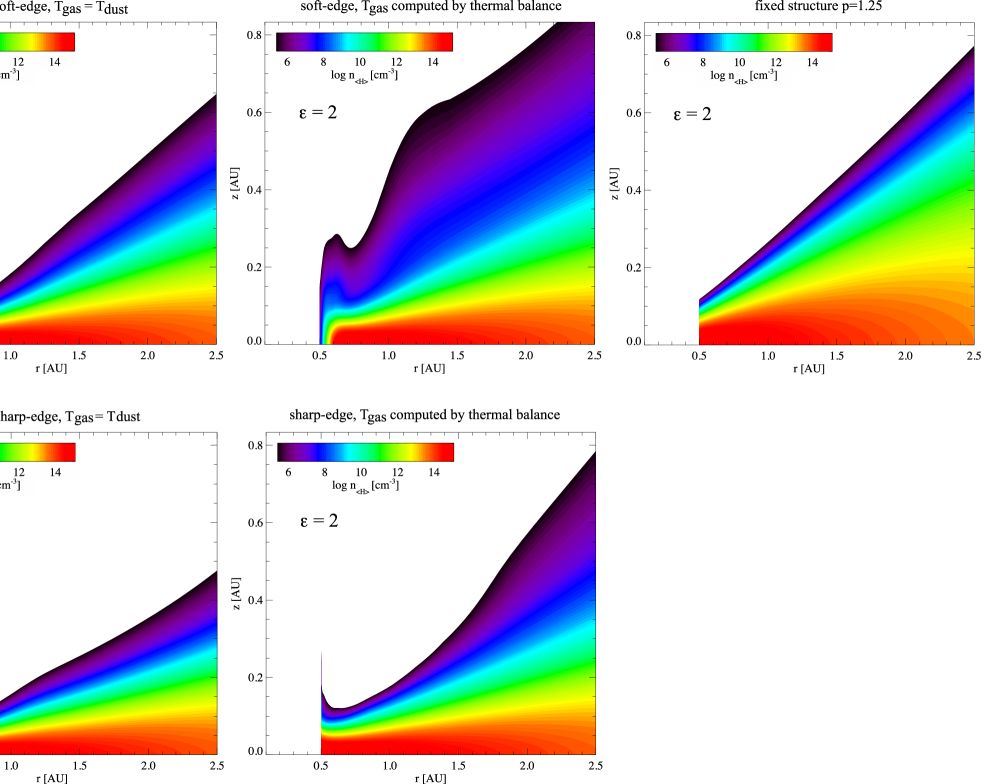
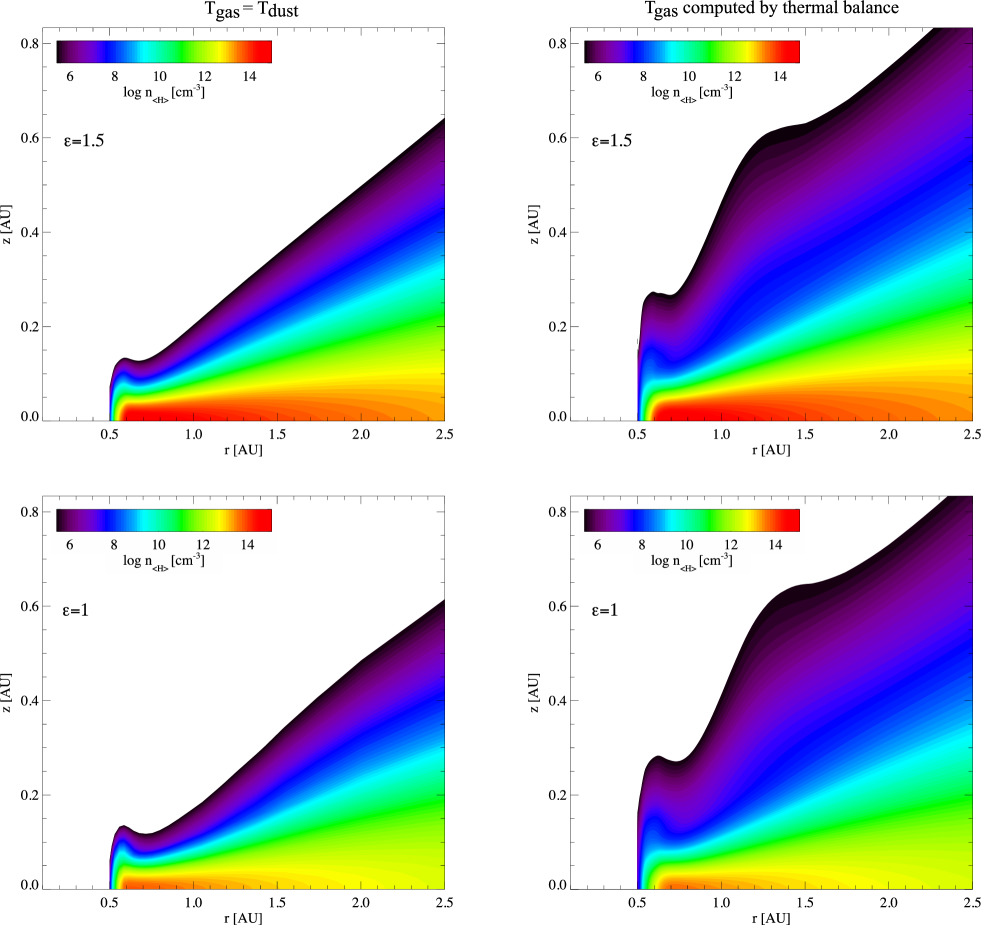
Current disc models assume that the disc density decreases monotonically from the inner edge to the outer radius (“sharp-edge” model). We study the effect of adopting our “soft-edge” model compared to “sharp-edge” model on the disc structure and SEDs. Figure 5 shows the density structure for the fiducial disc parameters assuming on the left panel and of computed by gas thermal on the middle panel. Those two density structures contrast with the two upper panels in Fig. 8.
First the rim is extremely narrow in the “sharp-edge” models. On the other hand, the main effect of the ’soft-edge’ model is to create a rounded rim surface whatever the surface density profile (see Fig. 5). The density gradients at the rim are clearly seen in the density structure plots. The projected rounded rim appears as an ellipse, similar to other theoretical studies (Isella & Natta, 2005; Kama et al., 2009).
In the “sharp-edge” models, the strength of the 3 m excess emission depends on the inclination of the disc with respect to the observer. This dependency stems from the thinness of the rim and was already found in previous studies of thermal-coupled models (Meijer et al., 2008). On the other hand, the 3 m excess depends much less on the inclination for the “soft-edge” models (see upper-left panel of Fig. 4).
Secondly, there is no secondary “bump” in the structure at 1.2 AU, even when is computed by thermal balance. The presence of the second bump in the “soft-edge” decoupled model can explain the difference in fluxes between the models in the 4 and 40 micron region in the lower-right panel of Figure 4. The optically-thick rim in the “sharp-edge” models prevents a large amount of photons to reach the disc surface at radius 1–1.5 AU (the so-called “shadow”), therefore suppressing the rise of the second bump. The bump exists because the gas stays at temperatures 1000 K up to 4 AU at the surface while the dust temperatures are only 300 K. The bump creates a large emitting area for the warm dust, which translates into strong emission in the 4–40 m region in the SEDs (See Fig. 7 and upper-left panel of Fig. 4).
In the “sharp-edge” models, the mid-infrared flux is depressed compared to the “soft-edge” models because of the lower disc height behind the rim.
4.4 Effects of PAH abundance
The PAHs are the main heating of the agents of the gas (Kamp et al., 2010). A disc with =0.1 is warmer than a disc =0.01. A warmer disc is more extended vertically and intercepts more radiation from the star (Fig. 12 upper-left compared to Fig. 8 upper-right panel) although the shape of the photospheric height does not vary significantly (Fig. 12 upper-right panel). The overall emission in the continuum and in the gas lines is higher (Fig. 12 lower-right panel). We also show an image at 1.98 m in the lower-left panel of Fig. 12.
4.5 Effects of varying the surface density profile
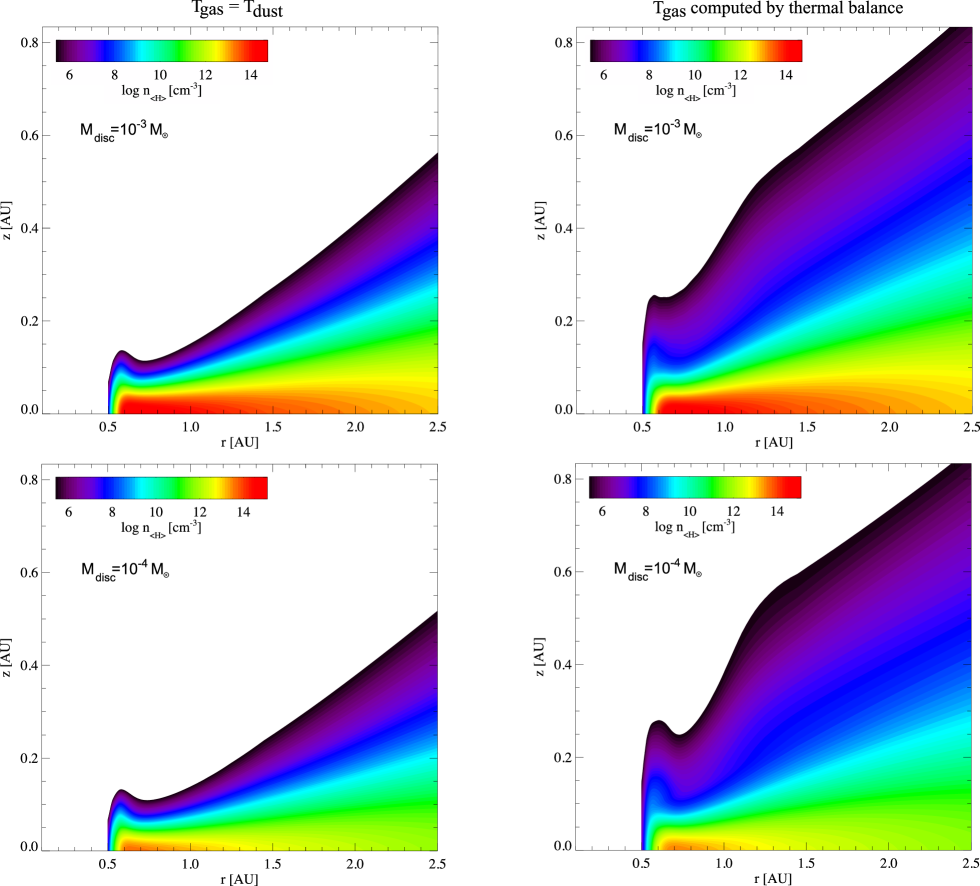
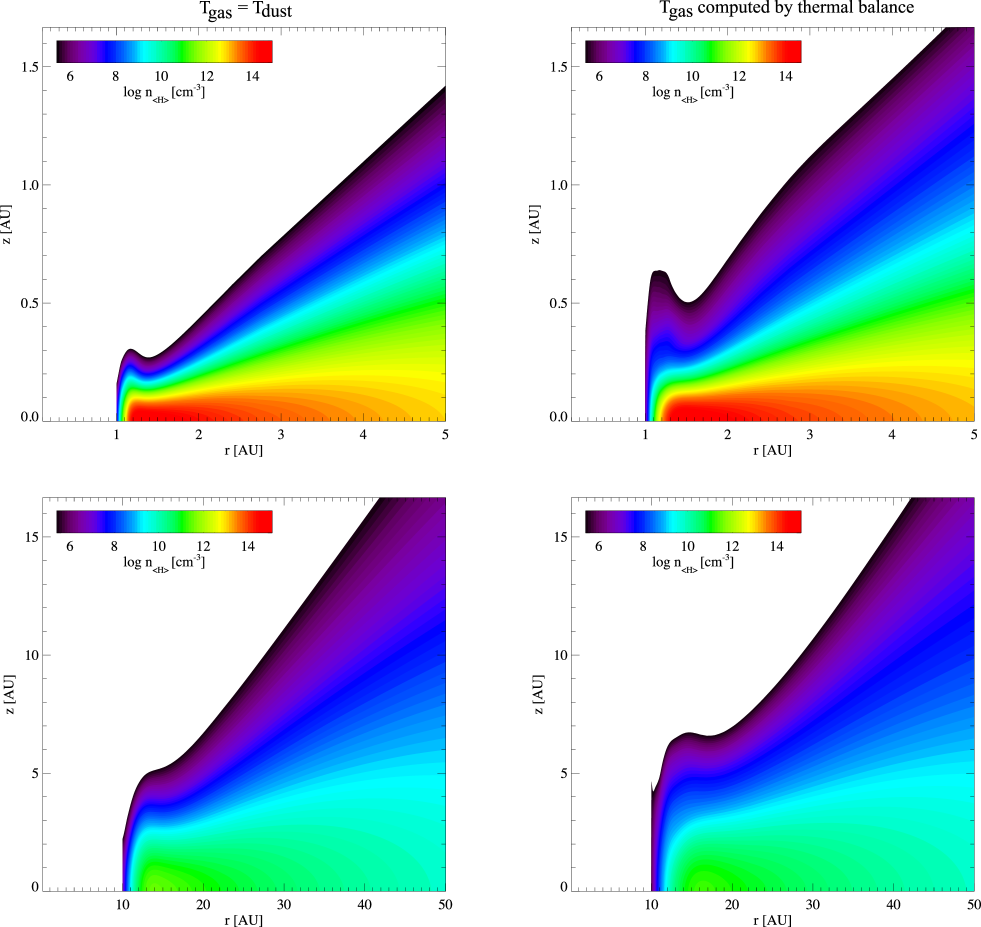
We show the results of varying the surface density power-law index from 1.0 to 2.0. All other parameters are kept constant. The density structure for the thermal-coupled () and thermal-decoupled ( from thermal balance) models are displayed in Fig. 8 for the inner disc on the right and left respectively. The Spectral Energy Distribution for the models are shown in the upper-left panel of Fig. 4.
The structure of thermal-decoupled disc models differ substantially from their thermal-coupled counterparts. The gas is heated by gaseous and dust grain photoprocesses that convert ultraviolet photons into fast-moving electrons, which in turn share the energy to the gas (mostly atomic and molecular hydrogen). In the upper disc layers, the density is too low for efficient gas-grain thermal accommodation and the gas and dust are thermally decoupled. The gas mostly cools by line emissions, which become quickly optically thick, while dust grains cool by optically thinner continuum emission. As a result, the gas remains at higher temperature than the dust grains.
Below the disc atmosphere, the ultraviolet flux is attenuated and thermal accommodation between gas and dust grows. The gas there is mostly molecular and frozen onto grain surfaces. Finally, in the highly extinct midplane thermal accommodation dominates and drives towards equal gas and dust temperatures. The dust temperature structure is not affected by the change in density structure as there are still two layers: a warm upper layer and a vertical isothermal interior.
The inner rim is much higher when the gas temperature is determined by detailed heating and cooling balance. The SED reflects relatively well the amount of hot grains and thermal-decoupled models show a larger amount because of higher rims.
In the thermal-coupled model, the rim is much lower and does not block photons to reach the area behind the rim. Acke et al. (2009) studied the SED from Herbig Ae discs using a Monte-Carlo code coupled with hydrostatic equilibrium assuming equal temperatures. They found good matches to observational data when they artificially rise the height of the rim, consistent with our results when the gas thermal balance is computed.
The second bump at 1–2 AU that appears in the thermal-decoupled models are not present in the models (the left panels in Fig. 8). As already mentioned in the discussion of “sharp-edge” versus “soft-edge” models, the second bump is caused by the gas that is hotter than the dust at the disc surfaces. A rounded optically thinner rim helps more scattered light to reach the disc surfaces compared to a narrow optically thicc rim.
The existence of a puffed-up rim is a necessary but not sufficient condition for strong 3 m excess. The surface area of the rim has to be large, i.e. the rim has to be high enough. In the seminal paper on disc inner rim by Dullemond et al. (2001), the height of the rim to the rim distance from the star ratios were found to be of the order of 0.1–0.25. We find that the rim in the case of is 0.25 AU high at 0.5 AU. Here we have defined the disc height as the location of the disc where gas density is 106 cm-3. A higher rim is needed in our modelling to produce strong emission at 3m because the Dullemond et al. (2001) model assumed a single dust temperature at 1500 K for the rim while in our models only the dust in the rim at the midplane reaches 1500 K. In the upper-left panel of Fig. 1, we can see a vertical decreasing dust temperature gradient from the midplane (1500K) to the surface (1000 K) at the rim radius.
The mid-infrared continuum emission at a specific wavelength reflects the amount of dust grains at a temperature roughly given by Wien’s law. As found in previous studies, discs flare in the outer disc in the thermal-coupled models. The rim deprives the disc atmosphere behind the rim of UV photons. This shadowing effect has been invoked to explain SED of disc with low 30–100 m emission flux (Dullemond & Dominik, 2004; Meijer et al., 2009; Verhoeff et al., 2010). This shadowing effect is less pronounced if dust scattering is taken into account. Dust scattering ensures that some photons reach the “shadowed” area behind the rim.
The main effect of warmer upper layers in the decoupled models is puffed-up and strongly flaring upper layers from the inner rim to the outer radius. Although the inner rim is twice higher than in the thermal-coupled case, the extra dust opacity in the rim is not sufficient to attenuate the UV flux responsible for the gas heating behind the rim. Denser gas are found higher in the disc and more grains are raised to higher temperature, resulting in slightly stronger 10–50 m continuum flux. In general our hydrostatic disc models flare strongly.
4.6 Effects of varying the disc mass
In this series of models, the surface density profile is kept at 2.0 and we vary the disc mass (=10-4, 10-3, and 10-2 M⊙). The structure and SEDs for this series are shown in Fig. 10 and 4 respectively. The near-IR flux is weakly affected by the disc mass. On the other hand, the flux in the 10–50 m region is sensitive to the total dust mass and thus decreases with decreasing total disc mass (the gas-to-dust mass ratio is kept constant at 100), consistent with the findings of Acke et al. (2009). From the SEDs in Fig. 4, the disc mass is the most important parameter controlling the near- to far-IR flux ratio. As the opacity decreases with wavelength (see Fig. 3), the flux depends less and less on the disc geometry and more and more on the total dust mass, which scales with the gas mass if a constant gas-to-dust mass ratio is assumed.
4.7 Effects of varying the maximum grain size
The maximum grain size has a relatively weak influence on the inner disc structure (Fig. 11). Therefore the flux at 3–5 m does not change significantly with increasing dust grain upper size limit (see Fig. 4). On the other hand, the effects on the 10–70 m shape of the SED are significant. The bigger the grains are, the cooler they are and the emission is weaker as testified by the higher opacity per unit mass for the small grains 3. In addition, big grains have less surface area per volume and therefore the photoelectric heating efficiency decreases. The disc is cooler and flares less, which results in less intercepted stellar photons. The combined effects concur to decrease the 10–70 flux when grains are big. Beyond 100 m, the grain emissivity depends strongly on the presence of larger grains.
At wavelength larger than their sizes, grains are efficient emitters. Therefore the flux drop at wavelengths longer than 70 m is less pronounced for big grains. In summary, increasing the maximum grain radius results in weaker emission at 30–70 m but stronger emission at longer wavelengths.
4.8 Effects of varying the inner disc radius
Figure 4 and 13 show the SEDs and inner disc structure for = 1 and 10 AU. A round rim structure is present for all inner disc radii. Since the hottest grains are cooler, the peak of the near-infrared bump has shifted to 4 m in the = 1 AU model. The spectral signature of the inner rim has disappeared for the = 10 AU model. The presence of the puffed-up rim does not depend on the actual value of the inner radius but only rims close to the star have hot enough dust to emit strongly in the near-infrared.
5 Conclusions
We modelled the structure, Spectral Energy Distribution, and infrared images of protoplanetary discs around Herbig Ae star and analysed the difference between the assumption of equal gas and dust temperatures and when both temperatures are computed independently. We also compared the hydrostatic disc model SEDs to the SEDs of a disc with prescribed density structure.
The disc structure is governed by the gas pressure support, which in turn depends on the gas molecular weight and temperature. The height of the inner rim in models with calculated gas temperature exceeds those where the gas and dust temperature are equal by a factor 2 to 3. Higher rims result in large emitting areas and thus slight larger near-infrared excess. Our treatment of the inner disc density fall-off (“soft-edge”) results in rounded inner rims consistent with near-infrared interferometric studies. The discs also show a second density bump that manifests itself as stronger emission between 3 and 30 m. The flux beyond 30 m is mostly sensitive to the disc mass. The maximum grain radius affects weakly the SEDs. The effect of gaps is to remove hot dust grains which emit predominately in the near-IR. As a result, the flux in the near-IR is suppressed. The shape of the SED from 3 to 100 m cannot be used to discriminate between the inner disc structure models. Together with the SED, images with high spatial resolution may be used to differentiate between disc models.
Our study stresses the importance of understanding the interplay between the gas and the dust in protoplanetary discs. This interplay shapes the disc structures, which in turn control the shape of the SEDs.
6 Acknowledgments
WFT was supported by a Scottish Universities Physics Alliance (SUPA) fellowship in Astrobiology at the University of Edinburgh. W.-F. Thi acknowledges PNPS, CNES and ANR (contract ANR-07-BLAN-0221) for financial support. We thank Ken Rice for discussions on inner disc structures.
References
- Acke et al. (2009) Acke B., Min M., van den Ancker M. E., Bouwman J., Ochsendorf B., Juhasz A., Waters L. B. F. M., 2009, A&A, 502, L17
- Benisty et al. (2010) Benisty M., Tatulli E., Ménard F., Swain M. R., 2010, A&A, 511, A75+
- Brott & Hauschildt (2005) Brott I., Hauschildt P. H., 2005, in C. Turon, K. S. O’Flaherty, & M. A. C. Perryman ed., The Three-Dimensional Universe with Gaia Vol. 576 of ESA Special Publication, A PHOENIX Model Atmosphere Grid for Gaia. pp 565–+
- Cazaux & Tielens (2004) Cazaux S., Tielens A. G. G. M., 2004, ApJ, 604, 222
- Cesaroni et al. (2007) Cesaroni R., Galli D., Lodato G., Walmsley C. M., Zhang Q., 2007, Protostars and Planets V, pp 197–212
- Chiang & Goldreich (1997) Chiang E. I., Goldreich P., 1997, ApJ, 490, 368
- Desch (2007) Desch S. J., 2007, ApJ, 671, 878
- Dohnanyi (1969) Dohnanyi J. S., 1969, J. Geophys. Research, 74, 2531
- Dominik et al. (2003) Dominik C., Dullemond C. P., Waters L. B. F. M., Walch S., 2003, A&A, 398, 607
- Dullemond & Dominik (2004) Dullemond C. P., Dominik C., 2004, A&A, 417, 159
- Dullemond et al. (2001) Dullemond C. P., Dominik C., Natta A., 2001, ApJ, 560, 957
- Ercolano et al. (2009) Ercolano B., Clarke C. J., Drake J. J., 2009, ApJ, 699, 1639
- Glassgold et al. (2009) Glassgold A. E., Meijerink R., Najita J. R., 2009, ApJ, 701, 142
- Isella & Natta (2005) Isella A., Natta A., 2005, A&A, 438, 899
- Isella et al. (2006) Isella A., Testi L., Natta A., 2006, A&A, 451, 951
- Jayawardhana et al. (2003) Jayawardhana R., Ardila D. R., Stelzer B., Haisch Jr. K. E., 2003, AJ, 126, 1515
- Jonkheid et al. (2004) Jonkheid B., Faas F. G. A., van Zadelhoff G., van Dishoeck E. F., 2004, A&A, 428, 511
- Kama et al. (2009) Kama M., Min M., Dominik C., 2009, A&A, 506, 1199
- Kamp & Dullemond (2004) Kamp I., Dullemond C. P., 2004, ApJ, 615, 991
- Kamp et al. (2010) Kamp I., Tilling I., Woitke P., Thi W., Hogerheijde M., 2010, A&A, 510, A18+
- Kraus et al. (2009) Kraus S., Hofmann K., Malbet F., Meilland A., Natta A., Schertl D., Stee P., Weigelt G., 2009, A&A, 508, 787
- Laor & Draine (1993) Laor A., Draine B. T., 1993, ApJ, 402, 441
- Meeus et al. (2001) Meeus G., Waters L. B. F. M., Bouwman J., van den Ancker M. E., Waelkens C., Malfait K., 2001, A&A, 365, 476
- Meijer et al. (2008) Meijer J., Dominik C., de Koter A., Dullemond C. P., van Boekel R., Waters L. B. F. M., 2008, A&A, 492, 451
- Meijer et al. (2009) Meijer J., Waters L. B. F. M., de Koter A., Min M., van Boekel R., Dominik C., Dullemond C. P., 2009, A&A, 496, 741
- Mohanty et al. (2004) Mohanty S., Jayawardhana R., Natta A., Fujiyoshi T., Tamura M., Barrado y Navascués D., 2004, ApJL, 609, L33
- Monnier & Millan-Gabet (2002) Monnier J. D., Millan-Gabet R., 2002, ApJ, 579, 694
- Muzerolle et al. (2003) Muzerolle J., Calvet N., Hartmann L., D’Alessio P., 2003, ApJL, 597, L149
- Natta & Testi (2001) Natta A., Testi L., 2001, A&A, 376, L22
- Natta et al. (2007) Natta A., Testi L., Calvet N., Henning T., Waters R., Wilner D., 2007, in B. Reipurth, D. Jewitt, & K. Keil ed., Protostars and Planets V Dust in Protoplanetary Disks: Properties and Evolution. pp 767–781
- Nomura & Millar (2005) Nomura H., Millar T. J., 2005, A&A, 438, 923
- Pinte et al. (2009) Pinte C., Harries T. J., Min M., Watson A. M., Dullemond C. P., Woitke P., Ménard F., Durán-Rojas M. C., 2009, A&A, 498, 967
- Pinte et al. (2008) Pinte C., Padgett D. L., Ménard F., Stapelfeldt K. R., Schneider G., Olofsson J., Panić O., Augereau J. C., Duchêne G., Krist J., Pontoppidan K., Perrin M. D., Grady C. A., Kessler-Silacci J., 2008, A&A, 489, 633
- Rice & Armitage (2009) Rice W. K. M., Armitage P. J., 2009, MNRAS, 396, 2228
- Shu et al. (1994) Shu F., Najita J., Ostriker E., Wilkin F., Ruden S., Lizano S., 1994, ApJ, 429, 781
- Tannirkulam et al. (2007) Tannirkulam A., Harries T. J., Monnier J. D., 2007, ApJ, 661, 374
- Tannirkulam et al. (2008) Tannirkulam A., Monnier J. D., Harries T. J., Millan-Gabet R., Zhu Z., Pedretti E., Ireland M., Tuthill P., ten Brummelaar T., McAlister H., Farrington C., Goldfinger P. J., Sturmann J., Sturmann L., Turner N., 2008, ApJ, 689, 513
- Tannirkulam et al. (2008) Tannirkulam A., Monnier J. D., Millan-Gabet R., Harries T. J., Pedretti E., ten Brummelaar T. A., McAlister H., Turner N., Sturmann J., Sturmann L., 2008, ApJL, 677, L51
- Tatulli et al. (2008) Tatulli E., Malbet F., Ménard F., Gil C., Testi L., Natta A., Kraus S., Stee P., Robbe-Dubois S., 2008, A&A, 489, 1151
- Thi et al. (2005) Thi W., van Dalen B., Bik A., Waters L. B. F. M., 2005, A&A, 430, L61
- Tielens (2005) Tielens A. G. G. M., 2005, The Physics and Chemistry of the Interstellar Medium. Cambridge University Press, Cambridge, UK
- van den Ancker et al. (1998) van den Ancker M. E., de Winter D., Tjin A Djie H. R. E., 1998, A&A, 330, 145
- van Dishoeck et al. (2006) van Dishoeck E. F., Jonkheid B., van Hemert M. C., 2006, Faraday Discuss., 133, 231
- Verhoeff et al. (2010) Verhoeff A. P., Min M., Acke B., van Boekel R., Pantin E., Waters L. B. F. M., Tielens A. G. G. M., van den Ancker M. E., Mulders G. D., de Koter A., Bouwman J., 2010, A&A, 516, A48+
- Vinković et al. (2006) Vinković D., Ivezić Ž., Jurkić T., Elitzur M., 2006, ApJ, 636, 348
- Woitke et al. (2009) Woitke P., Kamp I., Thi W., 2009, A&A, 501, 383
- Woodall et al. (2007) Woodall J., Agúndez M., Markwick-Kemper A. J., Millar T. J., 2007, A&A, 466, 1197