Intra- and intercellular fluctuations in Min protein dynamics decrease with cell length
Elisabeth Fischer-Friedrich1, Giovanni Meacci2, Joe Lutkenhaus3, Hugues Chaté4, and Karsten Kruse5
1Max Planck Institute for the Physics of Complex Systems, Nöthnitzer Straße 38, 01187 Dresden, Germany.
Present address: Department of Physical Chemistry, Weizmann Institute of Science, Rehovot 76100, Israel
2IBM T. J. Watson Research Center, P.O. Box 218, Yorktown Heights, NY 10598.
Present address: Department of Biological Sciences, Columbia University, New York, NY 10027
3Department of Microbiology, Molecular Genetics, and Immunology, University of Kansas Medical Center,
Kansas City, Kansas 66160
4CEA-Saclay, Service de Physique de l’Etat Condensé, 91191 Gif-sur-Yvette, France
5Theoretische Physik, Universität des Saarlandes, Postfach 151150, 66041 Saarbrücken, Germany
Abstract
Self-organization of proteins in space and time is of crucial importance for the functioning
of cellular processes. Often, this organization takes place in the presence of strong random fluctuations due to the
small number of molecules involved. We report on stochastic switching of the Min-protein distributions between
the two cell-halves in short Escherichia coli cells. A computational model provides strong evidence that
the macroscopic switching is rooted in microscopic noise on the molecular scale. In
longer bacteria, the switching turns into regular oscillations that are required for positioning of the division plane.
As the pattern becomes more regular, cell-to-cell variability also lessens, indicating cell length-dependent
regulation of Min-protein activity.
keywords: cell division, spatiotemporal patterns, fluctuations, protein self-organization
I Introduction
Subcellular structures are often formed by a small number of proteins. This is notably the case in prokaryotes, as exemplified by the Soj proteins in Bacillus subtilis that switch randomly between the two distal parts of the nucleoid quis99 ; mars99 , by the Min proteins in Escherichia coli lutk07 that switch periodically between the two halves of the bacterium, as well as by the rings and helices formed by FtsZ and MreB in many bacteria pogl08 . The concentrations of these proteins are in the micromolar range, hence, the above structures, that may extend over several micrometers, are formed by a few hundred molecules. Such small numbers can imply large random fluctuations in space and time quis99 ; mars99 .
However, there is currently a lack of quantitative experimental studies of random fluctuations in spatially extended protein structures. In particular it remains largely unexplored how fluctuations on cellular scales originate from the interplay of molecular noise, i.e., the stochastic nature of the protein kinetics, and external noise, i.e., variations in the environment or in the number of proteins present in the cell howa03 ; doub05 ; kerr06 ; Tostevin and Howard (2006); fang06 . In the context of gene expression, random fluctuations contribute essentially to the dynamics raj08 . In particular, they directly lead to differences in genetically identical cells elow02 , i.e., intercellular fluctuations, and can play an important role in cell fate decisions elow02 ; losi08 . In this context, cell size can act as a control parameter to regulate either the amplitude of fluctuations suel07 or the distribution of phenotypes they generate suel07 ; stpi08 .
In this work, we report on intra- and intercellular fluctuations in the spatiotemporal patterns formed by the Min proteins in E. coli. These proteins select the cell center as the site of division lutk07 . Their distribution has been found to change periodically with time, such that most of the proteins reside for about 40s in one cell half and subsequently for the same time in the opposite cell half rask99 . As one of the Min proteins, MinC, inhibits formation of the Z-ring, division is in this way suppressed at the cell poles. Computational analysis of the Min-protein dynamics indicate that the observed pattern results from self-organization of the ATPase MinD and MinE krus07 . This idea is supported by experiments in vitro in which planar and spiral waves of MinD and MinE emerged spontaneously in the presence of ATP on a supported lipid bilayer Loose et al. (2008).
We found, that in cells below a critical length of 2.7m the Min distribution switches stochastically between the two cell halves. In this phase intercellular fluctuations are pronounced. In cells longer than the critical length, we observed regular oscillations and intercellular fluctuations were significantly reduced. Computational analysis shows that stochastic switching can result from molecular noise. Furthermore, it indicates that, in the stochastic state, the rate of ATP consumption per MinD molecule is only half of that in the oscillatory state.
II Results
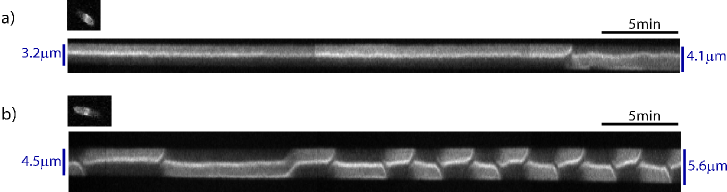
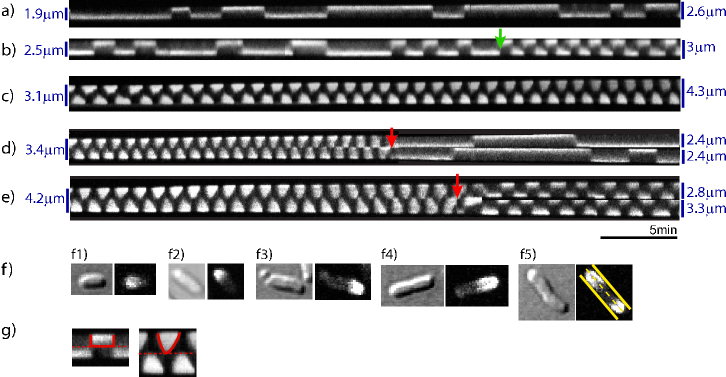
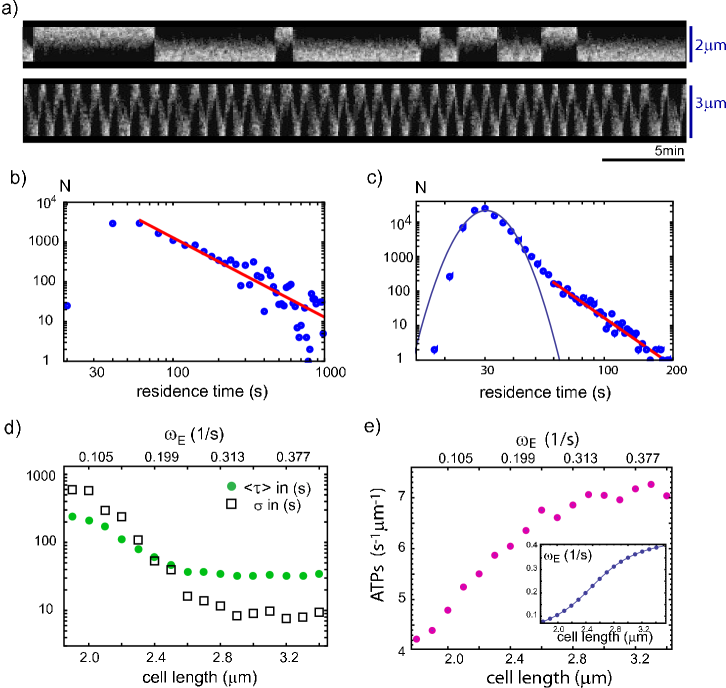
We observed the distribution of MinD for 40 minutes in each of 209 cells, see Materials and Methods, during which individual bacteria grew roughly 0.5m. In cells shorter than 2.5m, instead of oscillating regularly, MinD typically shifted stochastically from one cell half to the other, see Fig. 1a. The residence times of MinD in one cell half varied widely in these cells, whereas complete switching from one cell half to the other occurred in an interval of less than 15s. The extent of the region covered by MinD in one cell half did not change notably between two exchange events, see Fig. 1g.
For cell lengths between m and 3, the Min pattern typically changed from stochastic switching to regular oscillations with a period of about 80s, see Fig. 1b and Fig. S1 in the Supp. Mat. The precise lengths at which this transition occurred differed between cells. In the oscillatory regime, between two switching events, the region covered by MinD first grew monotonically from the cell end and then shrank monotonically towards the same end, see Fig. 1g. Analogously to the stochastic exchange regime, the transition of MinD from one half to the other was fast compared to the oscillation period. In a small number of cells (N=5), we observed a transition back from regular oscillations to stochastic switching.
Cells longer than invariably displayed regular oscillations, see Fig. 1c and Fig. S1 in the Supp. Mat. The oscillation period typically decreased slightly with increasing cell length. For the cell shown in Fig. 1c, the initial period is approximately s, while it is approximately s at the end. Similar behavior can be observed for MinE, see Supplementary Material.
About 5% of the cells divided during the observation time, see Fig. 1d, e. In all these cases, MinD oscillated regularly prior to division. Consistent with our findings in non-dividing cells, the pattern displayed by the Min proteins in the daughter cells immediately after division correlated with their length: daughter cells shorter than 2.5m typically displayed stochastic switching, while the Min proteins mostly oscillated in daughter cells longer than 3m. In some cases, however, the two daughter cells showed different MinD patterns, in spite of having equal lengths: while in one daughter we observed oscillations, the other displayed stochastic shifts. In these cases, judged from the fluorescence intensities, the distribution of MinD between the two daughter cells was significantly uneven 111In some cases, the oscillatory cell was brighter, in others, the stochastically switching cell. This suggests that the protein number is not the essential difference between oscillating and stochastically switching cells..
II.1 Distribution of residence times
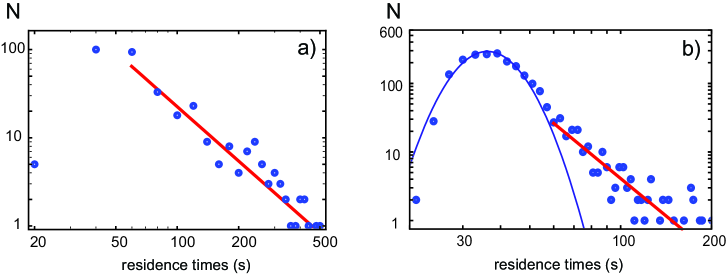
The transition from stochastic switching to regular oscillations is accompanied by a qualitative change in the distribution of residence times cumulated over cells of a given length, see Fig. 2. For cells longer than 3m, this distribution shows a pronounced peak at , which essentially coincides with the mean value, and a small tail including rare events of residence times of up to . These rare events correspond to instances when one or more oscillations were missed and thus the residence time extends to values significantly larger than the mean, see Fig. 9 in the Supplementary Material. The left, main part of the distribution () can be fitted by a log-normal distribution with a geometric mean of and a geometric standard deviation of . The tail () can be fitted to an algebraic decay with decay exponent .
For cells smaller than 2.5m, the distribution of residence times is qualitatively different: it is essentially algebraic, , with a decay exponent . Consequently, the mean-value is just at the edge of being well-defined, while the variance diverges, implying enormous variations. This is in contrast to a usual random telegraph process in which a system switches stochastically between two states at given constant rates. In this case, the distribution of residence times in one state decays exponentially. We, therefore, also fitted an exponential decay to the tail of the distribution of residence times. However, the logarithm of the likelihood ratio of an algebraic to an exponential decay was 35 and thus strongly indicative of an algebraic decay clau07 .
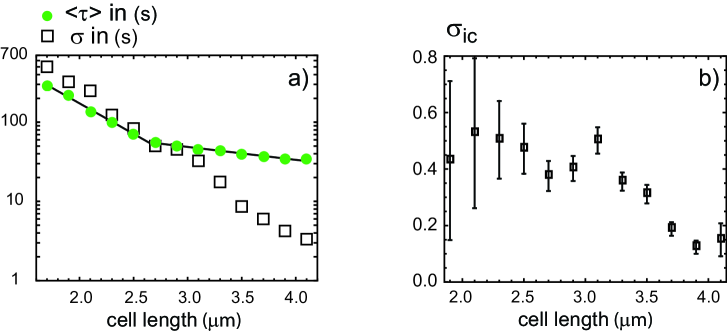
In Fig. 3a, we show the functional dependence on the cell length of the mean residence time cumulated over all events and all cells in a given length interval. Cell lengths were binned into intervals of length and residence times were assigned to the length of the cell at the beginning of the respective residence time interval. Note, that since within 500s, which is exceptionally large for a residence time, the bacteria grew at most 0.2m in length, our results do not depend significantly on the exact assignment rule. Strikingly, the variation of is well-described by two exponential decreases: For cell lengths smaller than 2.7m that are typically in the stochastic regime, with m, while for longer, typically oscillating cells m.
To characterize fluctuations around , we computed the effective standard deviation corresponding to our finite number of samples 222Even though the standard deviation would be infinite if the functional form of the distribution extended over all residence times, our finite samples which have roughly the same size for each length interval, allow for a meaningful estimate of .. The effective standard deviation , too, decreases exponentially with increasing cell length. Note that, for cells smaller than approximately 2.7m it is larger than , while for longer cells it is smaller. For cells larger than 3.5m, the standard deviation is below 10s indicating that the oscillation period varies remarkably little within a single cell and within an ensemble of cells.
II.2 Cell-cell variability
To assess the contribution of cell-to-cell variability to the fluctuations, we compared the mean residence time of individual cells with that of other cells sharing the same cell length. In Fig. 3b, we represent the normalized standard deviation of the distribution of mean residence times, . It decreases with increasing cell length, first mildly then sharply for cell lengths larger than 3m, indicating a clear reduction of cell-to-cell variability in longer cells. This suggests a control mechanism that adjusts Min parameters towards optimal reference values when the cells grow.
II.3 Mathematical modeling
Several attempts at mathematically modeling of the Min system have been successful in reproducing essential aspects of the Min dynamics krus07 . Based on different underlying microscopic pictures, these models uniformly explain the Min oscillations as an emergent property of interacting MinD and MinE in presence of a membrane and ATP. In particular, self-enhanced binding of MinD and/or MinE to the membrane, or aggregation of membrane-bound proteins can trigger an instability towards oscillations. Biochemically, MinD and MinE are not yet characterized well enough to exclude one possibility or the other. The validity of a model can alternatively be tested by verifying predictions of the macroscopic behavior. For example, the aggregation models in Refs. krus02 ; meac05 predict the existence of stationary heterogeneous protein distributions.
We tested several stochastic versions of models presented in the past Huang et al. (2003); meac05 ; Loose et al. (2008) and checked if they showed stochastic switching of Min proteins in certain parameter regimes, see Supp. Mat. Out of these, only the model suggested in meac05 produced stochastic switching similar to what is observed in the cell 333Also in the deterministic model of Ref. mein01 bistable stationary states can be observed (H. Meinhardt, personal communication). However, the model relies essentially on protein synthesis and degradation, which have been shown to be irrelevant for the Min oscillations.. Since stochastic simulations in three dimensions yield essentially the same results as in one dimension, cf. Refs. kerr06 and fang06 , we restricted our attention to simulations in one dimension.
What is at the origin of the transition between stochastic switching and oscillations of MinD and the corresponding change in the residence-time distribution? The experimental data presented above show that the spatiotemporal structure of the MinD pattern correlates with cell length. As a naive guess one might think that the cell length directly controls the pattern. However, in our experiments, we occasionally observed that two daughter cells of about the same length showed different MinD patterns right after division of the mother cell. In addition, in some instances, cells shorter than 2.5m also showed oscillations, while in some cells longer than 3m MinD switched stochastically between the two cell halves. This suggests that, in addition to the cell length, other factors control the transition from stochastic switching to regular oscillations.
In order to better understand which parameters of the system are able to trigger stochasticity in Min switching, we used a one-dimensional particle-based stochastic version of the one model which we identified as being able to produce stochastic switching, see Fig. 4 and Material and Methods. We find that, increasing the cell length is not sufficient to generate a transition from stochastic switching to oscillatory Min dynamics if, simultaneously, protein numbers increase proportionally to the cell length. Changing other parameters of the Min dynamics, however, can trigger such a transition. As an example we now discuss alterations in the rate of MinE binding to the membrane, see Fig. 5. Let us stress that in the following we keep the total protein concentrations constant, that is, protein numbers vary proportionally to the cell length. For and a cell length of m, our simulations show stochastic switching, while for and a cell length of m, we find oscillations 444A similar transition is found for a fixed system length of m. Furthermore, the transition can be induced also by varying the particle numbers or other rates appropriately (see also Supp. Material)., see Fig. 5a. The model is thus capable of reproducing the observed transition by changing MinE activity. It is important to note, that this transition is not a consequence of approaching the deterministic limit, but is inherent to the Min-protein dynamics. Indeed, for the respective binding rates, the deterministic model is either bistable and settling into one of two mirror-symmetric stationary states or it generates oscillations krus02 ; meac05 . We conclude that in short cells the macroscopic switching behavior is rooted in intrinsic fluctuations of the molecular processes due to the relatively small number of proteins involved. The transition from stochastic switching to oscillations, however, is not due to the discreteness of molecule numbers, which in general is possible toga01 .
Quantitative analysis of simulations corresponding to a single cell in the stochastic switching state, presented in Fig 5a, yield an exponential decay of the residence times as expected for a random telegraph process. This is however not in contradiction with the experimental data, for which ensemble averaging over different cells yields algebraic decay, Fig. 2a. Indeed, experiments revealed cell-to-cell variability, particularly strong amid short cells exhibiting stochastic switching, Fig. 3b. As we show below, introducing such variability in the model resolves the apparent contradiction. It is conceivable that in the experiments the cell-to-cell variations in the Min dynamics for a given cell length result mainly from differences in the numbers of MinD and MinE. Indeed, we found in of the observed divisions that the numbers in the daughter cells, as judged from fluorescence intensities, differed by more than 10%, see Supplementary Material.
In order to test the effects of varying protein numbers in the model, we performed several simulation runs with MinD protein numbers drawn at random from a Gaussian distribution with a standard deviation of 10% of the mean elow02 . The ratio of MinD to MinE was fixed to 8/3 Shih et al. (2002) and all other parameters kept constant. Lumping together the observed residence times of 70 runs with different protein numbers, we now observe an algebraic decay with exponent , see Fig. 5b, which is very close to the experimental value of 2.1, see Fig. 2a. As in the experiments, the mean is barely defined and the standard deviation diverges. This result constitutes a second instance of the general finding that power law distributions can result from Gaussian variations of system parameters as discussed by Tu and Grinstein in the context of the bacterial flagellar motor tu05 .
Analogously, we calculated the distribution of residence times in the oscillatory regime, see Fig. 5c. It is remarkably similar to that found experimentally, see Fig. 2b: a large hump, well fitted to a log normal distribution with geometric mean 31s and geometric standard deviation 1.2s, plus a small tail at large residence times which can be fitted by an algebraic decay with exponent , similar to the experimental value . Moreover, an inspection of the rare events at the origin of this algebraic tail showed that they are instances of “missed” oscillations, just like in the experimental kymographs, see Fig. 9 in the Supplementary Material. We conclude that the oscillation period is a robust property of the Min System with respect to fluctuations in protein numbers.
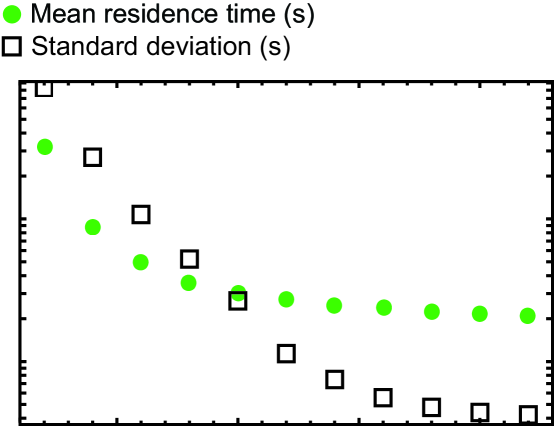
We then investigated the transition from the switching to the oscillatory state in more detail. Fig. 5d presents the mean value and the standard deviation as a function of system length. The rate was varied with the system length according to a sigmoidal dependence, see Fig. 5e inset and Supplementary Material. Similar to the experimental results, we find a decreasing mean and standard deviation with increasing length and the transition from stochastic switching to oscillations is accompanied by a drop of the standard deviation below the mean value. The simple particle model of the Min dynamics thus semi-quantitatively captures the effects of length changes and of fluctuations in the system.
Finally, we used the computational model to infer the ATP consumption rate as a function of cell length. Interestingly, the average ATP consumption rate per unit length, which is proportional to the ATP consumption rate per MinD, increases with cell length until the transition from stochastic switching to regular oscillations and then remains roughly constant, see Fig. 5e. Our calculations thus let us hypothesize that is energetically advantageous for a short cell to keep the Min system in the stochastic switching regime.
III Discussion
In summary, we have shown that in short E. coli cells the distribution of MinD proteins stochastically switches between two mirror-symmetric states, while it oscillates regularly in longer cells. The Min system provides thus an intriguing example of a spatiotemporal pattern under physiological conditions that combines regularity with stochastic elements.
Stochastic switching between two states is also known for the Soj/Spo0J proteins which in B. subtilis relocates irregularly between the two sides of the bacterial nucleoid quis99 ; mars99 . A computational model suggests that this phenomenon, too, is rooted in molecular fluctuations doub05 . Similarities between MinD and Soj had already been pointed out due to resemblance in structure, polymerization and ATPase activity loew09 . However, notable differences exist as, for example, Spo0J seems to be always bound to the nucleoid unlike MinE that detaches from the membrane. Furthermore, no oscillations have been found for Soj/Spo0J.
Based on our theoretical analysis, we can speculate about a possible regulatory mechanism controlling the dynamics of the Min proteins in E. coli. We interpret the findings of our computations as indications of changes in the activity of the Min proteins as the cells grow. Specifically, the ability of MinE to bind to membrane bound MinD might be reduced in early phases of the cell cycle. According to this view, the Min system is kept in a stand-by mode with reduced ATP consumption in short cells and gets fully activated only as a cell approaches division, when the Min system needs to be functional. Why does stochastic switching of the Min proteins not lead to minicelling? The central Z-ring needs about 5 to 10 minutes to mature and polar Z-rings are less stable than the central one. Consequently, polar rings formed in an early phase of the cell cycle might be disassembled by MinC after oscillations have set in, which occurs significantly before septation starts.
Obviously, the transition might be also due to other evolutionary constraints or be just a side-effect of the Min-protein dynamics. Independently of the transition’s physiological reason, we propose that changing system parameters such that the dynamic behavior is qualitatively modified through a bifurcation - in the present case from bistable to oscillatory - presents an interesting generic mechanism to tame detrimental fluctuations as subcellular processes become vital.
Materials
III.1 Data acquisition
We used cells of the E. coli strain JS964 containing the plasmid pAM238 encoding for MinE and GFP-MinD under the control of the lac-Promoter hu99 . Bacteria were grown overnight in a LB medium at C. Cells were induced with Isopropyl--D-thiogalactopyranosid (IPTG) at a concentration of 200M and incubated for 4 hours. During measurements, cells were in the exponential growth phase. The samples were kept at a temperature of C using a Bachhoffer chamber. To keep bacteria from moving under the cover slip, we put them on an agar pad (1% agar solution in LB medium with a reduced yeast extract fraction, 10%, in order to lower background fluorescence). The fluorescence recordings were taken with an Olympus FV 1000 confocal microscope, at an excitation wavelength of from a helium laser at low power. We used an Olympus UPLSAPO 60x, NA 1.35 oil immersion objective and recorded a frame every s. A measurement lasted 40min. During this period, the focus was manually readjusted at irregular intervals. We were not able to determine the protein numbers in individual cells.
In total, we extracted data from 209 MinD-fluorescent cells obtained from 5 different measurements. We extracted data only for cells which, at the beginning of the measurement, were smaller than . Cell lengths were determined from differential interference contrast (DIC) images with an accuracy of at the beginning and the end of a measurement. The cell length in-between was determined by linear interpolation. Some of the cells in the field of view divided during the measurement time. If division occurred after more than 20min of measurement, they were included in the data analysis. In these cases, fluorescence recordings were used until cell constriction terminated.
To observe MinE distribution in cells, we used the strain WM1079 expressing MinD and MinE-GFP on a plasmid under the control of the pBAD-promoter Corbin et al. (2002). Bacteria were induced with Arabinose but otherwise grown in the same way as described above.
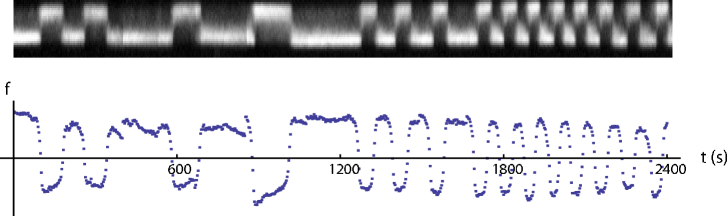
III.2 Data analysis
For a quantitative analysis, we mapped the time-lapse data of MinD-fluorescence from E. coli cells onto the states of a two-state process. We transformed the fluorescence data into a real-valued time-dependent function by subtracting the integrated fluorescence intensities from the left and the right cell half, see Fig. 6. Then, the moving average over four time points was taken in order to reduce noise. The resultant function is positive when the fluorescence maximum is in one cell half and negative in the opposite case. The residence time of MinD in one cell half is defined as the interval between two consecutive zeros of . To each residence time, we assigned the cell length at the start of the respective residence period.
III.3 Computational model of the Min dynamics
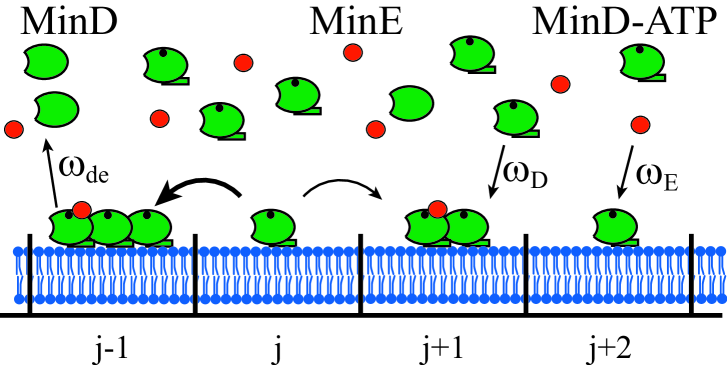
For the computational analysis of the Min-protein dynamics, we use a particle-based version of the model suggested in meac05 . It describes the formation of Min oscillations on the basis of an aggregation current of bound MinD that is generated by mutual attraction of the proteins. Furthermore, it accounts for the exchange of MinD and MinE between the membrane and the cytoplasm, where MinE only binds to membrane-bound MinD and where MinD detaches from the membrane only in the presence of MinE. Measurements of the cytoplasmic diffusion constants of MinD and MinE yielded values larger than 10m2/s meac06 . We thus consider the limit of large cytoplasmic diffusion which effectively leads to homogeneous cytoplasmic concentrations. The diffusion constant of membrane-bound proteins is about two orders of magnitude smaller than for cytosolic diffusion meac06 . This mobility suffices to generate a sufficiently strong aggregation current generating an instability of the homogenous protein distribution meac05 .
A corresponding stochastic particle-based description is defined on a one-dimensional lattice with sitesrepresenting the long axis of the cell. The lattice spacing is chosen such that it is much larger than the protein size and much smaller than the characteristic length of the Min pattern. Each site can contain at most proteins, a number which can be understood as the circumference of the cell. We assume diffusional mixing such that proteins are indistinguishable on a site. For site , the probability of attachment of cytoplasmic MinD and MinE during a sufficiently small time step is given by
| (1) | |||||
| (2) |
respectively. Here, are the corresponding attachment rates and and are, respectively, the numbers of cytoplasmic MinD and MinE. The numbers of membrane-bound MinD and MinDE complexes on site are and . The detachment probability is
| (3) |
where is the detachment rate. The exchange of particles between sites is governed by
| (4) |
where
| (5) |
with . The potential describes the interaction strength between Min-proteins on the membrane. We assume a square hole potential
| (6) |
Here, the integers and relate to the ranges of the MinD-MinD interaction and of the MinD-MinDE interaction through and . The parameters and tune the interaction strength. The diffusion constant of membrane-bound MinD is .
In Fig. 5d, the attachment rate is increased jointly with the cell length in the simulations. We chose a sigmoidal increase of in dependence of the cell length according to the Goldbeter-Koshland function, which gives the mole fraction of modified proteins that are under control of a modifying enzyme gold81
| (7) |
We chose parameters and . The factor determines the saturation value and was chosen as . The precise functional form of , however, is not of importance as long as it is sigmoidal.
Acknowledgements.
We thank M. Bär for useful discussions on the stochastic model.References
- (1) Quisel J, Lin DH, Grossman A (1999) Control of development by altered localization of a transcription factor in b. subtilis. Mol Cell 4:665–672.
- (2) Marston A, Errington J (1999) Dynamic movement of the para-like soj protein of b. subtilis and its dual role in nucleoid organization and developmental regulation. Mol Cell 4:673–682.
- (3) Lutkenhaus J (2007) Assembly dynamics of the bacterial MinCDE system and spatial regulation of the Z ring. Annu Rev Biochem 76:539–562.
- (4) Pgliano M (2008) The bacterial cytoskeleton. Curr Opin Cell Biol 20:19–27.
- (5) Howard M, Rutenberg AD (2003) Pattern formation inside bacteria: fluctuations due to the low copy number of proteins. Phys Rev Lett 90:128102.
- (6) Doubrovinski K, Howard M (2005) Stochastic model for Soj relocation dynamics in Bacillus subtilis. Proc Natl Acad Sci USA 102:9808–9813.
- (7) Kerr RA, Levine H, Sejnowski TJ, Rappel WJ (2006) Division accuracy in a stochastic model of Min oscillations in Escherichia coli. Proc Natl Acad Sci USA 103:347–352.
- (8) Tostevin F, Howard M (2006) A stochastic model of Min oscillations in Escherichia coli and Min protein segregation during cell division. Phys Biol 3:1–12.
- (9) Fange D, Elf J (2006) Noise-induced Min phenotypes in E. coli. PLoS Comput Biol 2:e80.
- (10) Raj A, van Oudenaarden A (2008) Nature, nurture, or chance: Stochastic gene expression and its consequences. Cell 135:216–226.
- (11) Elowitz M, Levine A, Siggia E, Swain P (2002) Stochastic gene expression in a single cell. Science 297:1183–1186.
- (12) Losick R, Desplan C (2008) Stochasticity and cell fate. Science 320:65–68.
- (13) Suel GM, Kulkarni RP, Dworkin J, Garcia-Ojalvo J, Elowitz MB (2007) Tunability and noise dependence in differentiation dynamics. Science 315:1716–1719.
- (14) St-Pierre F, Endy D (2008) Determination of cell fate selection during phage lambda infection. Proc Natl Acad Sci USA 105:20705–20710.
- (15) Raskin DM, de Boer PA (1999) Rapid pole-to-pole oscillation of a protein required for directing division to the middle of Escherichia coli. Proc Natl Acad Sci USA 96:4971.
- (16) Kruse K, Howard M, Margolin W (2007) An experimentalist’s guide to computational modelling of the Min system. Mol Microbiol 63:1279–1284.
- (17) Loose M, Fischer-Friedrich E, Ries J, Kruse K, Schwille P (2008) Spatial regulators for bacterial cell division self-organize into surface waves in vitro. Science 320:789–792.
- (18) Clauset A, Shalizi CR, Newman MEJ (2007) Power-law distributions in empirical data http://arxiv.org/abs/0706.1062.
- (19) Kruse K (2002) A dynamic model for determining the middle of Escherichia coli. Biophys J 82:618–627.
- (20) Meacci G, Kruse K (2005) Min-oscillations in Escherichia coli induced by interactions of membrane-bound proteins. Phys Biol 2:89–97.
- (21) Huang KC, Meir Y, Wingreen NS (2003) Dynamic structures in Escherichia coli: spontaneous formation of MinE rings and MinD polar zones. Proc Natl Acad Sci USA 100:12724–12728.
- (22) Meinhardt H, de Boer PA (2001) Pattern formation in Escherichia coli: a model for the pole-to-pole oscillations of Min proteins and the localization of the division site. Proc Natl Acad Sci USA 98:14202–14207.
- (23) Togashi Y and Kaneko K (2001) Transitions Induced by the Discreteness of Molecules in a Small Autocatalytic System. Phys Rev Lett 86:2459–2462.
- (24) Shih Y, Fu X, King G, Le T, Rothfield L (2002) Division site placement in e.coli: mutations that prevent formation of the mine ring lead to loss of the normal midcell arrest of growth of polar mind membrane domains. EMBO J 21:3347–3357.
- (25) Tu Y, Grinstein G (2005) How white noise generates power-law switching in bacterial flagellar motors. Phys Rev Lett 94:208101.
- (26) Löwe J, Amos L (2009) Evolution of cytomotive laments: The cytoskeleton from prokaryotes to eukaryotes. Int J Biochem Cell Biol 41:323–329.
- (27) Hu Z, Lutkenhaus J (1999) Topological regulation of cell division in Escherichia coli involves rapid pole to pole oscillation of the division inhibitor MinC under the control of MinD and MinE. Mol Microbiol 34:82–90.
- (28) Corbin BD, Yu XC, Margolin W (2002) Exploring intracellular space: function of the Min system in round-shaped Escherichia coli. EMBO J 21:1998–2008.
- (29) Meacci G, Ries J, Fischer-Friedrich E, Kahya N, Schwille P, et al. (2006) Mobility of Min-proteins in Escherichia coli measured by fluorescence correlation spectroscopy. Phys Biol 3:255–263.
- (30) Goldbeter A, Koshland D (1981) An amplified sensitivity arising from covalent modification in biological systems. Proc Natl Acad Sci USA 78:6840–6844.
IV Supplementary Material
IV.1 Stochasticity of Min Switching Decreases in Individual Cells During Cell Elongation/Aging
We analyzed the stochasticity of MinD switching in individual cells for time intervals in which the cell grew less than . For the associated Min dynamics in such an interval, we calculated the ratio of the standard deviation of the residence times and the corresponding mean ,
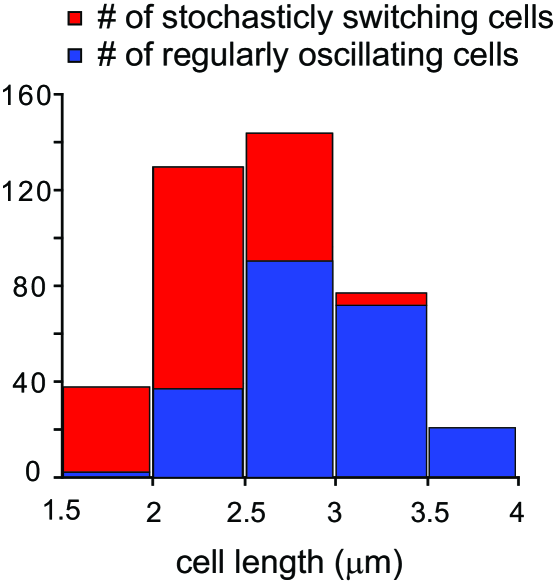
This quantity measures the stochasticity of the Min dynamics in an individual cell – the higher it is, the more stochastic is the switching behavior. In Fig. 7, we show a histogram of the number of cells which switch stochastically/regularly in a length interval of m according to the stochasticity measure .
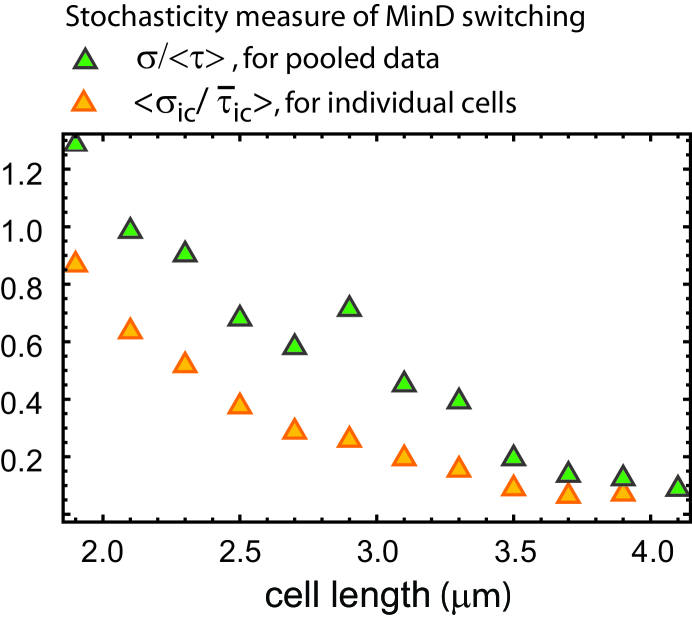
We averaged the quantity over ensembles of cells in a cell length interval m. In Fig. 8, we present the average ratio as a function of the cell length, (yellow triangles), where denotes the average over all measured cells in the respective length interval. To get a meaningful estimate of , only cells showing at least 5 switching events within a length interval of m were considered. Very long residence times are thus neglected, which, together with the small number of events entering , tends to systematically underestimate the standard deviation of the ”real” distribution. The value of initially drops monotonically and stays constant for cell lengths larger than 3.5m. The ratio of the mean residence time and the corresponding standard deviation decreases thus in individual cells.
For comparison, we took the residence times of the same cells and pooled them directly according to the appropriate cell length interval. This means that the averaging over cell populations is done first, before any statistical analysis. From the obtained sets of residence time distributions, we calculated again standard deviation and mean and their ratio . Again, this quantity drops for increasing cell length, Fig. 8 (green triangles), but takes on average higher values than (yellow triangles). This is because the standard deviation results in this case also from cell-cell variability.
IV.2 Regularly Oscillating Cells, Protein Translocation Events Are Occasionally Missed
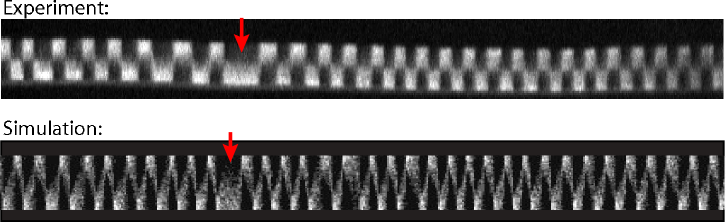
Rarely, in regularly oscillating cells, a switching event is missed and the fluorescence maximum stays longer in one cell half. An example of such an event is shown in the top panel of Fig. 9. This phenomenon can also be observed in the simulated Min oscillations as shown in the bottom panel of Fig. 9. These events give rise to a small tail in the residence time distribution of oscillating cells.
IV.3 MinE Ring Stochastically Switches in Short Cells
During our measurements of MinD fluorescence in cells, we could not assess the distribution of MinE simultaneously. Instead, we observed the distribution of fluorescently labeled MinE in a different Escherichia coli strain, WM1079 (S1). This strain produces on average larger cells and does not show a clear transition from stochastic Min switching to Min oscillations during cell growth. We did however observe stochastic switching of MinE in individual cells, Fig. 10. This fact together with known results of simultaneously recorded distributions of MinD and MinE in vivo (S2) and in vitro (S3) suggests strongly that MinE is in the same way distributed in stochastically switching cells as in normally oscillating cells: A MinE ring at the rim of the MinD tube and a shallow MinE layer on the remainder of the MinD tube.
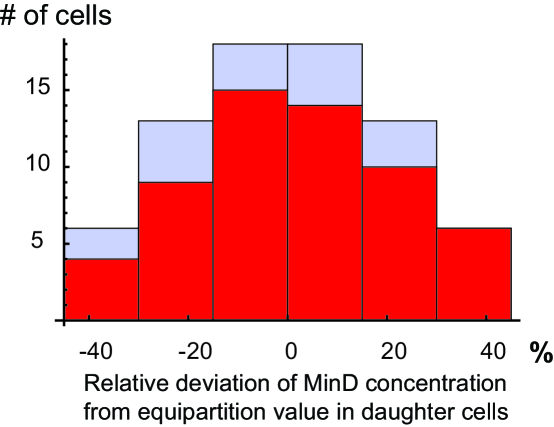
IV.4 MinD is Partitioned Unevenly Between the Daughter Cells During Cell Division
We measured the total fluorescence intensity from daughter cells after cell division (the estimated error is about 10%). We then calculated the associated deviation of the daughter fluorescence from the equipartition value, i.e., the total fluorescence intensity which would be expected if MinD was partitioned equally to both daughter cells. Data from 37 cell divisions give a distribution of relative deviations from the equipartition value with a standard deviation of 21%, Fig. 11. The distribution peaks in the center meaning that a zero deviation is most likely. This is in contrast to the Min distribution suggested by the theoretical results presented by Tostevin and Howard (S4). There, the authors probed the partitioning of Min proteins using a one-dimensional stochastic model including MinD polymerization and the formation of MinD/MinE complexes on the membrane. They simulated the division process assuming a gradually decreased diffusion constant in the cell middle due to cell constriction. As a result, they predicted a distribution of MinD fractions in the daughter cells which peaked at 20% deviation from the equipartition value.
IV.5 Increasing MinE Attachment Rate can Generate a Transition from Stochastic Switching to Regular Oscillations in Cells of Fixed Length
We tested how the Min-protein dynamics changes within our stochastic one-dimensional model with an increasing MinE attachment rate in cells of a fixed length of m. We chose a mean MinD protein number of 1800 and a fixed MinD/MinE ratio of . For each value of we performed 70 simulations with simulation time min each. To mimic the variation of actual protein numbers in real cells, we drew the protein numbers of MinD and MinE from a Gaussian distribution with 10% standard deviation. The remaining parameters of the simulation were , , , , , , , and bin length nm. As a result, we find that the stochasticity of the switching is reduced for increasing coupled with a drop in mean residence time, Fig. 12. For we observe regular oscillations.
IV.6 Stochastic Model Switching Can be Triggered by Other Parameters Than .
As mentioned in the main text and in the previous paragraph, our model predicts a transition from stochastic Min switching to regular oscillations by an increase of the binding rate of MinE to the cytoplasmic membrane. In addition, other model parameters can trigger such a transition in the dynamics (S5). It can be induced by i) an increase of the MinE/MinD ratio in the cell, by ii) a decrease in the density of binding sites on the membrane , by iii) a joint increase of MinE and MinD concentrations, and by iv) a change in MinD binding or MinD/MinE detachment from the membrane (data not shown). A pure increase of the cell length keeping the remaining system parameters constant (including protein concentrations, not protein numbers) results in a trend towards more stochastic switching for longer cells. This is the contrary effect to what we observe experimentally. This effect can be (over)compensated though by an increase of e.g. , as has been shown in Fig. 5 (main text). Only for very short cells smaller than m, the model predictions deviate from the experimental data for the parameter choice presented in Fig. 5. In this length regime, it predicts a decrease of the mean residence time towards smaller cell lengths.
IV.7 Analysis of Alternative Models with Regard to Stochastic Switching
We also analyzed stochastic versions of models presented in (S6) and in (S3) with regard to stationary states and stochastic switching in small E. coli cells. The stochastic simulations that we performed were one-dimensional and relied on a particle based description together with spatial binning (0.13m). The reaction dynamics and particle exchange between the spatial bins due to diffusion was implemented with a Gillespie algorithm (S8). The rates for the attachment, detachment and diffusion processes were chosen as indicated in the refs. S3, S6, S7.
In these models, we did not find switching behavior similar to what we observed in cells. We systematically scanned the neighborhood of the parameter space of the models given in (S6, S7) and (S3), respectively, including independent increase of the parameters up to a factor of 2 and decline up to a factor of 0.5. Particle numbers were varied in the simulations up to 20% from the originally given values.We did not chose a broader range, because the particle densities are chosen according to experimental findings (S2).We always tested cell lengths between 2 and 6 microns. The solutions we found for the models presented in (S3, S6, S7) were either oscillations or noisy homogeneous states.
References
- Corbin et al. (2002) B. D. Corbin, X. C. Yu, and W. Margolin, EMBO J. 21, 1998 (2002).
- Shih et al. (2002) Y. Shih, X. Fu, G. King, T. Le, and L. Rothfield, EMBO J. 21, 3347 (2002).
- Loose et al. (2008) M. Loose, E. Fischer-Friedrich, J. Ries, K. Kruse, and P. Schwille, Science 320, 789 (2008).
- Tostevin and Howard (2006) F. Tostevin and M. Howard, Phys. Biol. 3, 1 (2006).
- Meacci (2009) G. Meacci, Min oscillations in Escherichia coli. Physical Aspects: Experiments and Theoretical Descriptions (VDM, Saarbrücken, Germany), pp. 67-68, (2009).
- Huang et al. (2003) K. C. Huang, Y. Meir, and N. S. Wingreen, Proc. Natl. Acad. Sci. USA 100, 12724 (2003).
- Huang and Wingreen (2004) K. C. Huang and N. S. Wingreen, Phys. Biol. 1, 229 (2004).
- Gillespie (1977) D. Gillespie, J. Phys. Chem. 81, 2340 2361 (1977).