Comment on “Direct Mapping of the Finite Temperature Phase Diagram of Strongly Correlated Quantum Models”
In their Letter Zhou09 , Zhou, Kato, Kawashima, and Trivedi claim that finite-temperature critical points of strongly correlated quantum models emulated by optical lattice experiments can generically be deduced from kinks in the derivative of the density profile of atoms in the trap with respect to the external potential, . In this comment we demonstrate that the authors failed to achieve their goal: to show that under realistic experimental conditions critical densities can be extracted from density profiles with controllable accuracy.
When illustrating their proposal with numerical data (in Figs. 4 and 5), the authors take it for granted that (i) sharp features in only come from the critical behavior (Fig. 4), and (ii) critical behavior in a trapped system necessarily results in a cusp in (Fig. 5). Both assumptions are wrong, and this invalidates the first-principles component of the work.
(i) Sharp features in do not necessarily originate from critical fluctuations. A relevant counterexample would be superfluid helium in a Dewar with the density gradient sharply peaked at the wall. The only direct simulation performed by the authors and presented in Fig. 4 falls in this category. Both sharp features correspond to extremely large gradients of particles (near the trap perimeter) and holes (near the Mott insulator phase), when the particle/hole densities change by over one lattice spacing in the radial direction! In this case it is fundamentally impossible to extract the critical concentration of particles, , or holes, , with controllable accuracy since the critical region is simply absent.
(ii) The four illustrations presented in Fig. 5 are based on the local density approximation (LDA) reconstruction, not the results of simulations in the trap, and are thus misleading. In all cases the density changes by at a distance of just a few lattice spacings, meaning that the size of the critical region is limited, and features in must be dramatically rounded. The effect of finite-size rounding of critical singularities is routinely seen in Monte Carlo simulations but the authors do not address this problem at all. By the very nature of second-order phase transitions LDA inevitably fails because of a divergent correlation radius in the vicinity of a critical point, and this is precisely why the sharp features get rounded. The reader should not be misled by the sharp features in because pronounced kinks in Fig. 5 are hypothetical and do not represent the actual behavior of in a trapped system!
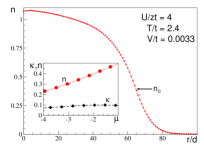
To show how severe the rounding of critical singularities in a trapped system is, and how it makes the precise determination of critical parameters from nearly impossible, we performed simulations of the system specified in Fig. 5(B). The first-principles data are presented in Fig. 1.
In sharp contrast with the LDA plots of Ref. Zhou09 , we observe no features for the published parameters that would allow one to define errorbars through the full width at half maximum (or any characteristic interval) of the experimental curve. This brings us to the above-formulated conclusion. It leaves the question open whether it is feasible to extract critical parameters from the density LDA_violations .
This work was supported by the Swiss National Science Foundation, the National Science Foundation under Grant PHY-0653183, and a grant from the Army Research Office with funding from the DARPA OLE program.
Simulations were performed on the Brutus cluster at ETH Zurich and use was made of the ALPS libraries for the error evaluation ALPS .
Lode Pollet1, Nikolay Prokof’ev2, and Boris Svistunov2,
1Physics Department, Harvard University, Cambridge, MA 02138.
2Department of Physics, University of Massachusetts, Amherst, MA 01003.
References
- (1) Q. Zhou, Y. Kato, N. Kawashima, and N. Trivedi, Phys. Rev. Lett. 103, 085701 (2009).
- (2) A. F. Albuquerque, F. Alet, P. Corboz, et al., Journal of Magnetism and Magnetic Materials 310, 1187 (2007).
- (3) An accuracy of was the standard set by the DAPRA OLE program. Densities outside the range ( to ) shown in the inset of Fig. 1 are thus irrelevant.
- (4) For the answer, see: L. Pollet, N. V. Prokof’ev, B.V. Svistunov, Phys. Rev. Lett. 104, 245705 (2010).