Working Group Summary - Local Universe
Abstract
This is a summary of the discussions that took place in the working group dedicated to studies of the Local Universe. The authors are listed in alphabetical order, after the working group organiser, and are those who gave a presentation during the week in Crete; their contributions are incorporated here. During the group discussions we considered the various synergies that exist between future studies of individual stars and star formation regions at optical/IR wavelengths that will be possible with the E-ELT and those of the molecular and neutral gas in similar regions that will be possible with ALMA and SKA. The primary emphasise was on star formation; both on large and small scales. New facilities will allow more detailed insights into the properties of our own Galaxy and also allow us to make detailed comparisons with a range of more distant systems all forming stars at different rates from different initial conditions (e.g., metallicity) and with different spatial distributions.
1 Introduction
The E-ELT will offer outstanding possibilities for optical/IR imaging and spectroscopy over small fields of view (typically 50 arcsecs) with uniquely high spatial resolution at these wavelengths (few mas). This is ideal for detailed studies of individual stars and ionised gas in our Galaxy and also in other galaxies out to and beyond the distance of the Virgo cluster. What is currently lacking in this field is detailed studies of a range of galaxy types in different environments (e.g., field, group, cluster). Detailed star formation histories and spectroscopic studies of individual stars are presently restricted to the Local Group; in some cases to within the halo of the Milky Way.
The Square Kilometre Array (SKA) will offer a unique new ability to map at radio wavelengths with great sensitivity over large field of views (1 degree at 1 Ghz, and much larger at lower frequencies) with a relatively high spatial resolution (0.220 arcsec). This is ideal for studies of neutral gas, thermal and and non-thermal emission in our Galaxy, the Local Group and well beyond. One crucial aspect of SKA is that the break through will not come only from looking at systems further away but also allowing more detailed observations of the nearby Universe. Observations will be possible with higher spatial resolution to look at small structures and higher surface brightness sensitivity to observe in more detail faint diffuse structures that are believed to surround galaxies. The enhanced sensitivity of a SKA even operating at a 10% of its full capability will lead to significantly more sensitive maps of the gas content for a range of different galaxy types in the nearby universe (and well beyond).
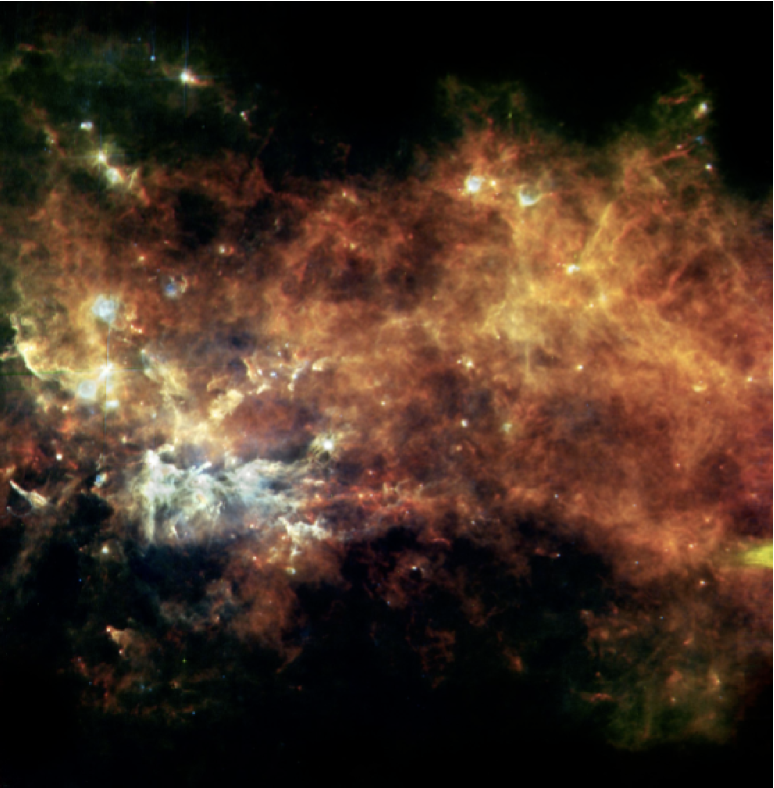
Equally exciting are the detailed studies of star formation processes, but we did not consider these closely as we lacked someone with the necessary experience in the group. It is clear that satellites such as Herschel, the James Webb Space Telescope (JWST) and also the future ground based sub-millimeter array ALMA will offer extraordinary sensitivity to allow exceptionally detailed studies of the properties of molecular gas (see Figure 1) which will allow us to almost watch stars form in the nearby Universe on a spatial and spectral resolution scale similar to that of the E-ELT. This will undoubtedly lead to samples of objects that will require spatial and spectral high resolution follow-up with ELT instrumentation and maybe also SKA.
At first glance it maybe hard to envisage obvious synergies between SKA & E-ELT as the spatial scales observed are very different. However, both wavelength regions provide unique and different information and bringing them together makes a powerful combination for tackling the complex processes of star formation. Gas is the raw material for star formation; looking at HI shows where the stars may form, and for how long; molecular gas facilitates the study of the actual process of gas turning into stars; and optical/IR imaging and spectroscopy allow you to study all the stars that have ever been formed in a stellar system (one by one if the system is close enough). This makes the detailed study of star formation processes an extremely interesting synergy between SKA and E-ELT (and also other major observatories). The careful and sensitive study of magnetic fields is another field that will benefit from the synergy between radio and optical wavelengths, especially if polarisation is considered. Studying individual objects such as masers and variable stars also allows highly accurate mapping of galactic structure and also an accurate distance scale.
The combination of SKA and E-ELT will thus allow us to understand the effect that stars have on their Interstellar Medium (ISM) and also the effect that ISM has on stars. It is a circular process and many aspects are currently poorly understood and yet assumptions and parameterisations of this process permeate all aspects of the interpretation of present day large scale galaxy surveys out to the highest redshifts and also all models of the formation and evolution of galaxies.
2 A Description of general science areas
During the group discussions we considered the various synergies that exist between studies of individual stars and star formation regions at optical/IR wavelengths that will be possible with the E-ELT and those of the molecular and neutral gas in similar regions that will be possible with SKA, and to a lesser extent ALMA and JWST. The primary emphasise was on star formation; both on large and small scales. New facilities will allow more detailed insights into the properties of our own Galaxy and also allow us to make detailed comparisons with a range of more distant systems all forming stars at different rates and with different distributions.
2.1 Resolved Stars
The combination of optical spectroscopy and imaging of individual stars in the nearby Universe can teach us in detail about the dominant processes in galaxy formation and evolution through-out the history of the Universe. This is one of the key science areas identified in the E-ELT science case (and also in all other ELT projects). Studies which resolve individual stars will always benefit dramatically from large increases in spatial resolution and flux sensitivity.
2.1.1 Star Formation Histories
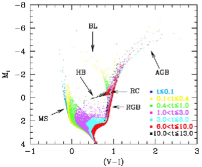
Within the Local Universe galaxies can be studied in great detail star by star. At the beginning of the past century stars were found to group themselves in temperature-luminosity space (observed as colour and magnitude) called the Hertzsprung-Russell Diagram; and it was later understood that the positions reveal the evolutionary sequences of stars of different ages and masses. It is now well established that the resolved Colour-Magnitude Diagrams (CMDs) of stellar systems retain detailed information about the past star formation history (SFH). They preserve the imprint of fundamental evolutionary parameters such as age, metallicity, and initial mass function in such a way that it is often possible to disentangle them (see Figure 2). Because low mass stars have such long lifetimes, for stars with mass this can be longer than the present age of the Universe. Using their photospheres we can probe the ISM from which they formed, and thus measure how the chemical enrichment of the gas in a galaxy changes throughout its history of star formation. This provides detailed information about how enrichment processes such as supernovae explosions and stellar winds affect the evolution of the galaxy and its environment from the early Universe until the present day. The CMD synthesis method is well established as the most accurate way to determine SFHs of galaxies back to the earliest times (e.g., Aparicio & Gallart, 2004; Tolstoy et al., 2009). It clearly depends on the ability to take deep sensitive images with high spatial resolution and to be able to accurately photometer large numbers of stars with a large range of luminosity and colour down to the oldest Main Sequence Turnoffs.
Star formation in our Galaxy occurs over a restricted metallicity range. If we wish to study the effects of much lower metallicities, which more closely match the physical conditions of the early universe we have to look beyond the Milky Way. To see the most active star forming systems (starburst, or Blue Compact Dwarfs, BCDs) then we have to look well beyond the Local Group (e.g., NGC 1569 or M 82).
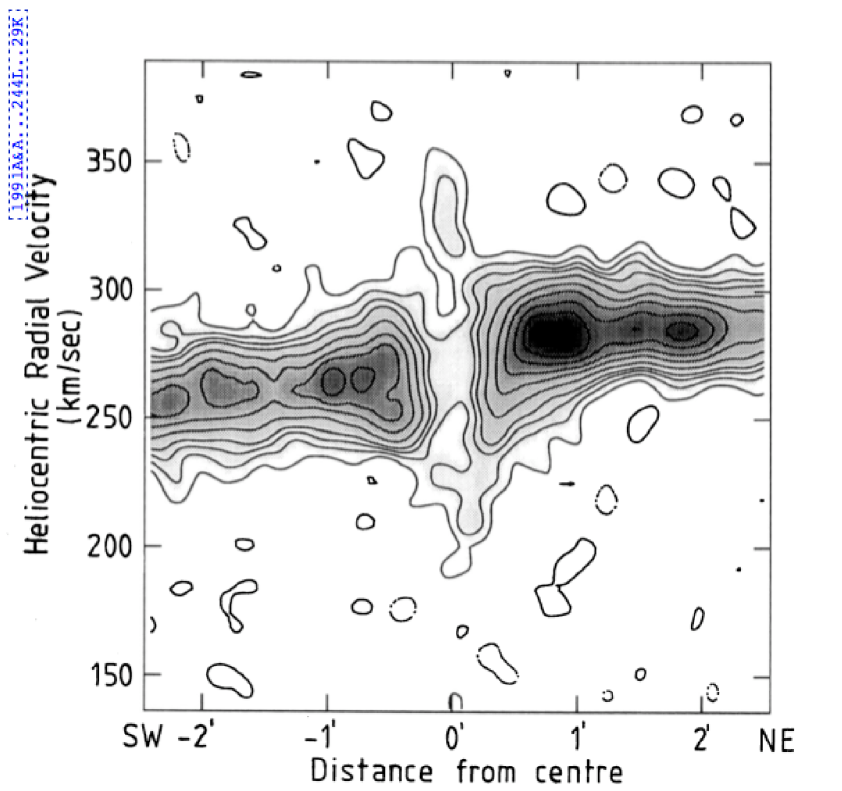
These kinds of studies can be carried out for nearby resolved galaxies in the entirety to study both recent star formation and also the entire star formation history going back to the earliest times. It is possible to look at the properties of gas and star formation in actively star forming systems and compare this in detail to more quiescent systems. The features in HI gas properties (e.g., holes, detailed kinematics, see also Boomsma et al., 2008) can be linked in more detail to the stellar properties - if individual stars can be detected and accurately photometered. It will be possible to verify if the local HI distribution and kinematics are consistent with one or more Supernovae explosion, or stellar winds (see, Figure 3) or if an external explanation always has to be found.
We may hope to distinguish the fundamental differences between Elliptical galaxies and galaxies with disks, and variations of disk type and the importance of bulges. That is to derive a physical understanding of the Hubble sequence. The most serious lack at present in furthering this kind of science case is detailed observations and measurements of resolved stellar populations (e.g., CMD analysis) of galaxies more distant than the Local Group. The ELT project has resulted in a number of detailed simulations of what to expect, so far SKA has not done this (for Local Universe studies), but see Table 1, which gives an overview of SKA capabilities in the Local Universe for a range of different baselines.
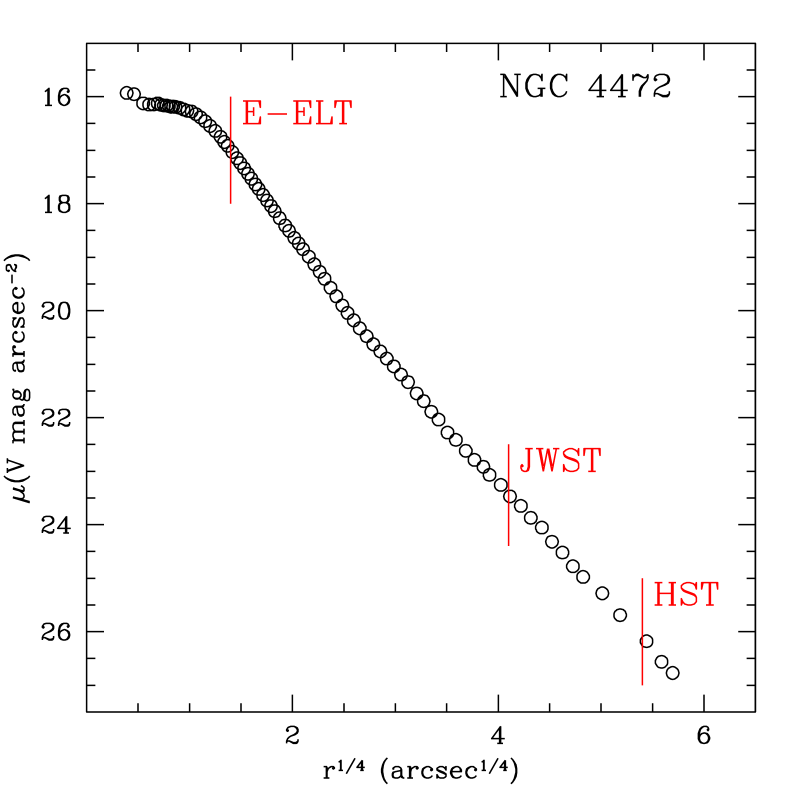
For E-ELT imaging the point spread function is likely to be highly complex and detailed simulations have been carried out as part of the E-ELT/MICADO Phase A study as to how these images can be analysed (by A. Deep and G. Fiorentino). These facilities will also only operate at red wavelengths which also has an effect on the accuracy of the SFH analysis. It is predicted from simulations (Deep et al., in prep), that E-ELT CMDs of a reasonable accuracy can be achieved at the distance of Virgo for a SB(V)=19 mag/arcsec2. This means a distance of 15 arcsec from the centre of the giant elliptical galaxies, close to the core radius. Making it possible for the first time to look in detail at the resolved stellar population of a giant Elliptical near the central (high surface brightness) regions (see Figure 4). Test observations have also been carried out using MAD to understand these effects on the sky (Fiorentino et al., in prep.).
2.1.2 Kinematics & Metallicity
It has long been know that combining kinematics and metallicities is the only means we have to separate the diverse stellar populations in the Solar Neighbourhood (e.g., as first determined by Eggen et al., 1962). Stars can be split up into disk and halo components on the basis of their kinematics and these subsets can then be studied independently. Kinematics and metallicity indicators (lower resolution spectroscopy, R) have been more recently updated and shown to be excellent tools for disentangling the properties of complex stellar systems like our own Galaxy (e.g., Venn et al., 2004) and also other nearby galaxies with sufficiently large samples of stellar spectra have been found to be multi-component stellar systems (e.g., Battaglia, 2007). These studies have shown how the properties of stellar populations can vary spatially and temporally. This leads to important constraints to theories of galaxy formation and evolution.
Dwarf spheroidal galaxies are currently the closest early-type galaxies that contain sufficiently large numbers of well-distributed RGB stars to provide useful kinematic and metallicity probes. Moreover, dSphs are considered to be ideal environments to search for dark matter because of their very large dynamical mass-to-light ratios that cannot be explained by the little luminous matter dSphs contain, assuming that these galaxies are in equilibrium. The velocity dispersion of individual stars can be used to determine the mass of the galaxy. It is also possible to determine metallicities for the same stars. This allows a more careful distinction of the global properties based on structural, kinematic, and metallicity information (e.g., Battaglia, 2007; Battaglia et al., 2008).
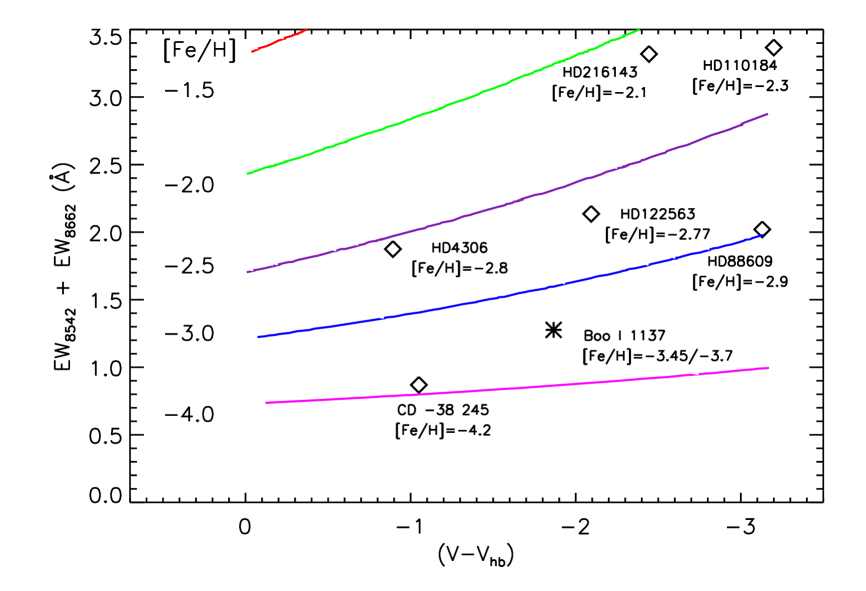
Another aspect of the surveys of individual RGB stars in dSphs has been the determination of metallicity distribution functions (MDFs), typically using the CaII triplet metallicity indicator (e.g., most recently Starkenburg et al., 2010). This uses the empirical relation between the equivalent width of the CaII triplet lines and [Fe/H]. The accuracy of this relation, calibrated on stellar clusters, has been shown to fail at low metallicities, [Fe/H], and this deviation has been quantified. There is now a new calibration extended down to [Fe/H], making the Ca II indicator the most useful and efficient metallicity indicator over the entire range of stellar metallicities (see Figure 5).
There is no reason that these techniques cannot be applied with E-ELT to more distant galaxies. Simulations of spectroscopic observations with E-ELT have been made (by G. Battaglia) to look for detailed metallicity distributions in galaxies at a range of different distances and also to study their kinematics. These simulations, assuming an IFU spectrograph, suggest that detailed studies of a large sample of individual stars can be carried out to 4 Mpc (e.g., Cen A) in reasonable observing times. The shape of the PSF appears to be a limiting factor in the results of the simulations, because in the CaT region it is currently predicted to have an extremely low strehl.
These kinds of detailed kinematic studies are just starting to be carried out in dwarf galaxies with gas, but these will be limited by sensitivity. This means that E-ELT will greatly increase the sample, and range of morphological types, for which this is possible. SKA will greatly increase the sensitivity of existing HI maps and create new ones for more distant systems, including Elliptical galaxies many of which appear to possess HI (e.g., Oosterloo et al., 2007; Serra et al., 2007). SKA will in addition locate new systems as surveys may reveal small, low HI mass galaxies where star formation is progressing very slowly. Local Group Dwarfs will be imaged in HI with unprecedented detail and surpass the interesting results in, for example Leo T (Ryan-Weber et al., 2008).
2.1.3 Stellar Abundances
Detailed Stellar abundances of a range of different chemical elements in individual stars requires high resolution spectroscopy, (R). Spectroscopic studies using large ground-based telescopes such as VLT, Magellan, Keck, and HET have allowed the determination of abundances and kinematics for significant samples of stars mostly in the Milky Way and the most nearby dwarf galaxies (e.g., Tolstoy et al., 2009).
The detailed chemical abundance patterns in individual stars of a stellar population provide a fossil record of chemical enrichment over different timescales. As generations of stars form and evolve, stars of various masses contribute different elements to the system, on timescales directly linked to their mass. Of course, the information encoded in these abundance patterns is always integrated over the lifetime of the system at the time the stars being studied were born. Taking high resolution spectra of individual stars allows us to use a variety of chemical elements as detailed indicators of a variety of physical processes of chemical enrichment (supernovae; AGB stars; planetary nebula; galactic winds etc) and how they varied over time (e.g., McWilliam, 1997). Using a range of stars as tracers provides snapshots of the chemical enrichment stage of the gas in the system throughout the SFH of the galaxy. These studies require precise measurements of elemental abundances in individual stars, and this can only be done with high-resolution and reasonably high signal-to-noise spectra. It is only very recently that this has become possible beyond our Galaxy. It is efficient high resolution spectrographs on 810m telescopes that have made it possible to obtain high-resolution (R 40,000) spectra of RGB stars in nearby dSphs and O, B, and A super-giants in more distant dIs. Looking exclusively at young objects, however, makes it virtually impossible to uniquely disentangle how this enrichment built up over time.
E-ELT can push these possibilities for abundance surveys to the edges of the Local Group and hopefully beyond. The study of resolved stellar populations within the Local Group and out to distances well beyond is one of the key science cases for the ESO E-ELT. As such it has been simulated both for imaging and spectroscopy as part of the ESO Science Working Group and also as part of many of the E-ELT phase A instrument studies (e.g., MICADO, imaging; HARMONI, spectroscopy).
2.2 Gas
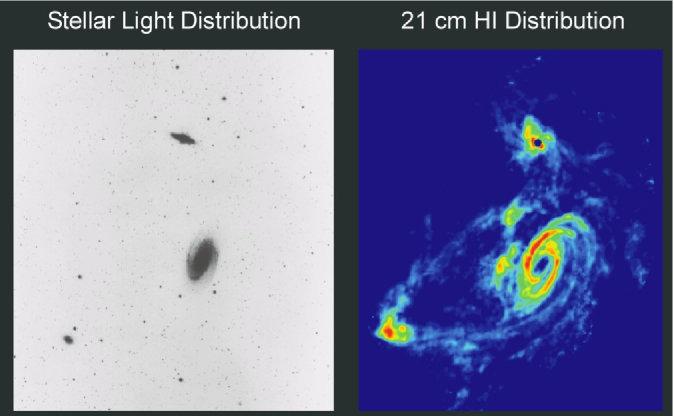
Stars by themselves are excellent probes of global processes going back to the formation epoch of any stellar system. These kinds of studies however do not tell you much about how or why the stars formed. Looking at the stars or the gas properties of a galaxy can tell a very different story (e.g., M 81 and its environs (Yun et al., 1994), see also Figure 7). This is because stars have typically been forming over the age of the galaxy and the gas may be disrupted at any point and so change the evolutionary path of a galaxy. How the gas turns into stars may be deduced from the properties of young stellar populations. This gets more indirect the older the stellar population, so this remains a study that can only be done at present times. The role of feedback in galaxy formation appears increasingly important for coupling theory and observations (e.g., Oppenheimer et al., 2010; Pelupessy & Papadopoulos, 2009) while the evidence for coupling between gas inflows and/or outflows and star formation activity in galaxies is slowly emerging from current observations of HI in and around galaxies (e.g., Sancisi et al., 2008).
-
a
assumed = 50 km/s for and .
-
b
and ) are measured per resolution element assuming a 12 hour integration.
Studying the neutral hydrogen (HI ) gas is relevant in two ways: (i) high spatial resolution imaging will provide a detailed picture of the distribution and kinematics of the high column density HI on scales of a few tenths of parsecs, i.e. the scale of OB associations and star clusters (e.g., see Brinks, 2004); and (ii) low spatial resolution imaging will reveal the large scale distribution and kinematics of extended, low column density HI . Table 1 provides an overview of the limiting HI masses and column densities for different distances in the nearby universe. Note that there is a range of spatial resolutions that will be available with SKA, depending on what fraction of the collecting area is being used. This illustrates the flexibility of the instrument and the fact that useful observations of the nearby Universe can start very early in the construction phase. More detailed information about the capabilities of the SKA for HI imaging can be found in van der Hulst et al. (2004).
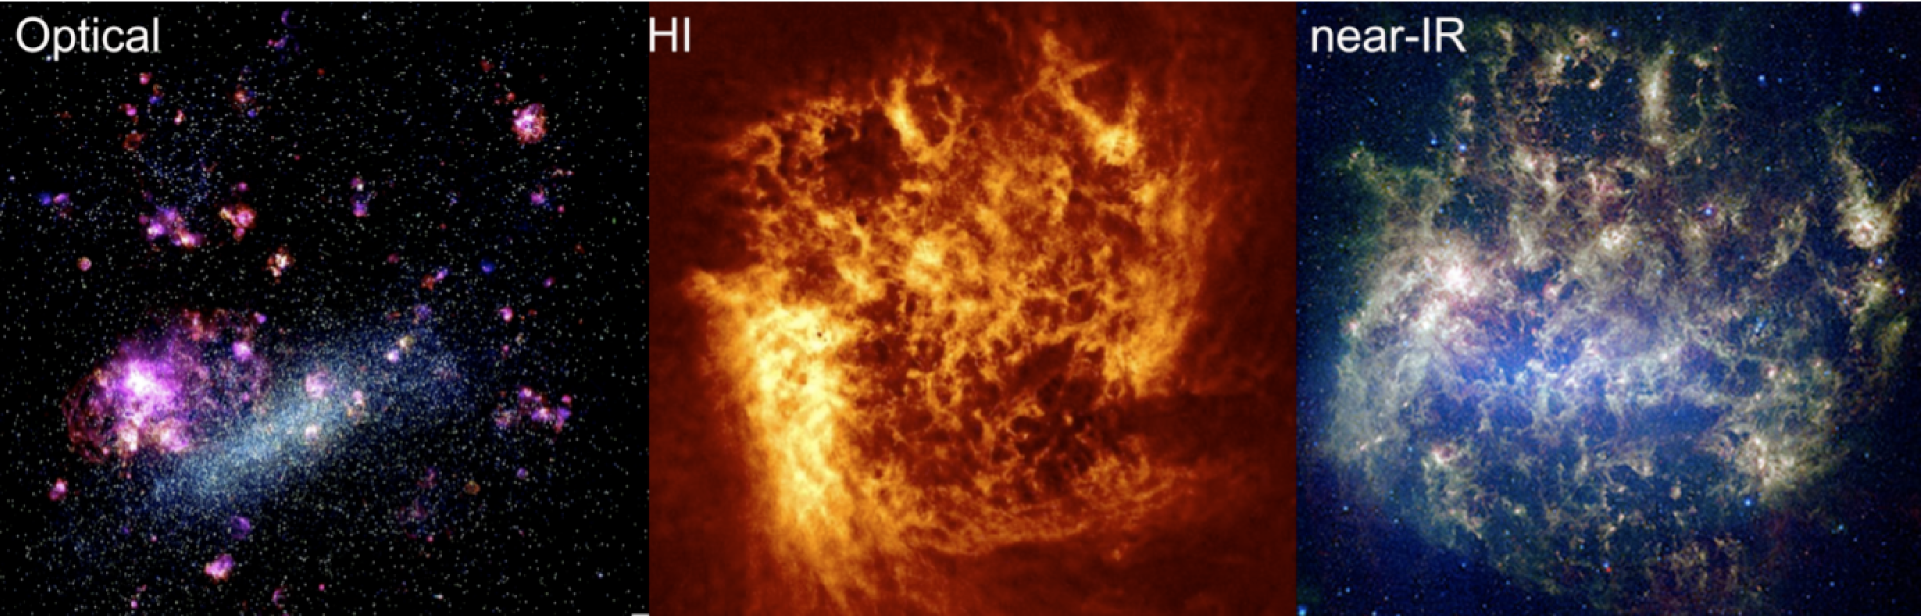
For comparison, current synthesis instruments provide at best column density sensitivities of a few cm-2 with angular resolutions of (e.g., Walter et al., 2008). Though such observations begin to unravel relations between the gas and star formation activity (e.g., Bigiel et al., 2008), the linear resolution (a few hundred parsecs) and sensitivity ( cm-2) are far from adequate. On these spatial scales additional information about the molecular gas, traced with the CO lines, which can be observed by ALMA, will provide complementary information. At present the LMC/SMC is one of the few systems which are near enough to carry out detailed observations in HI , molecular gas, radio continuum, ionised gas and individual stars (see Figure 6). However, it is very hard to generalise about this system as it is clearly undergoing a very strong interaction with the Milky Way. This is the kind of study that the combination of SKA and E-ELT will allow us to carry out for a range of different galaxies large and small in nearby groups (e.g., Sculptor group) and also in large clusters such as Virgo and Coma where we start to find large Elliptical galaxies in HI . We will also be able to carry out much more detailed surveys of galaxies in the Local Group which are currently not accessible to detailed high resolution spectroscopy or very deep imaging (e.g., M31/M33 and also a range of large and small dwarf galaxies).
The local Universe, going out to Virgo cluster (at 20 Mpc) will provide uniquely detailed insight into the formation and evolution of both gas and the relation to stars for a large range of galaxy types. Further afield even the SKA resolution will not be adequate to examine details on the tens of parsec scales. Only in the local Universe will it be possible to connect global HI signatures: interaction, global outflow, accretion, presence of HI companions (e.g. as demonstrated in Sancisi et al., 2008) with the detailed gas properties on small scales. SKA will thus provide crucial information. Table 1 demonstrates that such HI signatures can easily be recognised in galaxies well beyond the Virgo cluster.
2.3 Magnetic Fields
Studying synchrotron emission in the Milky Way and beyond will provide insights into galactic-scale magnetic fields and the effects of small-scale magnetic fields on ISM processes and star formation. Polarised radio emission is a tracer of ordered fields in the warm ionised ISM, fields in gas clouds can be studied by Zeeman measurements of radio lines, and IR polarimetry gives access to magnetic fields in dust clouds. Polarimetry for the E-ELT is crucial to exploit these synergies with SKA.
The tight correlation between infrared and radio continuum intensities tell us that magnetic fields and star formation are closely related, but we are far from understanding how this coupling works. Are magnetic fields amplified by turbulent gas motions excited by supernova remnants, by stellar outflows or by shearing and compressing motions due to the gravitational distortions around spiral arms and bars? MHD modelling shows that magnetic fields are amplified to the equipartition level with turbulent kinetic energy within short time and then affect the gas flows (de Avillez & Breitschwerdt, 2005). The structure of collapsing molecular clouds and the formation of star clusters can also be significantly modified by magnetic fields (Price & Bate, 2008). Observational tests need high spatial resolution and sensitivity in selected star-forming regions of the Milky Way. The SKA will provide the radio polarization and Zeeman data, ALMA the molecular clouds, while the E-ELT can observe the dust polarisation. The shear and compression of the gas flows as measured from the kinematics of ionised gas (E-ELT), HI (SKA) and CO (ALMA) can be compared with the magnetic field strength (SKA). This will allow us to directly observe the interaction between gas and magnetic fields.
One of the open questions is whether ambipolar diffusion or turbulence governs the field evolution in collapsing molecular clouds (Crutcher et al., 2009). High-resolution IR and sub-mm polarimetry and Zeeman radio data are needed here. Radio continuum can provide information about the ambient magnetic field and the amount of magnetic braking of the rotating cloud. Is also possible that rotating clouds drive dynamos which would further enhance the field.
Combined SKA and E-ELT observations are also of great interest in low-luminosity dwarf galaxies, as described in section 2.1.2, and especially in BCD and dwarf irregular galaxies where active star formation is ongoing. Is there a threshold in gas density for the onset of star formation? How strong are environmental effects? Are outflows more frequent in galaxies with lower gravitational potential? The answers to these questions need combined efforts from the radio and optical ranges. Magnetic fields mapped by radio polarisation may show us interactions with the environment and outflows. On the other hand, the threshold for field amplification could well be higher than that for star formation, so that only thermal radio emission is observable. Galaxies without magnetic fields probably have a steeper IMF and can serve as a template for the first star-formation regions in the early Universe.
The generation of large-scale magnetic fields by the mean-field dynamo needs differential rotation and turbulence, both of which are weak in low-luminosity dwarf galaxies. Kinematic information from a sample of dwarfs with different star-formation rates obtained with the E-ELT can provide important parameters to understand how the dynamo works.
Other classes of galaxy where little is known about their magnetic fields are giant Ellipticals and Dwarf Spheroidals (dSph). The lack of any ongoing star formation makes them especially ideal candidates to search for synchrotron emission from secondary particles produced by decaying dark matter (Colafrancesco et al., 2007), but only if magnetic fields exist. Field amplification needs turbulence which can be provided by turbulent wakes in the gas or by the magneto-rotational instability. The detection of warm or hot gas and kinematic information, which needs the E-ELT sensitivity and resolution, are crucial here.
In Elliptical galaxies with hot gas, relics of a large-scale magnetic field from the period of strong star formation may have survived. A sample of galaxies with different star-formation histories, as measured from their stellar populations, will allow us to measure the lifetime of magnetic fields after star formation ended.
2.4 Astrometry
Many astrophysical properties of objects in star forming regions, like the size, luminosity, and mass, depend strongly on the distance. Therefore, a true understanding of star formation and a detailed comparison of theoretical models and observations is only possible if accurate distances are known to star forming regions. Current galactic distance estimates are often affected by dust obscuration (photometric distances) or highly model dependent (kinematic distances). A completely unbiased method to estimates distances is the trigonometric parallax, which requires extremely precise astrometric measurements in the range of a few micro-arcseconds (as). While Gaia will measure parallaxes of a billion stars in the Galaxy, it will not probe parts of the Galaxy that are obscured by dust, i.e. large parts of the plane of the Milky Way beyond 1 or 2 kpc inward from the Sun and in particular not the deeply obscured regions where new stars are forming. However, radio observations at cm-wavelengths are not hindered by dust and can provide a view of the Milky Way that is complementary to Gaia.
Currently, astrometric radio observations of methanol and water masers in star forming regions with Very Long Baseline Interferometry (VLBI) can reach parallax accuracies of up to 6 as (Reid et al. 2009a, ; Hachisuka et al., 2009). Therefore, these observations have the potential to measure accurate distances to most Galactic star forming regions, to map the spiral structure of a large part of the Milky Way, and to determine important parameters such as the rotation velocity and the distance to the galactic center with high accuracy (Reid et al. 2009b, ).
SKA will have even better astrometric capabilities than current VLBI arrays. Since systematic errors from the atmosphere or the array geometry (e.g. antenna positions, earth orientation parameters) scale directly with the angular separation of the reference and target sources on the sky, it is essential to use reference sources that are as close as possible. The superior sensitivity will allow the use of much weaker (and therefore much closer) background reference sources. With parallax accuracies approaching 1 as, the SKA can measure distances to sources out to 10 kpc with 1% accuracy.
SKA in phase I can already observe the important 6.7 GHz methanol maser line. This line is a tracer of high mass star formation, widespread in the Galaxy, and has been already used for astrometric observations (Rygl et al., 2010). In phase III, SKA will also cover the 22 GHz water maser line, the strongest maser line in star forming regions. Furthermore, the large continuum sensitivity of the SKA allows the observation of radio stars at much larger distances than the few hundred parsec currently possible (Menten et al., 2007; Loinard et al., 2007).
2.5 Star Formation
This is a complex subject which has perplexed astronomers for many years. It is clear that all the answers don’t come from only studying the stars or only studying the newly formed stars. The approach is a complex multi-wavelength analysis using all the constraints on a variety of different scales that star formation operates on. There is still much to do in our Galaxy. Star formation typically occurs in regions deeply embedded in dusty molecular gas clouds (e.g., young clusters, BCDs etc) and one of the highly desirable observations is to observe these processes in detail in a variety of environments. It is only by observing different physical conditions that we can hope to fully understand the different processes that dominate star formation. These kind of observations require a sensitive IR imaging telescope. Herschel is making a start, and JWST will add to this but E-ELT should have superior spatial resolution and sensitivity.
2.5.1 Young Star Clusters
Young clusters are extremely small dense systems, with central surface densities up to 1000 objects per square arcsecond and they are typically hidden behind and within large amounts of dust, producing up to 200 mag of visual extinction. At present, with HST/WFC3 (but up to 1.6 m), it is only possible to look into a few of the nearby bright, less extincted ( 50-100 mag) and less crowded young clusters, which are at a late stage of cluster dynamical evolution. In the future, with JWST this will be extended to near- and mid-IR wavelengths. To study a variety of these systems in a range of different physical conditions throughout the MW and beyond, deep IR adaptive optics imaging with the E-ELT at a quasi-diffraction limited resolution of 10 mas in the -band (15 mas and 25 mas in the - and -band, respectively) is required. Follow-up integral field spectroscopy will also be important to study dynamical processes associated with the cluster formation, such as tight binary formation and gravitational interactions followed by stellar ejections.
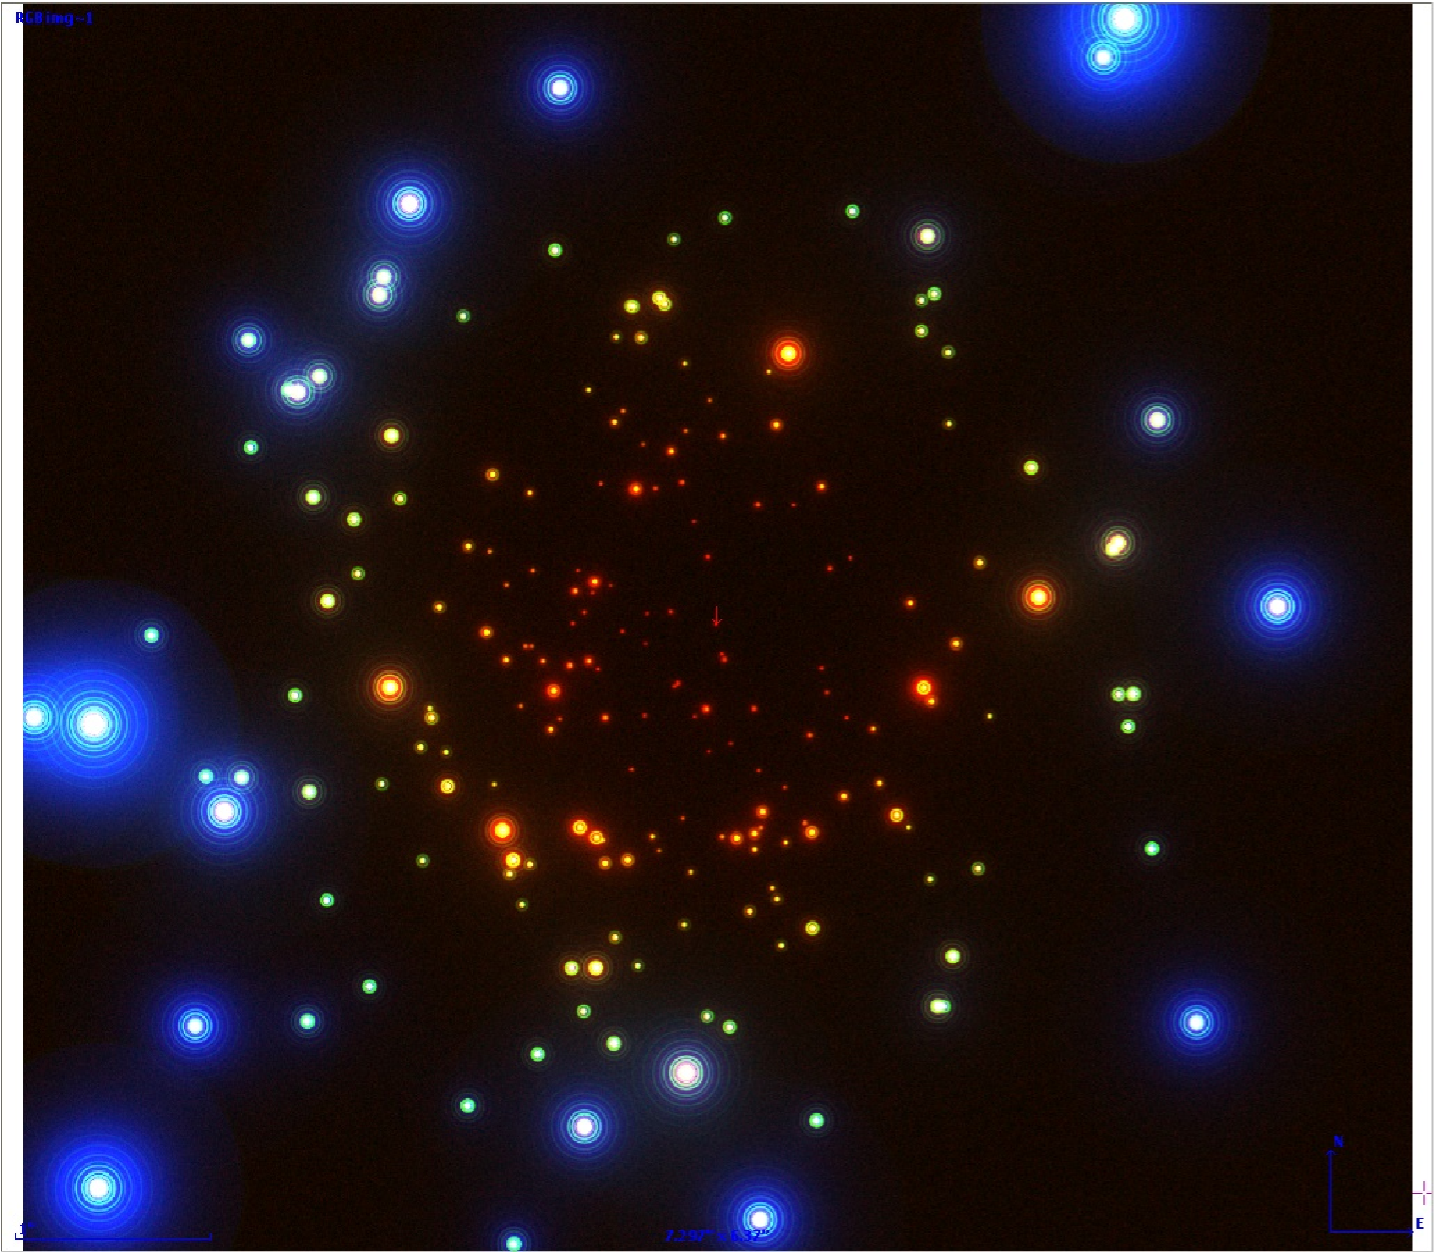
Detailed simulations have been carried out (by A. Calamida, see Figure 8) to predict what (and how) we may be able to observe deeply embedded massive stars and protostars just formed in dense Galactic protocluster clouds (ultra-compact HII regions, hot cores, outflow and maser sources). The main restriction on this is spatial resolution and sensitivity. The imaging simulations confirmed that in order to penetrate an extinction as high as = 200 mag we will have to observe in the and -band. With the E-ELT and a total exposure time of 1 hr (+ overheads), we will be able to observe deeply embedded ( = 200 mag) massive dense clusters at the distance of the Galactic center (GC), i.e. 7 kpc. The completeness of the Colour-Magnitude Diagram (CMD) is 25% but this would be sufficient to determine the stellar number density of the cluster adopting -band star counts. We will be able to observe massive dense clusters in the GC in the case of a uniform extinction distribution of = 150 mag, in the bands, with a total exposure time of 25 hrs (+ overheads), reaching the faintest magnitudes ( 29-29.5 mag) with 10. The completeness of the three colour CMDs is 100% and we would be able to study the stellar number density of the cluster and to probe the presence of hot and warm circumstellar matter (disks/envelopes) by means of the detection of infrared excess (in the colours and ). If a clumpy extinction is present in the cluster, the completeness of the CMDs will decrease according to the scale length of the extinction clumps. If the assumed scale is 0.25” at the GC distance, we will be able to recover 34% of stars in the -band, 64% in the -band and 97% in the -band with 5. In the case of a Gaussian extinction distribution, the recovered fractions will be 90% for the three IR bands. The presence of mass segregation at the level of 50% of stars with masses 20-30 being in the inner cluster core does not affect the result of the simulations. We will then be able to detect the presence of mass segregation in a dense massive cluster at the distance of the GC, if the extinction is less than = 200 mag.
Finally we mention that ALMA will have a similar spatial resolution (10 mas) at sub-mm wavelengths as the E-ELT in the near- and thermal infrared. Hence, while E-ELT will be particularly good at detecting stars at the end of their main accretion phase, ALMA should see protostars, i.e. massive stellar objects in their early main mass assembly phase. Together E-ELT and ALMA are a powerful combination to reveal one of the most hidden but most important secrets of stellar astrophysics: the origin of massive stars. SKA will be capable of imaging the thermal, ionised gas at sub-arcsec resolution. The thermal radio emission allows an extinction-free measurement of the total input of ionising photons in the star formation region.
2.6 Variable Stars
2.6.1 Population Indicators
Despite ever improving star formation histories of Local Group dwarf galaxies from CMD analysis, many uncertainties remain in the identification and characterization of the oldest stellar populations. This is because the old stellar populations can be hard to interpret, or even detect, due to their inherent faintness and scarcity, and often a strong overlying young population makes the crowding due to much brighter stars difficult to overcome. Despite crowding and faintness variable stars can be relatively easy to pick out in the crowded images and their light curves accurately determined. The easy detection and identification of certain classes of variable stars help our understanding of the SFH at ages which are difficult to retrieve from CMD analysis alone.
As an example, RR Lyrae variable stars are all Gyr old and amongst the easiest (and brightest) ancient stars to unambiguously identify and study. They are in fact low mass stars (M 0.8 M⊙) belonging to the Horizontal Branch. They are about 3 mag brighter than their old MSTO counterparts, which makes them easy to unambiguously select for further study. The Leo A dwarf Irregular galaxy has been the subject of a deep CMD study with HST/ACS (Cole et al., 2007), providing an accurate SFH using main sequence turnoffs. There appears to have been only a small and uncertain amount of star formation in Leo A at the earliest times. The star formation rate at the oldest times determined from CMD analysis alone is clearly not very reliable. However, there is no doubt that there is an ancient population, due to the presence of RR Lyrae variable stars (Dolphin et al., 2002). RR Lyrae have also been discovered in the nearby elliptical galaxy M32 (see Fiorentino et al. 2010a, ). This is an extreme case, where due to the prohibitive crowding (Monachesi et al., submitted) ancient main sequence turnoffs could not be detected. Here again, variables represent the only way to constrain the presence of a stellar population Gyrs old in this galaxy. Today the photometric detection limit for the HB is 2.5 Mpc with HST. This limit will be extended to 6.3 Mpc with E-ELT and will allow us to extend the variable star detections to the whole Local Universe (Karachentsev et al., 2004).
2.6.2 The distance scale
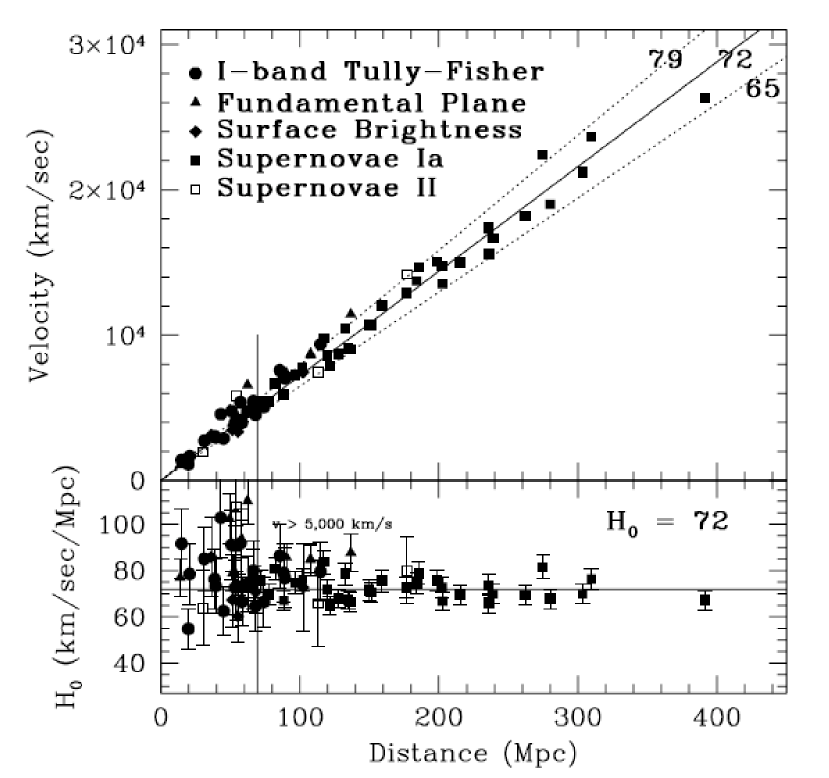
RR Lyrae are very robust distance indicators due to their very well known K-band period-luminosity relation. However the most common primary distance indicators are the Classical Cepheids. Observed in young stellar system these are youngest and most luminous (MI up to -5 mag) variable stars and they play a key role as primary distance indicators in the cosmic distance ladder. Due to the existence of a Period-Luminosity relation, they allow the calibration of the SNIa till distances out to 22 Mpc (e.g., Freedman et al., 2001). The absolute calibration of the SNeIa luminosity peak, and thus the H0 measurement, is currently “anchored” to the Cepheid-based distances to 10 nearby galaxies, and for this reason Classical Cepheids are the cornerstones for the absolute calibration of the extragalactic distance scale. However, the “universality” of the Cepheid Period-Luminosity relation, and the possibility that the slope and zero point are sensitive to chemical composition, has been highly debated for almost two decades (e.g., Romaniello et al., 2009). Most of the observational and theoretical efforts have concentrated on galaxies with a metal content ranging from the Small Magellanic Cloud (SMC) value (Z 0.004) to the most metal-rich galaxies known (Z 0.04), and very little is known for more metal-poor systems. The effect is still an open issue, and leads to an overall uncertainty on H0 of up to 20 %.
In this framework, a very promising but still largely unexplored class of standard candles is represented by the ultra long period Cepheids (ULPs; periods larger than 80 days), recently identified in nearby star-forming galaxies (LMC, SMC, NGC 6822, NGC 55, NGC 300). First, because the possible flattening of the PL relation at such long periods makes the ULP Cepheids better standard candles than shorter period Classical Cepheids. Second, and more importantly, because ULPs are much brighter (by 2-4 magnitudes) than typical, shorter period, Classical Cepheids (M mag) used so far to set the extragalactic distance ladder. Gaia will provide trigonometric parallaxes at arcsec accuracy, hence precise direct distances, of the LMC and SMC ULP Cepheids. A preliminary application to currently known ULP Cepheids of the Wesenheit relation commonly used to derive Cepheid distances suggests a possible metallicity dependence, accounting for about 0.5 mag (over 1.5 dex metallicity spread) of the scatter observed in the ULP’s PL relation. However, these results are not very secure mostly because only 20 ULP Cepheids are known so far. However, most of these variables are in galaxies with metallicities at or above the SMC (Z 0.004). The only exception is represented by the two ULPs recently discovered in the most extremely metal-poor (Z0.0004, 1/50Z⊙) Blue Compact Dwarf (BCD) galaxy I Zw 18 (Fiorentino et al. 2010b, ). These are the two lowest metallicity ULPs known so far, and also the most metal-poor Classical Cepheid.
ULP Cepheids observed with HST can be used as “stellar standard candles” to measure directly distances up to 100 Mpc. This is several times the current observational limit (22 Mpc: Freedman et al., 2001) Cepheid and in the unperturbed “Hubble Flow” domain. The ULP’s potential will be extensively enhanced by E-ELT. On the basis of E-ELT simulations, under the reasonable hypothesis that variable stars can be measured as faint as 1 mag above the detection limit, assuming a 1 hour exposure time, it has been shown that ULPs will be observable out to a distance of 320 Mpc. This will make it the first primary distance indicator capable of directly measuring H0. The E-ELT will thus be able to play an unprecedented role in the definition of the Cosmic Distance Ladder. Distances affect all aspects of the interpretation of observations of galaxies, from the true mass of young stars, to the correct interpretation of the gas and stellar properties.
3 Conclusions
HST and VLT led to astonishing breakthroughs over the last few decades, by going to higher spatial resolution and increasing sensitivity limits. ELT and SKA will undoubtedly do the same.
By combining SKA and ELT observations of a range of galaxy types in the nearby universe (20Mpc) we can both focus on individual objects and look at the global properties – for a range of star forming conditions, allowing variation in: metallicity, density, environment, dark matter content, rotation, large scale kinematic structures and really start to understand HOW and WHY stars form on a range of scales, which is an important aspect to allow accurate interpretation of both CMDs from resolved stellar populations and faint fuzzy blobs at high redshift. We also will have the chance to make exceptionally detailed studies of the magnetic fields in a different range of galaxy types.
By studying galaxy with only gas observations or only stellar observations will always give an incomplete picture of evolutionary processes
Acknowledgements.
We gratefully acknowledge significant input from Tom Oosterloo and Elias Brinks in defining the nearby universe SKA potential; Hans Zinnecker and Mario Nonino in the young stellar clusters ELT science case.References
- Aparicio & Gallart (2004) Aparicio, A. & Gallart, C. 2004, AJ, 128, 1465
- de Avillez & Breitschwerdt (2005) de Avillez, M.A. & Breitschwerdt, D. 2005, A&A, 436, 585
- Battaglia (2007) Battaglia, G. 2007, Phd Thesis, University of Groningen
- Battaglia et al. (2008) Battaglia, G., Helmi, A., Tolstoy, E., et al. 2008, ApJL 681, L13
- Bigiel et al. (2008) Bigiel, F., Leroy, A., Walter, F., et al. 2008, AJ, 136, 2846
- Boomsma et al. (2008) Boomsma, R., Oosterloo, T.A.,Fraternali, F., et al. 2008, A&A, 490, 555
- Brinks (2004) Brinks, E. 2004, New Astronomy Reviews, 48, 1305
- Colafrancesco et al. (2007) Colafrancesco, S., Profumo, S. & Ullio, P. 2007, Phys. Rev. D, 75, 023513
- Cole et al. (2007) Cole, A.A., Skillman, E.D., Tolstoy, E., et al. 2007 ApJL, 659, L17
- Crutcher et al. (2009) Crutcher, R.M., Hakobian, N. & Troland, T.H. 2009, ApJ, 692, 844
- Dolphin et al. (2002) Dolphin, A., Saha, A., Claver, J., et al. 2002, AJ, 123, 3254
- Eggen et al. (1962) Eggen, O.J., Lynden-Bell, D. & Sandage, A.R. 1962, ApJ, 136, 748
- (13) Fiorentino, G., Monachesi, A., Trager S.C., et al. 2010, ApJ, 708, 817
- (14) Fiorentino, G., Contreras, R.R., Clementini, G., et al. 2010, ApJ, 711, 808
- Freedman et al. (2001) Freedman, W.L., Madore, B.F., Gibson B.K., et al. 2001, ApJ, 553, 47
- Hachisuka et al. (2009) Hachisuka, K., Brunthaler, A., Menten, K.M., et al. 2009, ApJ 696, 1981
- van der Hulst et al. (2004) van der Hulst, J.M., Sadler, E.M., Jackson, C.A., et al. 2004, New Astronomy Reviews, 48, 1221
- Kamphuis et al. (1991) Kamphuis, J., Sancisi, R. & van der Hulst, J.M. 1991, A&A Lett, 244, 29
- Karachentsev et al. (2004) Karachentsev, I.D., Karachentseva, V.E., Huchtmeier, W.K. & Makarov, D.I. 2004, AJ, 127, 2031
- Loinard et al. (2007) Loinard, L., Torres, R.M., Mioduszewski, A.J., et al. 2007, ApJ 671, 546
- McWilliam (1997) McWilliam, A. 1997 ARAA, 35, 503
- Menten et al. (2007) Menten, K.M., Reid, M.J., Forbrich, J. & Brunthaler, A. 2007, A&A 474, 515
- Oosterloo et al. (2007) Oosterloo, T.A., Morganti, R., Sadler, E.M., et al. 2007, A&A, 465, 787
- Oppenheimer et al. (2010) Oppenheimer, B.D., Davé, R., Kereš, D., et al. 2010, MNRAS, 406, 2325
- Pelupessy & Papadopoulos (2009) Pelupessy, F.I. & Papadopoulos, P.P. 2009, ApJ, 707, 954
- Price & Bate (2008) Price, D.J. & Bate M.R. 2008, MNRAS, 385, 1820
- (27) Reid, M.J., Menten, K.M., Brunthaler, A., et al. 2009a, ApJ 693, 397
- (28) Reid, M.J., Menten, K.M., Zheng, X.W., et al. 2009b, ApJ, 700, 137
- Romaniello et al. (2009) Romaniello, M., Primas, F., Mottini, M., et al. 2009, AIP Conference Proceedings, 1170, 99
- Ryan-Weber et al. (2008) Ryan-Weber, E.V., Begum, A., Oosterloo, T., et al. 2008, MNRAS, 384, 535
- Rygl et al. (2010) Rygl, K.L.J., Brunthaler, A., Reid, M.J., et al. 2010, A&A 511, A2
- Sancisi et al. (2008) Sancisi, R., Fraternali, F., Oosterloo, T. & van der Hulst, J.M. 2008, A&ARv, 15, 189
- Serra et al. (2007) Serra, P., Trager, S.C., van der Hulst, J.M., et al. 2007, NewAR, 51, 3
- Starkenburg et al. (2010) Starkenburg, E., Hill, V., Tolstoy, E., et al. 2010, A&A, 513, 34
- Tolstoy et al. (2009) Tolstoy, E., Hill, V. & Tosi, M. 2009, ARAA, 47, 371
- Venn et al. (2004) Venn, K.A., Irwin, M.J., Shetrone, M.D., et al. 2004, AJ, 128, 1177
- Walter et al. (2008) Walter, F., Brinks, E., de Blok, W.J.G., et al. 2008, AJ, 136, 2563
- Yun et al. (1994) Yun, M.S., Ho, P.T.P. & Lo, K.Y. 1994, Nature, 372, 530