Electronic properties of molecular solids: the peculiar case of solid Picene
Abstract
Recently, a new organic superconductor, K-intercalated Picene with high transition temperatures (up to 18 K) has been discovered. We have investigated the electronic properties of the undoped relative, solid picene, using a combination of experimental and theoretical methods. Our results provide detailed insight into the occuopied and unoccupied electronic states.
pacs:
71.20.Rv 71.35.-y 78.20.-e 78.90.+t1 Introduction
Molecular crystals - built from conjugated molecules - have been in the focus of research for a number of reasons. Within this class of materials, almost every ground state can be realized at will, spanning from insulators to semiconductors, metals, superconductors or magnets. Due to their relatively open crystal structure their electronic properties can be easily tuned by the addition of electron acceptors and donors. In some cases, this resulted in intriguing and unexpected physical properties. A prominent example for the latter is the formation of metallic, superconducting or insulating phases in the alkali metal doped fullerides depending on their stoichiometry.[1, 2, 3, 4] In particular the superconducting fullerides (e.g. K3C60) have attracted a lot of attention, and rather high transition temperatures above 30 K could be realized. More recently, interesting phenomena were observed in other alkali metal doped organic molecular crystals as the observation of an insulator-metal-insulator transition in alkali doped phthalocyanines.[5] However, superconductivity with high transition temperatures similar to those of the fullerides could not be observed in other molecular crystals despite many research activities until recently, when superconductivity has been reported for another alkali metal doped molecular solid, K3Picene, with transition temperatures up to 18 K.[6]
Here we present the first comprehensive investigation of the electronic properties of undoped solid picene using state-of-the-art experimental tools and first-principles many-body calculations. Our results provide a detailed analysis of the occupied and empty states, confirming unambiguously the presence of four flat quasi-degenerate conduction bands that could give rise to a high density of states around the Fermi level in the n-doped compound. Moreover, the measured spectral properties can only be accounted for once the anisotropy of the structure, local-field corrections and electronic correlations are considered.
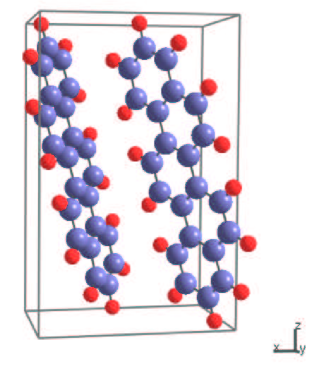
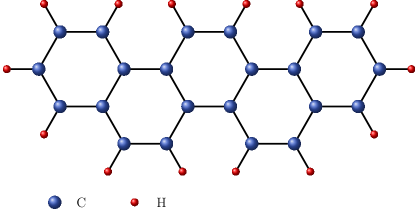
The Picene molecule is made by 5 benzene rings as depicted in Fig. 1. In the condensed phase, Picene adopts a monoclinic crystal structure, with lattice constants = 8.48 Å, = 6.154 Å, = 13.515 Å, and = 90.46∘, the space group is P21, and the unit cell contains two inequivalent molecules.[7] The molecules arrange in a herringbone manner which is typical for many aromatic molecular solids.
2 Methods
For our photoemission studies, Picene films with a thickness of about 6 nm have been prepared by in-situ thermal evaporation with an evaporation rate of 0.1 nm/min. onto a clean, polycrystalline gold substrate under ultra high vacuum conditions. The X-ray (XPS) and ultra-violet (UPS) photoemission spectroscopy experiments have been carried out using a commercial PHI 5600 spectrometer, equipped with two light sources. A monochromatized Al Kα source provides photons with an energy of 1486.6 eV for XPS. Photons with an energy of 21.21 eV (He discharge lamp) are used for valence band measurements. All UPS measurements were done by applying a sample bias of -5 V to obtain the correct, secondary electron cutoff which is required to determine the work function and the ionization potential. The recorded spectra were corrected for the contributions of He satellite radiation. The total energy resolution was about 350 meV (XPS) and 100 meV (UPS), respectively. The binding energy (BE) scale was aligned by measuring the Fermi edge (0 eV) and the Au4f7/2 emission feature (84.0 eV) of the polycrystalline gold substrate. For further details of the substrate cleaning and film characterization we refer the reader to previous publications.[8]
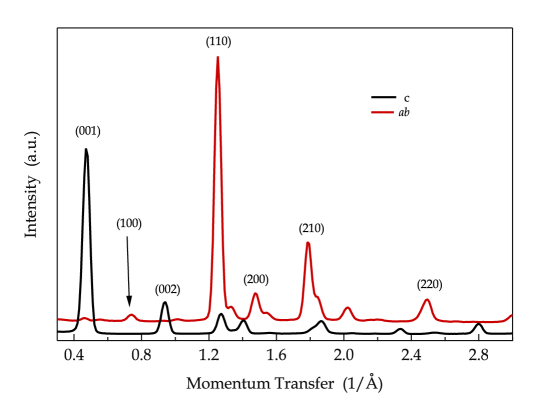
For our investigations using electron energy-loss spectroscopy (EELS) in transmission we have prepared Picene films with a thickness of about 100 nm by thermal evaporation under high vacuum onto single crystalline KBr substrates kept at room temperature. Thereby, two deposition rates, 0.2 nm/min and 4 nm/min, have been chosen to obtain films with different crystal orientations. Subsequently, the Picene films were floated off in distilled water and mounted onto standard electron microscopy grids. Prior to the EELS measurements the films were characterized in-situ using electron diffraction. All observed diffraction peaks were consistent with the crystal structure of Picene as given above. Moreover, the diffraction spectra revealed a pronounced texture, whereas the films grown with a deposition rate of 0.2 nm/min showed a strong preference of crystallites with their -plane parallel to the film surface, while those films grown with 4 nm/min showed a substantial amount of crystallites with their -axis in the film surface (see [9] Fig. 6). The EELS measurements were carried out at room temperature using a 170 keV spectrometer described elsewhere.[10] We note that at this high primary energy only singlet excitations are possible. We have measured the loss function Im (-1/ ( is the dielectric function) for a small momentum transfer as well as the core excitation from the C1s core level into unoccupied states. The energy and momentum resolution were chosen to be 85 meV and 0.03 Å-1, respectively. The measured loss functions have been corrected for contributions from the elastic line.[10] For further details of the sample preparation procedure for EELS and the experimental technique see [10, 11].
Experimental measurements have been complemented by first-principle electronic structure calculations.
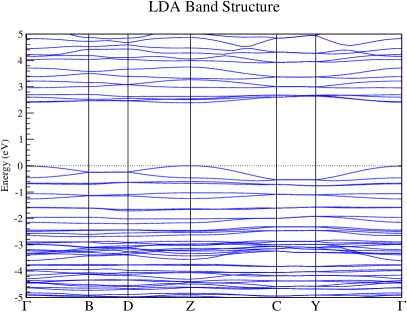
Since density-functional theory (DFT) in local-density approximation (LDA) is known to underestimate band gaps [12],
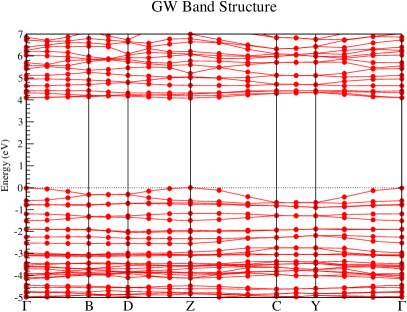
quasiparticle energies have been calculated using the accurate self-energy approximation [13] of many-body perturbation theory,
where the self-energy is given by the product of the Green’s function and the dynamically screened Coulomb interaction .
The crystal structure has been optimized in LDA starting from experimental positions from Ref. [7]
We have simulated the experimental loss functions in the random-phase approximation RPA [12],
using norm-conserving pseudopotentials (with an energy cutoff of 40 Ha in the plane-wave basis set),
including 700 LDA bands in a 4x4x2 Monkhorst-Pack grid of points.
Crystal local-field effects [12] are taken into account by inverting a matrix of rank 73 vectors
in the reciprocal space.
For self-energy calculations we have used 7000 plane waves in the expansion of the wavefunctions, 350 empty bands,
a 6x6x4 Monkhorst-Pack -point grid, and a plasmon-pole model approximation in the calculation of .
Quasiparticle energies are obtained as first-order corrections to LDA eigenvalues. For comparison the calculated spectra have been convoluted with a Gaussian function of half width of 0.2 eV for the PES and 0.075 eV for the EELS.
3 Results and Discussion
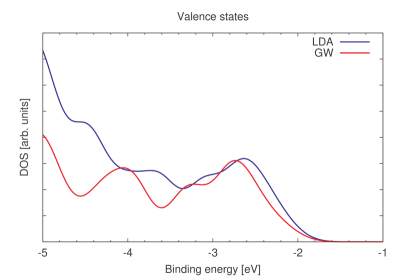
In the left panel of Fig. 2 we show the photoemission profiles of Picene, which we compare with theoretical densities of states (DOS), calculated within the accurate GW approximation of many-body perturbation theory. The structures closest to the chemical potential (binding energy = 0 eV) arise from the -derived highest occupied molecular orbital (HOMO) of the Picene followed by deeper lying electronic states (HOMO-1, HOMO-2 etc.). Upon solid formation, these orbitals form bands with a relatively small band width of about 0.5 eV (see [9] Fig. 1) since the interaction between the molecules in solid Picene is essentially van-der-Waals. Our calculations based on density-functional theory using the local density approximation (LDA) follow the results of Ref. [14], but there is a major modification of the shape of the DOS once many-body correlation effects embedded in the approximation are considered. Quasiparticle corrections change the positions and the intensities of the main peaks (see the detailed comparison in [9] Fig. 2). The final result is in excellent agreement with the measured PES data. Below about 6 - 7 eV binding energy (BE) we find that the -derived states additionally contribute to the photoemission spectrum. The spectral sharpness of the photoemission structures confirms that upon solid formation the molecular electronic states of Picene remain relatively unchanged. Closest to the chemical potential, the photoemission data reveal three maxima in the electronic density of states at 2.7 eV, 3.35 eV and 4.15 eV, corresponding to the highest 8 valence bands (see [9] Fig. 1).
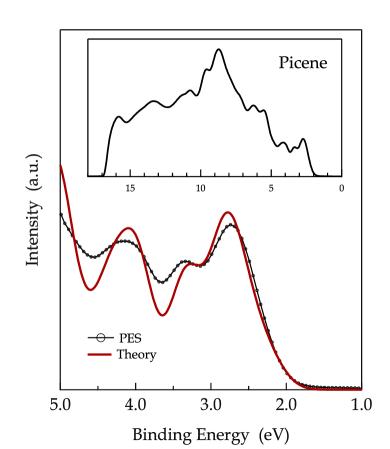
This observation demonstrates that the first occupied electronic levels of Picene are quite close in energy. The onset of the occupied electronic DOS is at about 2 eV below the chemical potential (or Fermi energy), which indicates a quite large band gap of solid Picene. The ionization potential of solid Picene as determined using the data in Fig. 2 is 6.4 eV, i.e. Picene is rather stable against oxidation. The work function of Picene thus is 4.4 eV.
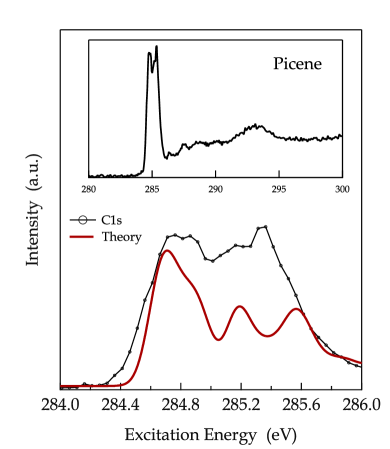
In the right-hand panel of Fig. 2 the C1s core excitation spectra of Picene are depicted. Due to dipole selection rules, these data represent transitions into empty C2p derived levels. In other words core level EELS is able to probe the projected unoccupied electronic DOS of carbon based materials.[4, 15] We thus compare the experimental EELS with the unoccupied DOS calculated in the GW approximation. Analogously to other electronic systems, the features below 291 eV are caused by excitations into -derived electronic states. The step-like structure at about 291 eV corresponds to the onset of transitions into -derived unoccupied levels. The C1s core excitation spectrum of Picene shows a very sharp and dominating excitation feature right after the excitation onset at 284.3 eV, due to excitonic interactions with the core hole.[15, 16, 17] This excitation feature is characterized by a fine structure with maxima at 284.75 eV, 284.85 eV, 285.15 eV and 285.35 eV. These peaks are in very good correspondence with the theoretical data once corrections are taken into account. From this analysis we can unambigously assign those structures to several unoccupied levels that are very close in energy (in the first 0.6 eV we count 4 bands and 8 in the first 1.5 eV - see [9] Fig. 1). Compared to pentacene (also formed by five benzene rings, joined in a zigzag manner, instead than armchair-like as in picene), these bands show an even smaller dispersion.[18] When doped with electrons, these states become occupied, and this quasi-degeneracy has been proposed to cause a high DOS at the Fermi level in superconducting K3Picene, a situation that resembles that in fullerides and would be favorable for a relatively high transition temperature into the superconducting state. Moreover, this quasi-degeneracy of the conduction bands is also helpful to reduce the impact of electron correlation effects, i.e. to realize a metalic ground state similar to K3C60 [1], which is a necessary pre-requisite for superconductivity.
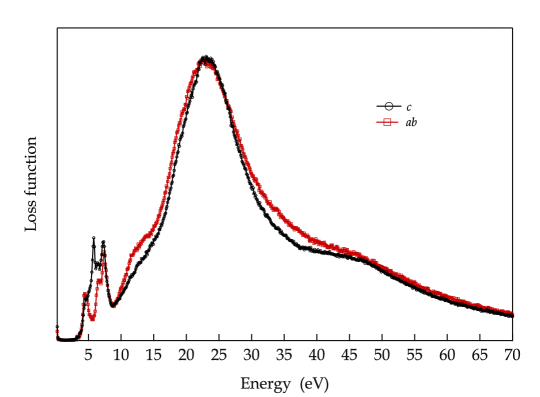
Finally, we present in Fig. 3 the loss function of solid Picene, which provides insight into the electronic excitations of this compound. The experimental data as presented in Fig. 3 are taken with a small momentum transfer of 0.1 Å-1, which represents the so-called optical limit.[10] Taking into account the anisotropic molecular and crystal structure of Picene, it is reasonable to expect an anisotropic loss function as well. The theoretical results for the loss function, calculated in RPA, match very well the experimental measurements and provide fundamental insight to interpret the spectra.
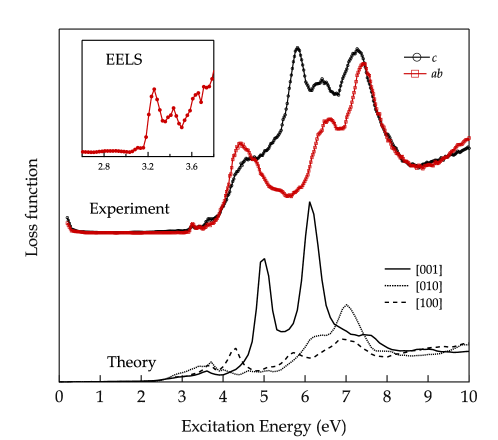
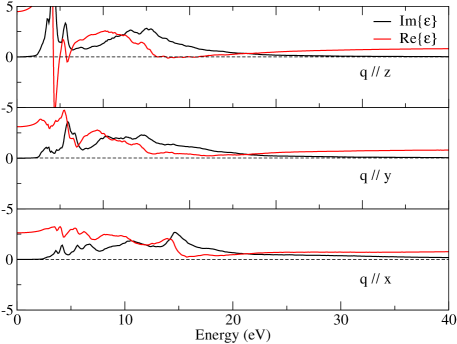
For a momentum transfer parallel to the axis the loss function of Picene is dominated by a broad structure at about 23 eV, which is attributed to the volume plasmon, a collective excitation of all valence electrons ( plasmon) (see [9] Fig. 5). The well-structured loss function below 10 eV with clear maxima at about 4.6 eV, 5.8 eV, 6.4 eV, and 7.3 eV in the experimental spectra is a signature of the energetically sharp and well-defined molecular electronic levels of Picene, which remain relatively unchanged going to the solid state. The fact that the observed maxima with high intensity are close in energy is also in good agreement to the well structured data shown in Fig. 2 for the electronic DOS, and we ascribe the excitation maxima in Fig. 3 to excitations between the energetically close lying first occupied and unoccupied electronic states of Picene. With respect to the experimental spectra, the theoretical results show a slight underestimation of the peak positions due to the fact that the band gap opening due to GW corrections and excitonic effects - both absent in the present calculations - do not exactly compensate each other. From the analysis of the theoretical spectra we find that in the spectrum with parallel to the axis the first main structure at about 5 eV is located in the continuum of single particle excitations and is due to interband transitions (seen as peaks in the imaginary part of , see [9] Fig. 3). Instead, the second peak at about 6.1 eV occurs in correspondence to a zero of the real part of , where also the imaginary part is small. Therefore this structure can be assigned to a plasmon, related to collective excitations with character.
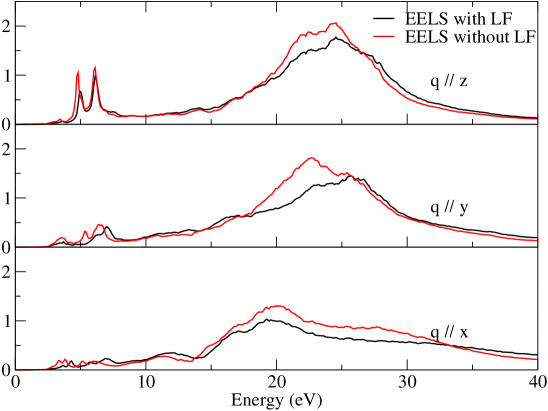
Comparing the EELS spectra with momentum transfer along the three directions, we note that moving from the axis towards the axis, the and plasmons undergo a blue shift and a red shift respectively. This can be understood in terms of the one-particle excitations that originate them, as in layered systems like graphite and graphene.[19, 20] In fact, for directed along the axis (which is nearly parallel to the molecular main axis) and transitions have very small oscillator strength. Therefore the main contributions in the low energy and high energy regions of the spectra are given by and transitions respectively. On the other hand, when is directed along the other directions, and transitions at intermediate frequencies increase considerably their oscillator strength. As a consequence, the main structures of the loss function in the low-energy (the plasmon) and high-energy regions (the plasmon) undergo a blue and a red shift respectively. The anisotropic character of the loss function is clearly visible also when we analyse the effect of crystal local-fields (LFE) on the spectra. LFE are directly related to inhomogeneities in the induced charges (hence in the induced Hartree potential). And, in fact, we find that LFE are almost negligible for parallel to the axis, i.e. along the main molecular axis, where the charge distribution is quite homogeneous, but they are stronger in the other directions as a manifestiation of the inherent anysotroy of the molecular solid (see [9] Fig. 4).
Zooming into the energy region around the excitation onset reveals an excitation onset in the experimental spectra, i.e. an optical gap, of 3.15 eV. This onset also represents a lower limit for the band gap (or transport energy gap) of solid Picene. While the fundamental band gap is severely underestimated by the 2.39 eV LDA result (see also Ref. [14]), the GW band structure displays a direct quasiparticle gap of 4.08 eV (at the Z point of the Brillouin zone). The GW result also implies that in Picene we should expect an exciton binding energy larger than in the close relative pentacene, where it is less than 0.5 eV [18, 21, 22, 23], and where also a smaller band gap (2.3 eV) has been reported.[18, 23, 24] The excitation onset of Picene is followed by three rather weak electronic excitations at about 3.25 eV, 3.4 eV, and 3.65 eV. Following previous optical studies of Picene molecules in solution [25], we attribute these low lying (singlet) excitations to those that are polarized perpendicular to the long molecular axis, while at higher energies excitations polarized along this axis contribut. Again, there is a further clear difference to the electronic excitation spectrum of pentacene, where the electronic excitation across the energy gap has substantially more relative spectral weight.[26]
4 Summary
In conclusion, we have studied the electronic properties of Picene using a combination of accurate experimental and theoretical spectroscopies. Our results from photoemission and electron energy-loss spectroscopy have been analysed to clarify the effects of electronic correlation and anisotropy in the dielectric response in order to understand its peculiar properties. With respect to Pentacene, Picene shows a larger quasiparticle gap, a larger exciton binding energy, and a higher density of unoccupied states close to the Fermi energy.
References
References
- [1] O. Gunnarsson 2004 Alkali Doped Fullerides, (World Scientific, Singapore)
- [2] J.H. Weaver and D.M. Poirier 1994 Solid State Physics 48 (Academic, New York)
- [3] L. Forro and L. Mihaly 2001 Rep. Prog. Phys. 64, 649
- [4] M. Knupfer 2001 Surface Science Reports 42, 1
- [5] M.F. Craciun et al. 2006 Adv. Mater. 18, 320
- [6] R. Mitsuhashi et al. 2010 Nature 464, 76
- [7] A. De et al. 1985 Acta Crystallogr. C 41, 907
- [8] H. Peisert et al. 2003 J. Appl. Phys. 93, 9683
- [9] See Supplementary information for additional figures
- [10] J. Fink 1989 Adv. Electron. Electron Phys. 75, 121
- [11] M. Knupfer et al. 2000 Chem. Phys. Lett. 318, 585
- [12] G. Onida et al. 2002 Rev. Mod. Phys. 74, 601
- [13] L. Hedin 1965 Phys. Rev. 139, A796
- [14] T. Kosugi et al. 2009 J. Phys. Soc. Japan 78, 113704
- [15] M. Knupfer et al. 1999 Carbon 37, 733
- [16] E. L. Shirley 1998 Phys. Rev. Lett. 80, 794
- [17] J.A. Soininen et al. 2005 Phys. Rev. B 72, 045136
- [18] M.L. Tiago et al. 2003 Phys. Rev. B 67, 115212
- [19] A.G. Marinopoulos et al. 2002 Phys. Rev. Lett. 89, 076402
- [20] A.G. Marinopoulos et al. 2004 Phys. Rev. B 69, 245419
- [21] I.G. Hill et al. 2000 Chem. Phys. Lett. 327, 181
- [22] D.R.T. Zahn et al. 2006 Chem. Phys. 325, 99
- [23] K. Hummer and C. Ambrosch-Draxl 2005 Phys. Rev. B 71, 081202(R)
- [24] F. Amy et al. 2005 Org. Electron. 6, 85
- [25] J.B. Gallivan and J.S. Brinen 1969 J. Chem. Phys. 50, 1590
- [26] R. Schuster et al. 2007 Phys. Rev. Lett. 98, 037402
- [27] P. Giannozzi et al. 2009 J. Phys. Condens. Matt. 21, 395502
- [28] X. Gonze et al. 2005 Z. Kristallogr. 220, 558
- [29] A. Marini et al. 2009 Comp. Phys. Commun. 180, 1392
Supplementary information