A Chandra Perspective on Galaxy-Wide X-ray Binary Emission and its Correlation with Star Formation Rate and Stellar Mass: New Results from Luminous Infrared Galaxies.
Abstract
We present new Chandra observations that complete a sample of seventeen (17) luminous infrared galaxies (LIRGs) with Mpc and low Galactic column densities of cm-2. The LIRGs in our sample have total infrared (8–1000m) luminosities in the range of (1–8) . The high-resolution imaging and X-ray spectral information from our Chandra observations allow us to measure separately X-ray contributions from active galactic nuclei (AGNs) and normal galaxy processes (e.g., X-ray binaries and hot gas). We utilized total infrared plus UV luminosities to estimate star-formation rates (SFRs) and -band luminosities and optical colors to estimate stellar masses () for the sample. Under the assumption that the galaxy-wide 2–10 keV luminosity () traces the combined emission from high mass X-ray binaries (HMXBs) and low mass X-ray binaries (LMXBs), and that the power output from these components are linearly correlated with SFR and , respectively, we constrain the relation . To achieve this, we construct a Chandra-based data set composed of our new LIRG sample combined with additional samples of less actively star-forming normal galaxies and more powerful LIRGs and ultraluminous infrared galaxies (ULIRGs) from the literature. Using these data, we measure best-fit values of ergs s-1 and ergs s-1 ( yr-1)-1. This scaling provides a more physically meaningful estimate of , with 0.1–0.2 dex less scatter, than a direct linear scaling with SFR. Our results suggest that HMXBs dominate the galaxy-wide X-ray emission for galaxies with SFR/ yr-1, a factor of 2.9 times lower than previous estimates. We find that several of the most powerful LIRGs and ULIRGs, with SFR/ yr-1, appear to be X-ray underluminous with respect to our best-fit relation. We argue that these galaxies are likely to contain X-ray binaries residing in compact star-forming regions that are buried under thick galactic columns large enough to attenuate emission in the 2–10 keV band ( cm-2).
Subject headings:
galaxies: starburst — infrared: galaxies — X-rays: binaries — X-rays: galaxies — cosmology: observations1. Introduction
The most energetic nearby star-forming galaxies are luminous infrared galaxies (LIRGs), which are classified as having total infrared (8–1000m) luminosities greater than (where ergs s-1 is the bolometric luminosity of the Sun). The total infrared emission from most LIRGs comprises 50–90% of their galactic bolometric power output and is thought to arise primarily from dust reprocessing of obscured UV light that originates from underlying star-forming regions (see Sanders & Mirabel 1996 for a review). Therefore, the total LIRG infrared power provides an effective measure of the galactic star-formation rate (SFR; e.g., Kennicutt 1998) and has been used extensively to select galaxies with active star-formation (e.g., Sanders et al. 2003).
| -Band Source Characteristics | |||||||||||||
| PA | SFR | Optical | Optical | Class | |||||||||
| Source Name | (hrs) | (deg) | (arcmin) | (arcmin) | (deg) | (Mpc) | ( cm-2) | () | (/yr) | () | Morphology | Class | Reference |
| (1) | (2) | (3) | (4) | (5) | (6) | (7) | (8) | (9) | (10) | (11) | (12) | (13) | (14) |
| NGC 1068…… | 02 42 41 | 00 00 48 | 2.42 | 1.99 | 35 | 13.75 | 4.06 | 11.27 | 18.50 | 11.02 | (R)SA(rs)b | Sy 2 | 1,2,3,4,5 |
| NGC 1365 | 03 33 36 | 36 08 25 | 4.60 | 3.45 | 50 | 18.03 | 1.36 | 11.00 | 9.97 | 11.01 | SB(s)b | Sy 1 | 1 |
| NGC 7552 | 23 16 11 | 42 35 05 | 2.21 | 1.30 | 95 | 21.55 | 1.95 | 11.03 | 10.67 | 10.70 | (R’)SB(s)ab | H II | 1,4,5 |
| NGC 4418 | 12 26 55 | 00 52 39 | 0.83 | 0.45 | 55 | 32.12 | 2.04 | 11.08 | 11.79 | 10.04 | (R’)SAB(s)a | LINER/Sy 2 | 5,6,7 |
| NGC 4194 | 12 14 09 | +54 31 37 | 0.64 | 0.44 | 170 | 40.67 | 1.56 | 11.06 | 11.26 | 10.40 | IBm pec | H II | 2 |
| IC 5179 | 22 16 09 | 36 50 37 | 1.48 | 0.56 | 55 | 47.23 | 1.16 | 11.16 | 14.51 | 10.93 | SA(rs)bc | H II | 2,5 |
| ESO 420G013 | 04 13 50 | 32 00 25 | 0.61 | 0.58 | 110 | 48.17 | 2.28 | 11.02 | 10.27 | 10.62 | SA0+(r) pec? | H II | 4,5 |
| Arp 299 | 11 28 30 | +58 34 10 | 1.42 | 1.25 | 28 | 48.24 | 1.05 | 11.88 | 75.60 | 11.05 | Merger (S pec) | H II + Sy 2 | 6,8,9 |
| NGC 838 | 02 09 39 | 10 08 46 | 0.62 | 0.43 | 95 | 50.78 | 2.23 | 11.00 | 9.81 | 10.53 | SA00(rs) pec? | H II | 10 |
| NGC 5135 | 13 25 44 | 29 50 01 | 1.75 | 0.86 | 125 | 52.87 | 4.35 | 11.17 | 14.72 | 10.97 | SB(s)ab | Sy 2 | 4,5 |
| NGC 5394/5 | 13 58 38 | +37 25 28 | 1.53 | 0.80 | 5 | 54.02 | 1.05 | 11.00 | 9.90 | 11.09 | SA(s)b pec | Sy 2 | 3 |
| NGC 5653 | 14 30 10 | +31 12 56 | 0.76 | 0.70 | 75 | 55.53 | 1.20 | 11.06 | 11.51 | 10.87 | (R’)SA(rs)b | H II | 2,5 |
| NGC 7771 | 23 51 25 | +20 06 43 | 1.52 | 0.62 | 75 | 57.94 | 4.27 | 11.34 | 21.95 | 11.25 | SB(s)a | H II | 2,5 |
| NGC 3221 | 10 22 20a | +21 34 11a | 1.62a | 0.34a | 167a | 59.46 | 1.86 | 11.00 | 9.92 | 11.00 | SB(s)cd? edge-on | H II | … |
| CGCG 049057 | 15 13 13 | +07 13 32 | 0.45 | 0.23 | 20 | 59.83 | 2.79 | 11.27 | 18.25 | 10.15 | … | H II | 2,7,5 |
| IC 860 | 13 15 03 | +24 37 08 | 0.56 | 0.32 | 20 | 59.88 | 1.12 | 11.17 | 14.51 | 10.36 | S? | LINER/Sy2 | 2,7,5 |
| NGC 23 | 00 09 53 | +25 55 26 | 1.13 | 0.54 | 155 | 60.52 | 3.86 | 11.05 | 11.20 | 11.08 | SB(s)a | H II | 2,5 |
NOTE.—Basic properties of our complete sample of 17 LIRGs with Mpc and cm-2, ordered by distance (given in Col. [7]). Col.(1): Common source name. Col.(2) and (3): Right ascension and declination, respectively. Units of right ascension are hours, minutes, and seconds, and units of declination are degrees, arcminutes, and arcseconds. Col.(4): Semi-major axis in arcminutes. Col.(5): Semi-minor axis in arcminutes. Col.(6): Position angle in degrees, measured east from north. Values given in Col.(2)–(6) were provided by 2MASS with the exception of NGC 3221, which was given by RC3. Col.(7): Luminosity distance in Mpc, as used by Sanders et al. (2003). Col.(8): Galactic column density in units of cm-2 as given by Dickey & Lockman (1990). Col.(9): Logarithm of the total infrared (8–1000 m) luminosity as given by Sanders et al. (2003). Col.(10): Star-formation rate in units of yr-1. Col.(11): Logarithm of the stellar mass in units of . Col.(10) and (11) were computed following the methods presented in 2.2. Col.(12): Optical morphological classification. When available, these classifications are primarily based on RC3, with the exception of Arp 299, which was based on the Revised Shapley-Ames Catalog Of Bright Galaxies (Sandage & Tammann 1981). Col.(13): Optical spectroscopic classification of source type. Col.(14): Literature reference for column (13); 1 = Veron-Cetty & Veron (1986), 2 = Veilleux et al. (1995), 3 = Ho et al. (1997), 4 = Kewley et al. (2001), 5 = Yuan et al. (2010), 6 = Armus et al. (1989), 7 = Baan et al. (1998), 8 = Coziol et al. (1998), 9 = García-Marín et al. (2006) and 10 = Keel et al. (1985).
a Values taken from RC3.
In normal star-forming galaxies (i.e., those that are not dominated by luminous active galactic nuclei [AGNs]), X-ray emission originates from X-ray binaries, supernovae, supernova remnants, hot (0.2–1 keV) interstellar gas, and O-stars (see, e.g., Fabbiano 1989, 2006 for reviews). Several investigations have now revealed the presence of a strong correlation between the galaxy-wide X-ray emission and total SFR (hereafter, the X-ray/SFR correlation; see, e.g., Bauer et al. 2002; Grimm et al. 2003; Ranalli et al. 2003; Gilfanov et al. 2004a,b; Persic et al. 2004; Persic & Rephaeli 2007; Lehmer et al. 2008). The X-ray/SFR correlation is thought to be driven primarily by X-ray binary emission, and at high X-ray energies (2–10 keV), where the emission intensity from hot interstellar gas and young stars decreases sharply, X-ray binaries significantly dominate the galaxy-wide X-ray power and therefore correlate strongly with SFR (e.g., Persic & Rephaeli 2002).
Detailed Chandra studies of nearby star-forming late-type galaxies and passive early-type galaxies have shown that the X-ray point source emission from relatively young (100 Myr) high-mass X-ray binaries (HMXBs) and older (1 Gyr) low-mass X-ray binaries (LMXBs) correlate well with galaxy SFR and stellar mass (), respectively (e.g., Grimm et al. 2003; Colbert et al. 2004; Gilfanov 2004). Colbert et al. (2004; hereafter C04) utilized Chandra-resolved point source populations in 32 nearby spiral and elliptical galaxies to measure the galaxy-wide X-ray power due to point sources and characterize its correlation with both SFR and . The C04 study, which focused on representative nearby galaxies with SFR 0.01–10 yr-1 and –, showed that is linearly correlated with both SFR and and the relative contributions from HMXBs and LMXBs are directly dependent on specific-SFR (i.e., SFR/; a measure of the stellar-growth rate). From this perspective, the more commonly used X-ray/SFR correlation is likely to have significant scatter due to variations in for a given SFR.
A recent study by Persic & Rephaeli (2007; hereafter, PR07) noted that ultraluminous infrared galaxies (ULIRGs), which have SFR 100 yr-1, have 2–10 keV luminosity-to-SFR ratios that are 5 times lower than more typical nearby galaxies that have SFR 100 yr-1. PR07 suggest that the 2–10 keV emission in ULIRGs is likely to be dominated by HMXBs with negligible contributions from LMXBs, which likely play a more significant role in galaxies with SFR 100 yr-1. This trend has also been substantiated by recent Chandra observations of powerful LIRGs and ULIRGs from the Great Observatories All-sky LIRG Survey (GOALS; Iwasawa et al. 2009; hereafter, Iw09). Despite the improved understanding of how the galaxy-wide 2–10 keV emission depends on SFR and from C04 and suggestions that extremely powerful LIRGs and ULIRGs have X-ray power dominated by young HMXB populations (from e.g., PR07 and Iw09), researchers have yet to test directly and constrain the C04 relation using observations of galaxies with SFR yr-1.
In this paper, we present new Chandra results for a volume-limited sample ( Mpc) of 17 LIRGs (including 10 new LIRGs from this study; see Tables 1 and 2) with Galactic column densities cm-2 and 1–8 (SFR yr-1; see Figs. 1 and 2). We first utilize the high-resolution Chandra data to separate spatially and measure contributions from normal galaxy-wide X-ray emission (i.e., not due to an AGN) and AGN when present; this enables us both to investigate the X-ray/SFR correlation in detail for LIRGs and to characterize the AGN activity in the population. Using the new LIRG constraints in combination with both the Chandra results from C04 for less actively star-forming normal galaxies and Iw09 for more actively star-forming LIRGs and ULIRGs, we provide improved constraints upon how the normal-galaxy 2–10 keV luminosity depends on SFR and , and therefore the relative contributions from HMXBs and LMXBs. This analysis has the advantage over previous studies in that it uniquely covers 4 orders of magnitude in SFR and 3.5 orders of magnitude in and is uniformly based on Chandra data.
Throughout this paper, we make estimates of SFR and using a Kroupa (2001) initial mass function (IMF); when making comparisons between these estimates and those quoted in other studies, we have adjusted all values to correspond to our adopted IMF. We sometimes make comparisons with the Milky Way (MW). We adopt values of (Hammer et al. 2007), SFR yr-1 (McKee & Williams 1997), and 2–10 keV luminosity ergs s-1 (Grimm et al. 2002) for the MW = 70 km s-1 Mpc-1, = 0.3, and = 0.7 are adopted throughout this paper (e.g., Spergel et al. 2003).
2. Sample
2.1. LIRG Sample Selection
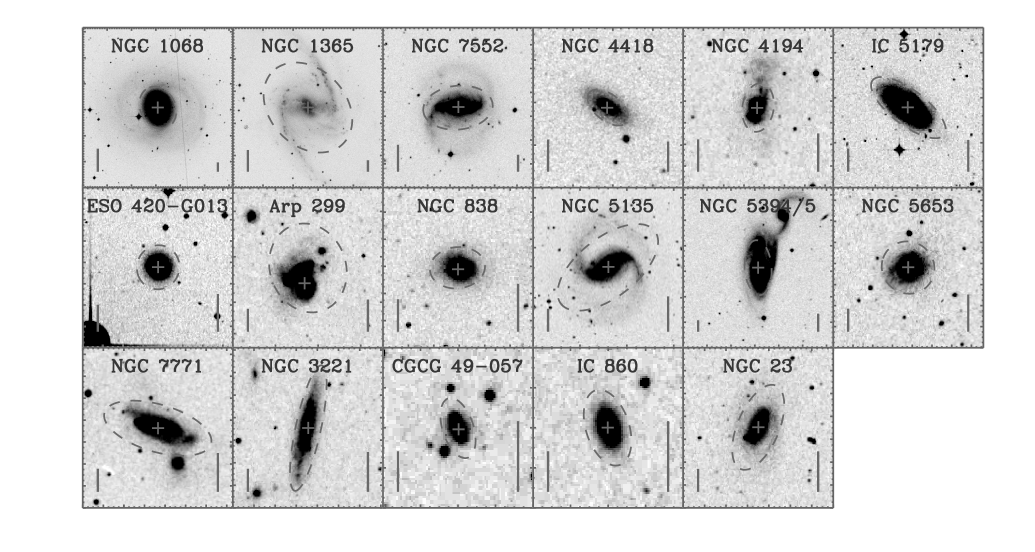
Using the IRAS Revised Bright Galaxies Sample (RBGS; Sanders et al. 2003), we constructed a sample of nearby LIRGs that were at distances less than 60 Mpc and had Galactic column densities cm-2 (Dickey & Lockman 1990). The former requirement results in Chandra imaging resolution of 150 pc in the region of the nucleus, which allows for reasonable distinction between nuclear AGNs and starburst regions (see, e.g., Levenson et al. 2004 for an analysis of the AGN plus starburst nucleus of NGC 5135 in our sample). The latter requirement results in moderate-to-good Galactic transparency to soft X-ray emission, which is valuable for detecting and modeling the emission from hot 0.5–1 keV gas that is often found in star-forming galaxies. In total, 36 RBGS LIRGs reside at Mpc and 17 satisfy our Galactic column density criterion. In Table 1, we provide the basic properties of our LIRG sample, and in Figure 1, we show Digitized Sky Survey (DSS) red images of the galaxies in our sample. In contrast to ULIRGs, which are nearly all late-type galaxies with evidence for mergers/interactions (e.g., Melnick & Mirabel 1990; Sanders et al. 1988; Chen et al. 2010), the LIRGs that make up our sample consist of a variety of optical morphological types (e.g., spirals, barred spirals, S0s) with only a small fraction (10%) showing evidence for mergers/interactions.
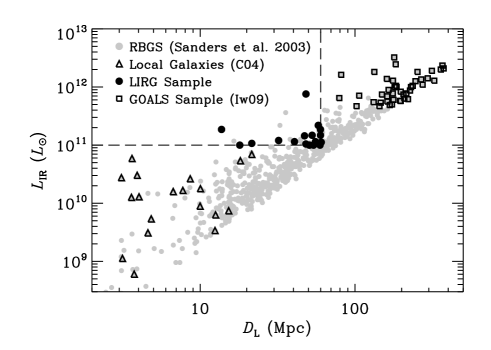
In Figure 2, we show the infrared luminosity versus distance for the RBGS and highlight our sample (filled black circles). Of the 17 LIRGs in our sample, seven (NGC 1068, NGC 1365, NGC 7552, NGC 4418, NGC 4194, Arp 299, and NGC 5135) had Chandra archival data. Detailed Chandra analyses for these sources can be found in the literature for NGC 1068 (Young et al. 2001; Smith & Wilson 2001), NGC 1365 (Risaliti et al. 2009a,b; Soria et al. 2009; Strateva & Komossa 2009; Wang et al. 2009), NGC 4194 (Kaaret & Alonso-Herrero 2008), Arp 299 (Zezas et al. 2003), and NGC 5135 (Levenson et al. 2004). To enable new Chandra constraints on the LIRG population in general, we proposed successfully in Chandra Cycle 10 (PI: D. M. Alexander) to observe the remaining 10 LIRGs. Our Chandra program (and consequently adopted exposure times; see Table 2) was designed to allow for the detection of ultraluminous X-ray sources (ULXs) down to a 0.5–8 keV limit of ergs s-1 for the 17 LIRGs. In a forthcoming paper (Jackson et al. in-prep), we will present the X-ray and statistical properties of the ULX populations detected in the LIRG sample.
As is evident from Figure 2, our sample provides a useful complement to the distribution of Chandra-observed galaxies between less active nearby galaxies (e.g., from C04) and more powerful LIRGs and ULIRGs (e.g., from the GOALS; Iw09). We note that the RBGS sources with Chandra observations highlighted in Figure 2 do not constitute a complete census of the Chandra archive. However, incompleteness is only most severe for galaxies with , which are not the primary focus of this analysis; detailed Chandra and multiwavelength studies of such galaxies will be the subject of forthcoming work by the Spitzer Infrared Nearby Galaxies Survey (SINGS) collaboration (Jenkins et al. in-prep; Ptak et al. in-prep; see Kennicutt et al. 2003 for survey details). For LIRGs and ULIRGs, the Chandra observations highlighted in Figure 2 are nearly complete.
2.2. Stellar Mass and Star Formation Rate Estimates
We estimated stellar masses for the LIRGs in our sample following the prescription outlined in Appendix 2 of Bell et al. (2003), which provides galaxy mass-to-light ratios in several optical/near-IR bands as a function of optical/near-IR color. We utilized colors from the NASA/IPAC Extragalactic Database (NED), which were primarily from the Third Reference Catalog of Bright Galaxies (RC3; de Vaucouleurs et al. 1991). -band luminosities were computed using data from the Two Micron All Sky Survey (2MASS) large galaxy atlas (Jarrett et al. 2003) and -band extended source catalogs.111The 2MASS extended source catalog is available online via http://tdc-www.harvard.edu/catalogs/tmxsc.html. We note that for NGC 3221, no 2MASS counterpart was available, and we therefore adopted the estimate provided by the GOALS team (Howell et al. 2010; hereafter, H10), adjusted to match our adopted distance and IMF (see below). For the 16 LIRGs having 2MASS counterparts, we computed stellar masses using the following equation:
| (1) |
The numerical constants in equation 1 were supplied by Table 7 of Bell et al. (2003) and are appropriate for our choice of color and ; the normalization has been adjusted by 0.15 dex to account for our adopted Kroupa (2001) IMF. Uncertainties at the 0.1 dex level are expected due to variations in stellar ages, dust attenuation, and bursts of star formation (see Bell et al. 2003 for further details).
| Obs. Start | Exposure Timea | Subarray?c | |||||
|---|---|---|---|---|---|---|---|
| Source Name | Obs. ID | (UT) | (ks) | Obs. Modeb | Camera | (Y/N) | Pipeline Versiond |
| NGC 1068…………………… | 344 | 2000 Feb 21, 15:48 | 46.9 | F | ACIS-S | N | 7.6.11.2 |
| 370 | 2000 Feb 22, 05:51 | 3.7 | VF | ACIS-S | Y | 7.6.11.1 | |
| NGC 1365…… | 3554 | 2002 Dec 24, 14:57 | 13.6 | F | ACIS-S | N | 7.6.9 |
| 6868e | 2006 Apr 17, 19:05 | 14.6 | F | ACIS-S | Y | 7.6.7.1 | |
| 6869e | 2006 Apr 20, 10:00 | 15.5 | F | ACIS-S | Y | 7.6.7.1 | |
| 6870e | 2006 Apr 23, 10:05 | 14.4 | F | ACIS-S | Y | 7.6.7.2 | |
| 6871e | 2006 Apr 10, 07:02 | 13.2 | F | ACIS-S | Y | 7.6.7.1 | |
| 6872e | 2006 Apr 12, 12:31 | 14.6 | F | ACIS-S | Y | 7.6.7.1 | |
| 6873e | 2006 Apr 14, 23:26 | 14.6 | F | ACIS-S | Y | 7.6.7.1 | |
| NGC 7552…… | 7848 | 2007 Mar 31, 05:48 | 5.1 | F | ACIS-S | N | 7.6.11 |
| NGC 4418…… | 4060 | 2003 Mar 10, 00:58 | 19.8 | F | ACIS-S | Y | 7.6.8 |
| 10391 | 2009 Feb 20, 20:34 | 5.7 | VF | ACIS-S | Y | 7.6.11.10 | |
| NGC 4194…… | 7071 | 2006 Sep 09, 23:30 | 35.0 | F | ACIS-S | N | 7.6.8.1 |
| IC 5179…… | 10392 | 2009 Jun 21, 13:51 | 12.0 | VF | ACIS-S | Y | 7.6.11.10 |
| ESO 420G013…… | 10393 | 2009 May 13, 05:46 | 12.4 | VF | ACIS-S | Y | 7.6.11.10 |
| Arp 299…… | 1641 | 2001 Jul 13, 11:07 | 24.3 | F | ACIS-I | Y | 7.6.9 |
| NGC 838…… | 10394 | 2008 Nov 23, 09:03 | 13.8 | VF | ACIS-S | Y | 7.6.11.9 |
| NGC 5135…… | 2187 | 2001 Sep 04, 15:23 | 26.4 | F | ACIS-S | Y | 7.6.9 |
| NGC 5394/5…… | 10395 | 2009 Mar 18, 23:28 | 15.7 | VF | ACIS-S | Y | 7.6.11.10 |
| NGC 5653…… | 10396 | 2009 Apr 11, 05:46 | 16.5 | VF | ACIS-S | Y | 7.6.11.10 |
| NGC 7771…… | 10397 | 2009 May 22, 05:12 | 16.7 | VF | ACIS-S | Y | 7.6.11.10 |
| NGC 3221…… | 10398 | 2009 Mar 19, 04:19 | 19.0 | VF | ACIS-S | Y | 7.6.11.10 |
| CGCG 049057…… | 10399 | 2009 Apr 17, 05:43 | 19.1 | VF | ACIS-S | Y | 7.6.11.10 |
| IC 860…… | 10400 | 2009 Mar 24, 02:38 | 19.1 | VF | ACIS-S | Y | 7.6.11.10 |
| NGC 23…… | 10401 | 2008 Oct 27, 06:22 | 19.4 | VF | ACIS-S | Y | 7.6.11.9 |
NOTE.—Links to the data sets in this table have been provided in the electronic edition.
a All observations were continuous. These times have been corrected for removed data that was affected by high background; see 3.
b The observing mode (F=Faint mode; VF=Very Faint mode).
c States whether a subarray was used in the observation.
d The version of the CXC pipeline software used for basic processing of the data.
e Observation covers only a small fraction of the galactic extent and was therefore not used in the analyses presented in this paper.
We note that 12 of the LIRGs in our sample (including 11 LIRGs with stellar mass estimates from equation 1) have been studied extensively from the far-UV to IR (including observations with both GALEX and Spitzer) by the GOALS collaboration and have stellar mass estimates available (e.g., Armus et al. 2009; H10). After accounting for known differences in adopted distances and IMF, we find that our stellar mass estimates are in good agreement with those of H10, with our values being larger by 4% (median value) with a 1 scatter of 0.09 dex.
By selection, our LIRG sample consists of galaxies radiating powerfully over the far-IR (8–1000 m) wavelength range. The far-IR light is expected to be produced by dust-reprocessed emission from underlying UV-obscured star-formation activity and can therefore be used as a direct measurement of the SFR. Using the 8–1000 m total infrared luminosities provided by Sanders et al. (2003) and the methods described in 3.2 of Bell et al. (2005), we estimated the total galaxy SFR using the following equation:
| (2) |
where is expressed in units of solar bolometric luminosity ( ergs s-1) and the factor 1.000–1.024 provides small corrections that account for UV emission emerging from unobscured star-forming regions. Equation 2 is a direct variant of equation 1 presented by Bell et al. (2005) and was derived from PÉGASE stellar-population models, which assumed a 100 Myr old population with constant SFR and a Kroupa (2001) IMF. This calibration uses identical assumptions to the SFR calibrations provided by Kennicutt (1998). For the 12 LIRGs that overlap with the H10 sample, was provided by H10 using values of the total infrared flux from IRAS () and the far-UV flux () from GALEX: . For these 12 LIRGs, we find good agreement between SFR measurements, with our SFR values being larger by 4% (median offset) with small scatter (0.003 dex; 1). For the five LIRGs in our sample without H10 counterparts, we adopted , the median value of for the 12 LIRGs with H10 counterparts.
In Table 1, we provide the derived stellar masses and SFRs for our LIRGs. The sample spans (1.3–16) (median value of ) and SFR 9.8–75.6 yr-1 (median value of SFR yr-1). For comparison, the LIRGs/ULIRGs from the Chandra GOALS project (Iw09) span a similar range of stellar masses ( (1.6–27) ; median value of ), but contain more actively star-forming galaxies (SFR 14–215 yr-1; median value of SFR yr-1). The nearby late-type galaxies in the C04 study span the stellar mass range of – (median value of ) and less powerful star-forming galaxies with SFR = 0.03–5.6 yr-1 (median value of SFR = 0.8 yr-1).
| Net Counts | Other | AGN | ||||||||
|---|---|---|---|---|---|---|---|---|---|---|
| Evidence | Dominant? | |||||||||
| Source Name | (0.5–8 keV) | (2–8 keV) | (keV) | (ergs s-1) | for AGN | (Y/N) | ||||
| (1) | (2) | (3) | (4) | (5) | (6) | (7) | (8) | (9) | (10) | (11) |
| NGC 1068……… | 150875 404 | 11215 131 | … | … | … | … | 41.49a | 0.74a | Opt., IR, X-ray | Y |
| NGC 1365 | 4719 127 | 841 90 | 1.88 0.12 | 0.73 0.05 | 1.26 | 84 | 40.65 | 0.88 | Opt., IR, X-ray | Y |
| NGC 7552 | 939 40 | 113 23 | 2.06 0.13 | 0.64 0.04 | 0.91 | 46 | 40.40 | 0.08 | … | N |
| NGC 4418 | 49 23 | 53 | 3.28 0.46 | … | … | … | 39.58 | … | … | N |
| NGC 4194 | 2413 53 | 263 24 | 2.11 0.08 | 0.83 0.02 | 1.23 | 79 | 40.43 | 0.50 | IR | Y |
| IC 5179 | 520 33 | 62 22 | 2.10 0.19 | 0.84 0.06 | 0.62 | 32 | 40.49 | 0.09 | … | N |
| ESO 420G013 | 762 31 | 53 15 | 3.00 0.19 | 0.71 1.61 | 1.09 | 30 | 40.08 | 0.43 | Opt., IR | N |
| Arp 299 | 4456 72 | 836 36 | 1.85 0.06 | 0.80 0.02 | 1.29 | 130 | 41.32 | 0.11 | Opt., IR, X-ray | N |
| NGC 838 | 632 29 | 70 14 | 2.07 0.13 | 0.73 2.84 | 0.83 | 28 | 40.61 | 0.41 | … | N |
| NGC 5135 | 3756 74 | 346 37 | 2.53 0.08 | 0.78 0.55 | 1.35 | 117 | 40.70 | 0.44 | Opt., IR, X-ray | N |
| NGC 5394/5 | 289 38 | 92 30 | 1.69 0.38 | 0.09 0.20 | 0.65 | 37 | 40.49 | 0.27 | Opt. | N |
| NGC 5653 | 389 30 | 50 19 | 2.21 0.26 | 0.68 0.06 | 1.20 | 26 | 40.18 | 0.11 | … | N |
| NGC 7771 | 864 42 | 233 30 | 1.24 0.21 | 0.63 2.39 | 1.03 | 55 | 41.18 | 0.53 | IR, X-ray | Y |
| NGC 3221 | 310 31 | 69 22 | 1.58 0.16 | 0.0c | 0.95 | 26 | 40.66 | 0.40 | … | N |
| CGCG 049057 | 33 13 | 29 | 1.05 0.57 | … | … | … | 40.29 | … | … | N |
| IC 860 | 44 | 35 | 2.0b | … | … | … | 40.19 | … | … | N |
| NGC 23 | 717 38 | 71 | 2.03 0.21 | 0.73 1.12 | 1.18 | 41 | 40.54 | 0.24 | … | N |
NOTE.—Basic X-ray properties and spectral fitting results for the LIRGs in our sample. Col.(1): Source name. Col.(2) and (3): Net source counts in the 0.5–8 keV and 2–8 keV bandpasses, respectively (see 4.1 for details). For sources with 300 FB counts listed in column 2, X-ray spectral fitting was performed over the 0.5–8 keV band. Col.(4) and (5): Best-fit values of and , respectively, for an assumed power-law plus Raymond-Smith thermal plasma model (see 4.1 for details). Col.(6) and (7): Reduced value (/) and the number of degrees of freedom in the fits (), respectively. Col.(8): Integrated 2–10 keV total luminosity, computed using our best-fit models and distances provided in Table 1, column (7). Col.(9): Ratio of 2–8 keV count-rates from the nuclear region of each galaxy and the total galaxy-wide extent. Count-rates were computed following the methods described in 4.1 and 4.2. A source with large nuclear contributions to the total 2–8 keV count-rates harbors either an AGN or a strong nuclear starburst. Col.(10): Notes whether there is evidence for AGN activity via optical spectroscopy (“Opt”; see columns 13 and 14 in Table 1), the mid-infrared spectrum (“IR”), or from X-ray studies in the literature (“X-ray”); see 4.2. Col.(11): Indicates whether the integrated 2–10 keV luminosity (column 8) is dominated by AGN activity. We consider sources that have both (column 9) and additional evidence for AGN activity from column 10 to have the 2–10 keV luminosity dominated by an AGN (“Y”); otherwise, we consider the galaxy to be dominated by X-ray binary emission (“N”).
aValues are inferred using detailed analysis by Young et al. (2001).
bA simple power-law model with was assumed for IC 860.
cBest-fit spectrum did not require the use of a hot gas component.
3. Chandra Observations and Data Reduction
In Table 2, we present the Chandra ACIS observation log for our LIRG sample. Our analyses began with the Chandra X-ray Center (CXC) processed Level 2 events files, which were all processed using pipeline version 7.6.8 or greater. Additional reductions and analysis of the data were performed using the Chandra Interactive Analysis of Observations (CIAO) Version 4.1 tools and custom software. We screened our events files for undesirable grades using the standard ASCA grade set (ASCA grades 0, 2, 3, 4, 6) and excluded from the events lists background flaring events that were 3 times higher than normal. For the observations 344 (NGC 1068), 3554 (NGC 1365), 7071 (NGC 4194) and 2187 (NGC 5135) we removed short flaring events lasting 0.5, 1.0, 0.5, and 3.0 ks, respectively.
Out of the 17 LIRGs in our sample, three galaxies (NGC 1068, 1365, and 4418) have more than one Chandra observation available. However, in the case of NGC 1365, observations 6868, 6869, 6870, 6871, 6872, and 6873 cover only a small fraction of the entire galactic extent as defined in Table 1 and constitute 86.5% of the total ACIS exposure available. In order to avoid galaxy-wide spectral fits (see 4.1 below) that are statistically biased towards these smaller non-representative regions, we therefore chose for this study to make use of only observation 3554, which covers the entire galactic extent and is sufficiently sensitive for our study.
For the remaining two LIRGs with more than one Chandra observation (NGC 1068 and 4418), we corrected the relative astrometry to match the frames with the longest exposures. We first ran wavdetect at a false-positive probability threshold of to create point-source catalogs for each frame. For a given galaxy, we filtered each of our wavdetect catalogs to include only sources that were common to all frames and within 6′ of the Chandra aim-point, where the point-spread function size and resulting positional errors are small. Using these source lists, we registered each aspect solution and events list to the frame with the longest exposure time using the CIAO tools reproject_aspect and reproject_events, respectively. The resulting astrometric reprojections gave nearly negligible linear translations (0.38 pixels), rotations (0.1 deg), and stretches (0.06% of the pixel size). Using the astrometrically-reprojected events lists, we combined the observations using dmmerge to create merged events lists.
Using the events lists, we constructed images of each LIRG in three bands: 0.5–8 keV (full band; FB), 0.5–2 keV (soft band; SB), and 2–8 keV (hard band; HB). For each of the three bands, we constructed corresponding exposure maps following the basic procedure outlined in 3.2 of Hornschemeier et al. (2001); these maps were normalized to the effective exposures of sources located at the aim points. This procedure takes into account the effects of vignetting, gaps between the CCDs, bad column and pixel filtering, the spatially-dependent degredation of the ACIS optical blocking filter, and the reduced area of frames that use subarrays (see Table 2). A photon index of , the slope of the extragalactic cosmic X-ray background in the full band (e.g., Hickox & Markevitch 2006), was assumed in creating the exposure maps.
4. Analyses
4.1. Extraction of Total LIRG X-ray Properties
To measure the total galaxy-wide X-ray emission originating from each of the LIRGs, we began by extracting total galactic counts and effective exposure times from each of the three images and exposure maps using elliptical regions that approximate the galactic stellar extent. Whenever possible, we adopted for these elliptical regions the “total” semi-major/minor axes and position angles provided by the Two Micron All Sky Survey (2MASS) large galaxy atlas (Jarrett et al. 2003) and the -band extended source catalogs; these regions, which were determined using a curve-of-growth analysis (see 4.2 of Jarrett et al. 2003), are shown in Figure 1 (dashed ellipses) and their values are tabulated in Table 1. For NGC 3221, 2MASS values were not available and we therefore adopted the RC3 values for the semi-major/minor axes and position angle for this galaxy. We note that for 14 of the 17 LIRGs in our sample, both 2MASS and RC3 galaxy extent parameters were available. We find that the 2MASS values of major and minor axes are on average larger than those of RC3 by only small factors of 1.13 and 1.08, respectively.
To estimate the background contributions to the total counts for each galaxy, we extracted background counts and exposure times for each of the three images using 3–5 moderate size (20–90 arcsec radius) circular regions that were outside the galactic -band ellipses and did not overlap within 10′′ of the galaxy or any sources detected by wavdetect at a false-positive probability threshold of 10-6.
Using the galaxy and background counts, we estimated the net galaxy-wide LIRG counts for each of the three bands. Since and are computed using the sum of exposure map values over the source and background regions, respectively, the estimated background contribution to the net counts (i.e., ) are corrected for both extraction area and vignetting. We note that while these background estimates will account for emission due to unrelated background X-ray sources (e.g., distant AGNs; see, e.g., Morretti et al. 2003; Bauer et al. 2004; Kim et al. 2007) that fall below our source detection threshold, these estimates do not include contributions from unrelated sources that are detected in the X-ray band that may lie within the extent of the galaxy. Using the best-fit – from Morretti et al. (2003) and the elliptical galaxy areas described in columns (2)–(6) of Table 1, we estimate that unrelated X-ray detected sources are expected to contribute 8% (median 2%) to the total 2–8 keV band count-rate of each LIRG in our sample. Since these contributions are small and subject to large uncertainties, we therefore do not make any additional corrections to the net galaxy count-rates.
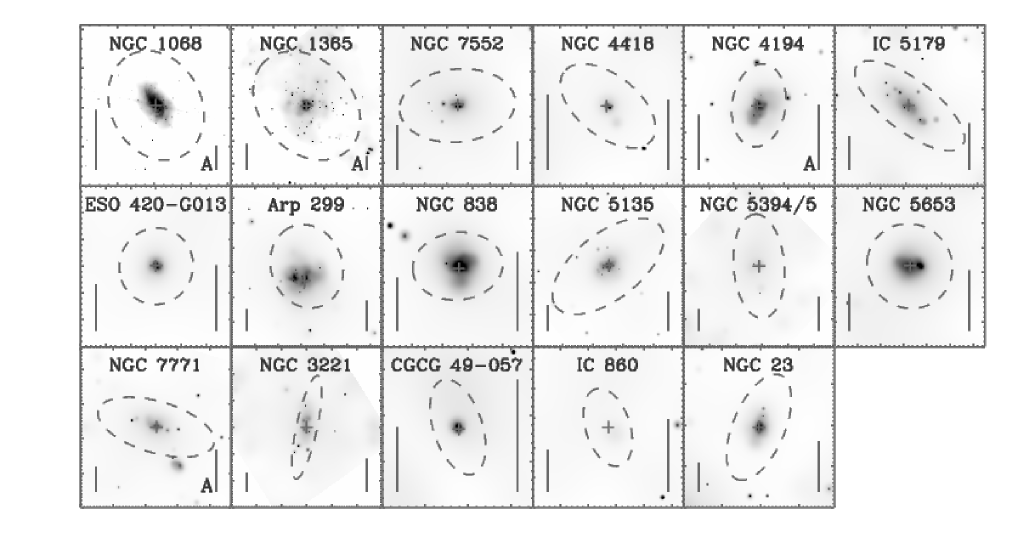
We considered a source to be detected in a given band if the signal-to-noise ratio (S/N = ) was greater than or equal to three. When a source was not detected in a given band, we computed 3 upper limits on its net counts. In columns (2) and (3) of Table 3, we provide the net 0.5–8 keV and 2–8 keV source counts for the 17 LIRGs in our sample, and in Figure 3, we show their 0.5–8 keV adaptively-smoothed images. We note that all galaxies, with the exception of IC 860, are detected in the full band. In the hard band, NGC 4418, CGCG 049057, IC 860, and NGC 23 are undetected. The LIRGs have net full-band source counts in the range of 30– counts; for the 16 sources that were detected in the full band, X-ray spectral fitting was performed.
To model the basic spectral properties of the full-band detected LIRGs in our sample, we utilized the X-ray spectral modelling program xspec Version 12.5.1 (Arnaud 1996). We note that the galaxy-wide and nuclear spectral properties of the LIRG NGC 1068 have been studied extensively in the literature by, e.g., Young et al. (2001); hereafter, we adopt the complex best-fit spectral models and resulting properties provided by Young et al. (2001).
For each observation of the remaining 15 galaxies with full-band detections, we employed the CIAO tool specextract to construct source and background spectra, response matrix files (RMFs), and properly-weighted ancillary response files (ARFs) over the source and background regions described above. For the 13 full-band detected LIRGs that had 300 net counts (excluding NGC 1068), we utilized fitting of the data grouped in bins with a minimum of 20 counts. For these galaxies, we assumed a simple spectral model consisting of Galactic absorption (as given in column [8] of Table 1), a Raymond-Smith thermal plasma (from hot gas associated with star-formation activity) with solar abundances, plus a power-law component (originating from X-ray binaries and AGN when present). Similar composite fits have been performed successfully for ULIRGs (see, e.g., Franceschini et al. 2003; Ptak et al. 2003). We find that our simple model provides a reasonable fit to these 13 LIRGs ( 0.62–1.35; median[] = 1.09). For NGC 3221, we find that the best-fit plasma component provides only a negligible contribution to the total spectrum; we therefore fit the X-ray spectrum using only a power-law model. For the remaining two full-band detected LIRGs that had 30–50 net counts (NGC 4418 and CGCG 049057) we performed simple power-law fits to the unbinned spectral data by minimizing the Cash statistic (Cash 1979). For NGC 4418, which was observed in two exposures (see Table 2), we performed joint-spectral fitting of the two observations.
The galaxy-wide best-fit model parameters are provided in Table 3. Using these models and the distances provided in column (7) of Table 1, we computed the total galaxy-wide 2–10 keV power output . For sources that were not detected in the hard band, we computed 3 upper limits to using our best-fit spectral model renormalized to the 3 upper limit on the 2–8 keV count-rate. In the case of IC 860, which was not detected in the full or hard bands, we assumed a simple power-law model with . Our best estimate values of are provided in column (8) of Table 3. Using our spectral fits, we estimate that hot gas emission will provide only a negligible contribution (6.5% for all LIRGs) to the total 2–10 keV emission for our LIRGs. We therefore expect that LIRGs that do not harbor a luminous AGN (see 4.2 below) will have dominated by X-ray binary emission.
4.2. AGN Contribution to Total Galaxy X-ray Emission
As noted in columns (13) and (14) of Table 1, 5–7 of the LIRGs in our sample have been identified to harbor an AGN via optical spectroscopy. Additional evidence for AGN activity in these LIRGs has been observed in Spitzer infrared spectrograph (IRS) data available from the archive for the entire sample. These data were analyzed following the methods outlined in Goulding & Alexander (2009). The Spitzer data reveal emission-line features (e.g., [Ne V] 14.3m or 24.3m) indicative of AGN activity for NGC 1068, NGC 1365, NGC 4194, ESO 420G013, NGC 5135, and NGC 7771, and in the case of Arp 299 a hot-dust component from an AGN has been identified by Alonso-Herrero et al. (2009). Furthermore, X-ray studies of NGC 1068 (e.g., Ogle et al. 2003), NGC 1365 (e.g., Risaliti et al. 2009b), Arp 299 (e.g., Della Ceca et al. 2002), NGC 5135 (Levenson et al. 2004), and NGC 7771 (Jenkins et al. 2005) have revealed X-ray spectral signatures of AGN activity (primarily through the presence of a heavily-absorbed X-ray emission component and/or Fe K emission lines). In column (10) of Table 3, we highlight whether a source has evidence for AGN activity from the optical, infrared, and/or X-ray bands.
In cases where the AGN is luminous in the X-ray band, the AGN component will dominate the integrated (galaxy-wide plus nuclear) 2–10 keV power (column 8 of Table 3). In a forthcoming paper (Stratford et al. in-prep), we will present multiwavelength analyses that characterize the detailed accretion properties of the AGNs in our LIRG sample; however, for our purposes, we are primarily interested in how the galaxy-wide 2–10 keV emission from X-ray binaries correlates with SFR and and therefore remove the sources that have 2–10 keV emission dominated by AGN activity.
To estimate the AGN contribution to for each LIRG, we began by estimating the position of the nucleus of each galaxy. For the majority of the LIRGs, the nucleus was isolated first by eye using the DSS red images and then by choosing manually the wavdetect position of the brightest 0.5–8 keV source within the optical nuclear region. The adopted LIRG nuclei are generally consistent with the apparent optical nuclei; their locations are shown in Figures 1 and 3 (gray crosses). In most cases, the X-ray nucleus can be obviously characterized as a bright point-source at the center of diffuse X-ray emission or a single point-source at the center of the optical nuclear region. However, for Arp 299 and NGC 5135, there was more than one possible choice for the central nuclear X-ray source; for these galaxies, we adopted the positions of the AGN components noted by Zezas et al. (2003) and Levenson et al. (2004), respectively. Furthermore, for NGC 5653 and IC 860 there were no obvious central X-ray point sources to identify as the nucleus; we therefore estimated by eye the nuclear positions of these galaxies using the DSS red images.
At the nuclear position of each source, we extracted nuclear source counts and mean exposure times from the 2–8 keV images and exposure maps, respectively, using a circular aperture with radius equal to the 90% encircled-energy fraction radius (Feigelson et al. 2000).222Feigelson et al. (2000) is available on the WWW at http://www.astro.psu.edu/xray/acis/memos/memoindex.html. We estimated the local nuclear background count-rate for each source by extracting nuclear background counts and exposure times from an annulus centered on the nuclear position with inner and outer radii equal to 1.5 and 2.5 times the 90% encircled-energy fraction radius, respectively. The net nuclear 2–8 keV count-rates were then computed and compared with the total galaxy-wide count-rates computed in 4.1.
In column (9) of Table 3, we provide / for the LIRGs in our sample. We note that for NGC 1068, we utilized the nuclear and galaxy-wide 2–10 keV luminosities provided by Young et al. (2001). Sources without listed values of / had both galactic and nuclear components that were undetected in the 2–8 keV band. For NGC 23, the nucleus was detected in the 2–8 keV band, but due to the increased background over the larger galaxy-wide area, the total galaxy emission was formally undetected; for this source, we listed the 3 lower limit on /. We consider the observed 2–10 keV emission of the LIRGs to be “AGN dominant” if there is both evidence for AGN activity from the optical, infrared, and/or X-ray as noted in column (10) in Table 3 and (see column [9] of Table 3). We find that NGC 1068, NGC 1365, NGC 4194, and NGC 7771 satisfy these conditions. In 5 and 6 below, we study galaxies with 2–10 keV emission dominated by X-ray binary populations, and therefore exclude the four AGN-dominant LIRGs from our further analyses. We note that a few of the remaining “normal” LIRGs in our sample harbor AGNs, which likely provide some contribution to the nuclear 2–10 keV emission. However, since we generally expect that the unresolved nucleus (at scales 500 pc) will also contain powerful star-formation regions (e.g., Scoville et al. 2000; Alonso-Herrero et al. 2006a), which will contribute to the total galaxy-wide X-ray binary emission, we do not attempt to subtract any AGN component in estimating .
5. Results
In this section, we explore the correlation between X-ray luminosity and SFR using exclusively Chandra data from the nearby normal galaxies from C04, LIRGs from this work, and LIRGs/ULIRGs from the GOALS (Iw09); hereafter, we refer to these three data sets collectively as the full Chandra sample. In the analyses that follow, we have removed galaxies that are observed to harbor an X-ray luminous AGN, and for the C04 sample, we removed early-type galaxies that do not have accurate measures of SFR. For the C04 sample, AGNs played a negligible role in the total X-ray emission from their galaxies and therefore all 24 late-type galaxies (i.e., spirals and irregulars) are included here. For the LIRG sample, the AGNs were identified following the techniques in 4.2; the remaining 13 “normal” LIRGs are members of the full Chandra sample. For the Iw09 sample of 44 LIRGs/ULIRGs, we excluded the 15 obvious AGNs noted by Iw09. We note, however, that Iw09 utilized X-ray hardness and/or the presence of a strong Fe K line at 6.4 keV to identify AGN activity in their LIRGs/ULIRGs, which is somewhat different from the methods used for our LIRG sample (see 4.2). For example, Arp 299, the only galaxy present in both the Iw09 LIRGs/ULIRGs and our LIRG sample, was classified as an AGN by Iw09; hereafter, we adopt our “normal galaxy” classification and physical properties for this source. For the remaining 29 “normal” LIRGs/ULIRGs from the Iw09 sample, 23 had estimates of and SFR from H10, and for the 6 galaxies without H10 counterparts, we utilized the methods described in 2.2 to calculate and SFR. In total, our full Chandra sample consists of 66 normal galaxies (i.e., 24 from C04, 13 LIRGs from this study, and 29 LIRGs/ULIRGs from Iw09) and we use these galaxies in the statistical analyses that follow.
5.1. A Chandra Perspective on the X-ray/SFR Correlation
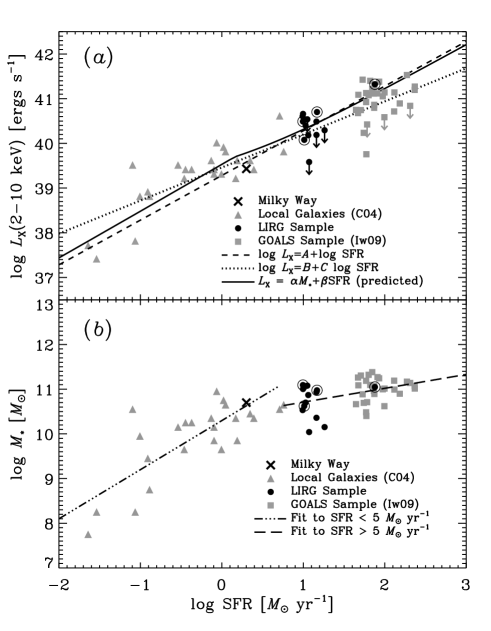
In Figure 4, we show the galaxy-wide 2–10 keV luminosity versus SFR for the full Chandra sample. Beginning with a simple constant /SFR model, , where is a constant, we utilized the Kaplan-Meier estimator (e.g., Feigelson & Nelson 1986) available through the Astronomy SURVival Analysis software package (ASURV Rev. 1.2; Isobe & Feigelson 1990; LaValley et al.1992) to calculate the mean logarithmic ratio . The Kaplan-Meier estimator appropriately handles the censored data (i.e., upper limits) in our sample. We find (in logarithmic units of ergs s-1 [ yr-1]-1; 1 error) with a 1 scatter of 0.48 dex; this relation is plotted in Fig 4 with a dashed line and is tabulated in Table 4. Assuming a power-law scenario where , we utilized the expectation-maximization (EM) algorithm available through ASURV to find a best-fit relation of and (see Fig. 4, dotted curve and Table 4). We note that the use of a power-law scenario reduces the scatter by 0.1 dex (0.39 dex scatter); however, the assumption of such a highly non-linear relation over the entire SFR range is difficult to explain on physical grounds.
We note that at SFR 1–10 yr-1, the slope of the X-ray/SFR relation appears to become flatter. Grimm et al. (2003) and Gilfanov et al. (2004a,b) argue that such a change in slope is expected in a scenario where the X-ray emission is dominated by HMXBs and a universal HMXB luminosity function with a normalization that scales linearly with SFR is applied. In this scenario, at SFR 1–10 yr-1, the relation is expected to be steeper than linear ( SFR1.7), and at SFR 1–10 yr-1, the relation is expected to become linear ( SFR). Dividing our data into low and high SFR regimes around SFR = 5 yr-1 and performing power-law fits, we find
where the cut-off SFR yr-1 was determined by setting the upper and lower relations for equal to each other and solving for SFR. This two-regime relation can be used to obtain a reasonable (with a 1 scatter of 0.4 dex; see Table 4) estimate of based on SFR alone; however, as we will discuss in 6.2 below, some LIRGs and ULIRGs may fall 0.5–1 dex below this relation due to significant intrinsic attenuation of the 2–10 keV emission. We note that the measured slopes of these relations are inconsistent with those predicted by Grimm et al. (2003) and Gilfanov et al. (2004a,b). We speculate that this is due to the presence of LMXBs that provide a non-negligible contribution to in the low-SFR regime. In the next section, we explore the use of a physically-motivated scaling of with and SFR that incorporates emission from both HMXB and LMXB populations.
5.2. Correlating with and SFR
From Figure 4, we notice that the mean /SFR ratio (dashed line) for the total Chandra sample generally lies below the data for galaxies with SFR 5 yr-1 (i.e., from C04), primarily due to the lower values of /SFR for the many LIRGs/ULIRGs in the sample. This trend has been noted by PR07, who suggest that typical nearby galaxies (SFR 5 yr-1) will have fractionally important contributions from both HMXBs and LMXBs, making them more X-ray luminous per unit SFR than “star-formation active” galaxies like LIRGs/ULIRGs, which are likely to have negligible contributions from LMXBs and will be dominated by HMXBs. As recognized by C04, the total 2–10 keV luminosity for nearby galaxies can reasonably be quantified as the sum of contributions from LMXBs and HMXBs, which to first order are expected to scale linearly with and SFR, respectively.333However, see Grimm et al. (2003), Gilfanov et al. (2004a), and Gilfanov (2004) for different scalings depending on and SFR regimes. The C04 relation can be expressed using the following equation:
| (3) |
where and are scaling constants (see below). From equation 3, we expect that galaxies with larger SFR/ will have more significant contributions from HMXBs, whereas galaxies with smaller SFR/ will have larger contributions from LMXBs. We would therefore expect that should scale more closely with SFR/ than SFR alone.
In Figure 4, we show versus SFR for the full Chandra sample. It is apparent that there is a strong correlation between and SFR (Spearman’s probability of 99.99%). Using simple polynomial fitting techniques, we find for galaxies with SFR 5 yr-1, and SFR are nearly linearly correlated (); however, for galaxies with SFR 5 yr-1, the relationship becomes shallower (). From this analysis, we find that the quantity SFR/ remains roughly constant for SFR 0.01–1 yr-1, and to first order, this plausibly suggests that the HMXB and LMXB fractional contributions would remain roughly constant as well. Indeed, as noted in 5.1 above, we found that over this range of SFR. At SFR 5 yr-1, the average SFR/ increases from a constant value, which would qualitatively allow for HMXBs to make an increasingly large fractional contribution to the total X-ray luminosity while the /SFR ratio decreases due to the reduced fractional contribution from LMXBs; in 5.1 above, we found that in this regime.
| Model Description | Best-Fit Parameters | 1 Scatter (dex) |
|---|---|---|
| ……………………………………… | 0.48 | |
| and | 0.39 | |
| (SFR yr-1) | and | 0.41 |
| (SFR yr-1) | and | 0.36 |
| ergs s-1 | ||
| ergs s-1 ( yr-1)-1 | 0.34 |
NOTE.—Summary of best-fit relations between , SFR, and for the models described in 5. Fits have been performed following the methods described in 5.1 and 5.2; all quoted errors are 1. We note that the inclusion of both SFR and in the final model provides the least statistical scatter of all the models.
The best estimates to date of the quantities and come from the C04 analysis, which does not include Chandra constraints on galaxies with SFR 5 yr-1 (i.e., LIRGs and ULIRGs), a regime where the SFR/ is expected to be large and HMXBs are likely to dominate. Here, we utilize the full Chandra sample to improve the calibration of and for data covering the broad range of SFR 0.01–400 yr-1.
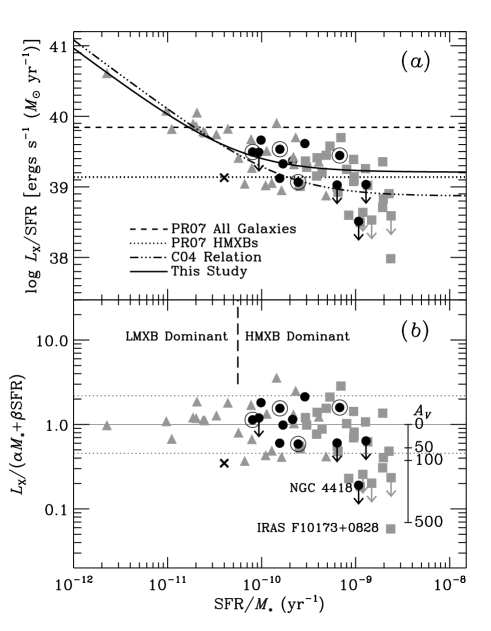
Considering the above discussion, it is useful to examine the relationship of /SFR as a function of SFR/. Following equation 3, the quantity /SFR can be written as follows:
| (4) |
From equation 4, we see that /SFR , and in Figure 5, we plot /SFR versus SFR/ for the full Chandra sample. We see that the IMF and X-ray bandpass adjusted C04 relation (dot-dashed curve in Fig 5), which was determined solely from the C04 data (triangles), predicts well the basic observed trend; however, it mildly underpredicts /SFR for LIRGs and ULIRGs. Using the full Chandra sample, we fit the data using the EM algorithm and the model provided in equation 4. We find best-fit values of ergs s-1 and ergs s-1 ( yr-1)-1 with a scatter of 0.34 dex, which is smaller than that produced by fitting for SFR alone (see 5.1; Table 4).
Our best-fit relation is plotted as a solid curve in Figure 5. In Figure 4, we combine this relation with the –SFR relations provided in 5.1 and Figure 4 to show the expected –SFR relation (see solid curve in Fig. 4); in general, the combined relations appear to fit the data better than a simple mean /SFR ratio and a less physically meaningful power-law relation (i.e., ).
After accounting for differences in IMF and X-ray bandpass, we find that /(C04) = 0.76 and /(C04) = 2.18, suggesting that for a given SFR/, HMXBs provide 2.9 times larger contributions over LMXBs than previously reported. We further note that our best-fit relation has reduced the error bars for and by factors of 3.8 and 2.1, respectively. We find that for SFR/ yr-1 (corresponding roughly to SFR yr-1 or assuming the –SFR correlation in Fig. 4 and in equation 2), HMXBs will dominate the galaxy-wide 2–10 keV. This transition SFR/ is a factor of 2.9 times lower than previous estimates.
We note that the MW (plotted in Fig. 5 as a cross) appears to be located below our best-fit correlation line by a factor of 0.37 dex, which is just outside the 1 scatter in the relation. Our best-fit relation predicts that a galaxy with and SFR equal to those of the MW, will have (LMXB)/(HMXB) , which is much less than the (LMXB)/(HMXB) estimated by Grimm et al. (2002) using the measured luminosity functions of LMXBs and HMXBs. We speculate that these differences are due to either (1) the large uncertainties in measuring and SFR for the MW, as a result of our location within it, and/or (2) the MW being a true outlier to the general correlation. It has been noted by Hammer et al. (2007), that the MW does not appear to follow other correlations along physical parameter planes (e.g., planes drawn by disk rotation velocity, -band luminosity, disk angular momentum, and mean [Fe/H] abundances of stars in the outskirts of the disk) drawn using a sample of galaxies with similar . Hammer et al. conclude that the MW is likely to have a different star-formation history and disk construction than other similar galaxies; such conditions could plausibly affect the scaling of LMXB and HMXB power output with and SFR, respectively.
6. Discussion
In Figure 5, we show the residuals to our best-fit relation (i.e., ). As noted in 5.2, the scatter over the entire range of SFR/ is 0.34 dex. There are several factors that are likely to contribute to the scatter in this relation including: (1) variations in the LMXB populations due to a diversity of stellar ages and star-formation histories (e.g., Fragos et al. 2008); (2) unrelated low-level AGN activity that affect estimates of the X-ray and/or infrared luminosities, two quantities that are important to this analysis (e.g., Imanishi et al. 2007, 2010; Iw09); (3) strong statistical fluctuations due to small numbers of luminous X-ray binaries that dominate the total X-ray luminosity, particularly for galaxies with small SFR and/or (e.g., Grimm et al. 2003; Gilfanov et al. 2004a; see 6.1 below); and (4) significant extinction that can affect estimates of stellar mass, and in the most extreme cases, may obscure even 2–10 keV emission (see 6.2 below). In 6.1 and 6.2 below, we explore in more detail points (3) and (4), respectively.
6.1. Statistical Considerations at Low SFR and
As discussed in 5.1, the qualitative change in slope of the X-ray/SFR correlation has previously been noted by Grimm et al. (2003) and Gilfanov et al. (2004a,b) who predict such behavior for an HMXB-dominant . These authors suggest that since the HMXB luminosity function is a relatively shallow power-law with (with 1.6) and a maximum cut-off luminosity of ergs s-1 (see, e.g., Grimm et al. 2003; Swartz et al. 2004), then in the low-SFR regime, the most luminous HMXB will have a most probable luminosity , which is less than . In this regime, the integrated X-ray luminosity is therefore expected to scale with (or SFR1.7 in the case of ). Such an effect is predicted to produce a non-linear SFR dependence for the HMXB contribution to for SFR 1–10 yr-1. Similar logic can be applied to the LMXB contribution to using the more complex luminosity function for LMXBs, which is expected to have a linear normalization that scales with . However, the cut-off luminosity for the LMXB population is likely to be much lower (1039 ergs s-1) than that of HMXBs and therefore (LMXB) is expected to be linear for galaxies with 5–20 and very close to linear for smaller values of (e.g., Gilfanov et al. 2004a; Gilfanov 2004).

In 5.1, we noted that in the low-SFR regime (SFR 0.01–1 yr-1), /SFR and SFR/ were roughly constant; over this range these quantities have median values of ergs s-1 ( yr-1)-1 and yr-1, respectively. From our best-fit relation for equation 3, we estimate (LMXB)/(HMXB) for these galaxies, suggesting that both LMXBs and HMXBs are estimated to provide significant contributions to in this regime. However, if indeed and are accurate descriptions of the respective HMXB and LMXB emission in this regime, then we would have expected that . In 5.1, we found that . This suggests that either (1) scales with and provides a small contribution to or (2) . Future X-ray and multiwavelength studies of large numbers of normal galaxies in this regime may provide the necessary statistical basis to allow discrimination between these two scenarios; future X-ray missions such as IXO and WFXT will enable efficient detection of many galaxies in the low-SFR regime.444More information regarding IXO and WFXT can be found at http://ixo.gsfc.nasa.gov/ and http://wfxt.pha.jhu.edu/, respectively. Otherwise, a combination of X-ray and optical/near-IR observatories with highly-precise astrometry would be needed to allow for the detection of X-ray binaries and the reliable identification and classification of their stellar counterparts in external galaxies. This is currently broadly possible with the combination of Chandra and HST data for a small number of nearby galaxies. Future missions such as Generation-X and JWST will undoubtedly expand this science to more representative galaxies that cover the entire low-SFR regime.555More information regarding Generation-X and JWST can be found at http://www.cfa.harvard.edu/hea/genx/ and http://www.jwst.nasa.gov/, respectively.
6.2. A Deficit of X-ray Emission in the Most Actively Star-Forming Galaxies
From Figure 5, it is evident that for several of the most star-formation active LIRGs/ULIRGs (i.e., SFR/ 10-9 yr-1) in the total Chandra sample there is a departure from the best-fit relation. For example, IRAS 072510248, IRAS F15250+3608, IRAS F10173+0828, IRAS 21101+5810, and NGC 4418 all have residuals to our best fit that fall below the 2 scatter, when only 1–2 galaxies are expected statistically over the entire SFR/ range. If we exclude galaxies with SFR/ 10-9 yr-1, this significantly reduces the scatter to 0.26 dex (i.e., by 20%). Studies of LIRGs/ULIRGs have found that in these objects the powerful star-formation activity occurs in compact regions that are surrounded by large columns of gas and dust (e.g., Soifer et al. 2000; Alonso-Herrero et al. 2006b; Siebenmorgen et al. 2008). The obscuration to these star-forming regions can be very significant ( mag; e.g., Genzel et al. 1998; Siebenmorgen & Krügel 2007) and can attenuate emission over the 2–10 keV bandpass.
To estimate the effect that obscuration can have on the observed 2–10 keV power for ULIRG levels of extinction, we first converted to following the relation cm-2 from Güver & Özel (2009), which was calibrated using measurements of various columns through the Milky Way. We note that this calibration has been calibrated only over the range of 0.2–30 mag and is subject to large uncertainties when applied to other galaxies, which may have different chemical compositions in their interstellar mediums. A range of 0–500 therefore implies column densities in the range 0– cm-2. Using PIMMS and an assumed power-law X-ray SED with , we find that the emergent 2–10 keV luminosity will be attenuated by factors of 2, 3, and 15 for 50, 100, and 500, respectively (see vertical bar in Fig. 5); such visual extinctions are likely to be present in at least some LIRGs/ULIRGs (e.g., Genzel et al. 1998 estimate that some ULIRGs may even reach ). We note that there are only a few LIRGs/ULIRGs in our sample with the high-quality optical to far-IR data required to estimate accurately. For example, the well-studied ULIRG Arp 220 has a 2–10 keV luminosity that is a factor of 3 times lower than that expected from our best-fit relation for equation 4. Detailed modelling of the infrared-to-optical spectrum suggests a global value of 50–150 mag (e.g., Siebenmorgen & Krügel 2007), implying 1.2–3.5 cm-2 and therefore an expected factor of 2–4 attenuation of the intrinsic 2–10 keV luminosity, in good agreement with the deficit that we observe.
To assess whether there is broader evidence that the X-ray underluminous LIRGs/ULIRGs in the full Chandra sample may be subject to significant 2–10 keV attenuation, we utilized two informative quantities: (1) the IRAS 60–to–100m flux ratio (), which has been shown to correlate well with mean dust temperature and infrared luminosity surface density (e.g., Chanial et al. 2007); and (2) the IR-to-UV luminosity ratio (), which provides a direct measure of UV obscuration from star-forming regions. If the X-ray emission from star-forming regions is buried under significant absorbing columns, we would expect the star-formation to be highly concentrated and not dispersed through the galaxy (i.e., large ) and heavily obscured in the UV (i.e., large ). In Figure 6 and 6, we plot the residuals to our best-fit relation (]) versus and , respectively. It is evident that the LIRGs/ULIRGs with the largest deficit of X-ray emission with respect to our best-fit relation are those with large values of and ; a Spearman’s test reveals that the residuals are correlated with each quantity at the 99.8% and 99.9% significance levels, respectively. We therefore conclude that obscuration is at least partially responsible for the deficit of observed 2–10 keV emission at the largest SFR/.
7. Conclusions
In this paper, we present new results from Chandra observations of a complete
sample of 17 LIRGs with Mpc and Galactic column densities cm-2. Our Chandra observations reveal a
variety of X-ray morphologies for the LIRGs, with the majority of their
corresponding X-ray spectra being well-described by a hot-gas component (with
keV) plus a power-law ( 1–3), which is
expected to originate from X-ray binaries, and when present, an AGN. We find
that four out of the 17 LIRGs both show evidence for AGN activity in the
optical, infrared, and/or X-ray band and contain a nuclear component that
dominates the integrated 2–10 keV luminosity. We study the
galaxy-wide 2–10 keV luminosity and its
correlation with SFR and using the 13 non-AGN-dominant LIRGs combined
with Chandra studies of less star-formation active normal galaxies (from C04)
and more powerful LIRGs and ULIRGs (from Iw09), collectively referred to as the
total Chandra sample. Our key results can be summarized as follows:
(1)—For the galaxies that make up our total Chandra sample, we find that SFR and are strongly correlated, such that for SFR 0.01–5 yr-1 and for SFR 5 yr-1 (see Fig. 4).
(2)—We find that is strongly correlated with SFR (the X-ray/SFR correlation), as has been found in previous studies (see Fig. 4). Similar to point (1), the X-ray/SFR correlation slope becomes shallower for SFR 1–10 yr-1. We find that for SFR 0.4 yr-1 and for SFR 0.4 yr-1 provides a reasonable (with 0.4 dex scatter; see Table 4) estimate of the . The change in slope is likely to be related to the changing slope of the correlation between SFR and , since we expect the total galaxy-wide 2–10 keV luminosity to be the sum of contributions from HMXBs and LMXBs, which to first order are expected to scale with SFR and , respectively.
(3)—Under the assumption that can be written as , we find best-fitting parameters of ergs s-1 and ergs s-1 ( yr-1)-1. These values suggest that HMXBs dominate the X-ray emission for SFR/ yr-1, a factor of 2.9 times lower than previous estimates.
(4)—For the most actively star-forming LIRGs and ULIRGs (i.e., those with SFR/ yr, we find an excess of objects with lower than expected. These sources have infrared colors and UV to total-IR luminosities indicative of compact star-forming regions with extreme extinction. We argue that such star-forming regions are likely to have attenuated 2–10 keV emission.
References
- Alonso-Herrero et al. (2006a) Alonso-Herrero, A., Rieke, G. H., Rieke, M. J., Colina, L., Pérez-González, P. G., & Ryder, S. D. 2006a, ApJ, 650, 835
- Alonso-Herrero et al. (2006b) Alonso-Herrero, A., Colina, L., Packham, C., Díaz-Santos, T., Rieke, G. H., Radomski, J. T., & Telesco, C. M. 2006b, ApJL, 652, L83
- Alonso-Herrero et al. (2009) Alonso-Herrero, A., et al. 2009, ApJ, 697, 660
- Armus et al. (1989) Armus, L., Heckman, T. M., & Miley, G. K. 1989, ApJ, 347, 727
- Armus et al. (2009) Armus, L., et al. 2009, PASP, 121, 559
- Arnaud (1996) Arnaud, K.A., 1996, Astronomical Data Analysis Software and Systems V, eds. Jacoby G. and Barnes J., p17, ASP Conf. Series volume 101
- Baan et al. (1998) Baan, W. A., Salzer, J. J., & Lewinter, R. D. 1998, ApJ, 509, 633
- Bauer et al. (2002) Bauer, F. E., Alexander, D. M., Brandt, W. N., Hornschemeier, A. E., Vignali, C., Garmire, G. P., & Schneider, D. P. 2002, AJ, 124, 2351
- Bauer et al. (2004) Bauer, F. E., Alexander, D. M., Brandt, W. N., Schneider, D. P., Treister, E., Hornschemeier, A. E., & Garmire, G. P. 2004, AJ, 128, 2048
- Bell et al. (2003) Bell, E. F., McIntosh, D. H., Katz, N., & Weinberg, M. D. 2003, ApJS, 149, 289
- Bell et al. (2005) Bell, E. F., et al. 2005, ApJ, 625, 23
- Cash (1979) Cash, W. 1979, ApJ, 228, 939
- Chen et al. (2010) Chen, Y., Lowenthal, J. D., & Yun, M. S. 2010, ApJ, 712, 1385
- Chanial et al. (2007) Chanial, P., Flores, H., Guiderdoni, B., Elbaz, D., Hammer, F., & Vigroux, L. 2007, A&A, 462, 81
- Colbert et al. (2004) Colbert, E. J. M., Heckman, T. M., Ptak, A. F., Strickland, D. K., & Weaver, K. A. 2004, ApJ, 602, 231 (C04)
- Coziol et al. (1998) Coziol, R., Torres, C. A. O., Quast, G. R., Contini, T., & Davoust, E. 1998, ApJS, 119, 239
- Della Ceca et al. (2002) Della Ceca, R., et al. 2002, ApJL, 581, L9
- de Vaucouleurs et al. (1991) de Vaucouleurs, G., de Vaucouleurs, A., Corwin, H. G., Buta, R. J., Paturel, G., & Fouque, P. 1991, Volume 1-3, XII, 2069 pp. 7 figs.. Springer-Verlag Berlin Heidelberg New York
- Dickey & Lockman (1990) Dickey, J. M., & Lockman, F. J. 1990, ARA&A, 28, 215
- Fabbiano (1989) Fabbiano, G. 1989, ARA&A, 27, 87
- Fabbiano (2006) Fabbiano, G. 2006, ARA&A, 44, 323
- Feigelson & Nelson (1985) Feigelson, E. D., & Nelson, P. I. 1985, ApJ, 293, 192
- Fragos et al. (2008) Fragos, T., et al. 2008, ApJ, 683, 346
- Franceschini et al. (2003) Franceschini, A., et al. 2003, MNRAS, 343, 1181
- García-Marín et al. (2006) García-Marín, M., Colina, L., Arribas, S., Alonso-Herrero, A., & Mediavilla, E. 2006, ApJ, 650, 850
- Genzel et al. (1998) Genzel, R., et al. 1998, ApJ, 498, 579
- Gilfanov (2004) Gilfanov, M. 2004, MNRAS, 349, 146
- Gilfanov et al. (2004) Gilfanov, M., Grimm, H.-J., & Sunyaev, R. 2004a, MNRAS, 351, 1365
- Gilfanov et al. (2004) Gilfanov, M., Grimm, H.-J., & Sunyaev, R. 2004b, Nuclear Physics B Proceedings Supplements, 132, 369
- Goulding & Alexander (2009) Goulding, A. D., & Alexander, D. M. 2009, MNRAS, 398, 1165
- Grimm et al. (2002) Grimm, H.-J., Gilfanov, M., & Sunyaev, R. 2002, A&A, 391, 923
- Grimm et al. (2003) Grimm, H.-J., Gilfanov, M., & Sunyaev, R. 2003, MNRAS, 339, 793
- Güver Özel (2009) Güver, T., Özel, F. 2009, MNRAS, 400, 2050
- Hammer et al. (2007) Hammer, F., Puech, M., Chemin, L., Flores, H., & Lehnert, M. D. 2007, ApJ, 662, 322
- Hickox & Markevitch (2006) Hickox, R. C., & Markevitch, M. 2006, ApJ, 645, 95
- Ho et al. (1997) Ho, L. C., Filippenko, A. V., & Sargent, W. L. W. 1997, ApJS, 112, 315
- Hornschemeier et al. (2001) Hornschemeier, A.E., et al. 2001, ApJ, 554, 742
- Hornschemeier et al. (2002) Hornschemeier, A. E., et al. 2002, ApJ, 568, 82
- Howell et al. (2010) Howell, J. H., et al. 2010, ApJ, in-press (arXiv:1004.0985) (H10)
- Imanishi et al. (2007) Imanishi, M., Dudley, C. C., Maiolino, R., Maloney, P. R., Nakagawa, T., & Risaliti, G. 2007, ApJS, 171, 72
- Imanishi et al. (2010) Imanishi, M., Maiolino, R., & Nakagawa, T. 2010, ApJ, 709, 801
- Isobe & Feigelson (1990) Isobe, T., & Feigelson, E. 1990, BAAS, 22, 917
- Iwasawa et al. (2009) Iwasawa, K., Sanders, D. B., Evans, A. S., Mazzarella, J. M., Armus, L., & Surace, J. A. 2009, ApJL, 695, L103 (Iw09)
- Jarrett et al. (2003) Jarrett, T. H., Chester, T., Cutri, R., Schneider, S. E., & Huchra, J. P. 2003, AJ, 125, 525
- Jenkins et al. (2005) Jenkins, L. P., Roberts, T. P., Ward, M. J., & Zezas, A. 2005, MNRAS, 357, 109
- Kaaret & Alonso-Herrero (2008) Kaaret, P., & Alonso-Herrero, A. 2008, ApJ, 682, 1020
- Keel et al. (1985) Keel, W. C., Kennicutt, R. C., Jr., Hummel, E., & van der Hulst, J. M. 1985, AJ, 90, 708
- Kennicutt (1998) Kennicutt, R. C., Jr. 1998, ARA&A, 36, 189
- Kennicutt et al. (2003) Kennicutt, R. C., Jr., et al. 2003, PASP, 115, 928
- Kewley et al. (2001) Kewley, L. J., Heisler, C. A., Dopita, M. A., & Lumsden, S. 2001, ApJS, 132, 37
- Kim et al. (2007) Kim, M., Wilkes, B. J., Kim, D.-W., Green, P. J., Barkhouse, W. A., Lee, M. G., Silverman, J. D., & Tananbaum, H. D. 2007, ApJ, 659, 29
- Kroupa (2001) Kroupa, P. 2001, MNRAS, 322, 231
- Lavalley et al. (1992) Lavalley, M., Isobe, T., & Feigelson, E. 1992, ASP Conf. Ser. 25: Astronomical Data Analysis Software and Systems I, 25, 245
- Lehmer et al. (2008) Lehmer, B. D., et al. 2008, ApJ, 681, 1163
- Levenson et al. (2004) Levenson, N. A., Weaver, K. A., Heckman, T. M., Awaki, H., & Terashima, Y. 2004, ApJ, 602, 135
- Luo et al. (2008) Luo, B., et al. 2008, ApJS, 179, 19
- McKee & Williams (1997) McKee, C. F., & Williams, J. P. 1997, ApJ, 476, 144
- Melnick & Mirabel (1990) Melnick, J., & Mirabel, I. F. 1990, A&A, 231, L19
- Moretti et al. (2003) Moretti, A., Campana, S., Lazzati, D., & Tagliaferri, G. 2003, ApJ, 588, 696
- Ogle et al. (2003) Ogle, P. M., Brookings, T., Canizares, C. R., Lee, J. C., & Marshall, H. L. 2003, A&A, 402, 849
- Persic et al. (2004) Persic, M., Rephaeli, Y., Braito, V., Cappi, M., Della Ceca, R., Franceschini, A., & Gruber, D. E. 2004, A&A, 419, 849
- Persic & Rephaeli (2002) Persic, M., & Rephaeli, Y. 2002, A&A, 382, 843
- Persic & Rephaeli (2007) Persic, M., & Rephaeli, Y. 2007, A&A, 463, 481
- Ptak et al. (2003) Ptak, A., Heckman, T., Levenson, N. A., Weaver, K., & Strickland, D. 2003, ApJ, 592, 782
- Ranalli et al. (2003) Ranalli, P., Comastri, A., & Setti, G. 2003, A&A, 399, 39
- Risaliti et al. (2009) Risaliti, G., et al. 2009a, ApJ, 696, 160
- Risaliti et al. (2009) Risaliti, G., et al. 2009b, ApJL, 705, L1
- Sandage & Tammann (1981) Sandage, A., & Tammann, G. A. 1981, Revised Shapley-Ames Catalog of Bright Galaxies (Publ. 635; Washington, DC: Carnegie Inst.)
- Sanders & Mirabel (1996) Sanders, D. B., & Mirabel, I. F. 1996, ARA&A, 34, 74
- Sanders et al. (2003) Sanders, D. B., Mazzarella, J. M., Kim, D.-C., Surace, J. A., & Soifer, B. T. 2003, AJ, 126, 1607
- Sanders et al. (1988) Sanders, D. B., Soifer, B. T., Elias, J. H., Neugebauer, G., & Matthews, K. 1988, ApJL, 328, L35
- Scoville et al. (2000) Scoville, N. Z., et al. 2000, AJ, 119, 991
- Siebenmorgen & Krügel (2007) Siebenmorgen, R., & Krügel, E. 2007, A&A, 461, 445
- Siebenmorgen et al. (2008) Siebenmorgen, R., et al. 2008, A&A, 488, 83
- Smith & Wilson (2003) Smith, D. A., & Wilson, A. S. 2003, ApJ, 591, 138
- Soifer et al. (2000) Soifer, B. T., et al. 2000, AJ, 119, 509
- Soria et al. (2009) Soria, R., Risaliti, G., Elvis, M., Fabbiano, G., Bianchi, S., & Kuncic, Z. 2009, ApJ, 695, 1614
- Spergel et al. (2003) Spergel, D. N., et al. 2003, ApJS, 148, 175
- Strateva & Komossa (2009) Strateva, I. V., & Komossa, S. 2009, ApJ, 692, 443
- Swartz et al. (2004) Swartz, D. A., Ghosh, K. K., Tennant, A. F., & Wu, K. 2004, ApJS, 154, 519
- Veilleux et al. (1995) Veilleux, S., Kim, D.-C., Sanders, D. B., Mazzarella, J. M., & Soifer, B. T. 1995, ApJS, 98, 171
- Veron-Cetty & Veron (1986) Veron-Cetty, M.-P., & Veron, P. 1986, A&AS, 66, 335
- Wang et al. (2009) Wang, J., Fabbiano, G., Elvis, M., Risaliti, G., Mazzarella, J. M., Howell, J. H., & Lord, S. 2009, ApJ, 694, 718
- Young et al. (2001) Young, A. J., Wilson, A. S., & Shopbell, P. L. 2001, ApJ, 556, 6
- Yuan et al. (2010) Yuan, T.-T., Kewley, L. J., & Sanders, D. B. 2010, ApJ, 709, 884
- Zezas et al. (2003) Zezas, A., Ward, M. J., & Murray, S. S. 2003, ApJL, 594, L31