Precision Microwave Electrodynamic Measurements of K- and Co-doped BaFe2As2
Abstract
We have studied the microwave electrodynamics of single crystal iron-based superconductors Ba0.72K0.28Fe2As2 (hole-doped, 30 K) and Ba(Fe0.95Co0.05)2As2 (electron-doped, 20 K), by cavity perturbation and broadband spectroscopy. SQUID magnetometry was used to confirm the quality and homogeneity of the samples under study. Through cavity perturbation techniques, the temperature dependence of the in-plane London penetration depth , and therefore the superfluid phase stiffness / was measured. Down to 0.4 K, the data do not show the exponential saturation at low temperatures expected from a singly-, fully-gapped superconductor. Rather, both the electron- and the hole-doped systems seem to be best described by a power law behavior, with / and n 2.5. In the three samples we studied, a weak feature near the sensitivity limit of our measurements appears near = 0.04, hinting at a corresponding low energy feature in the superconducting density of states. The data can also be relatively well-described by a simple two-gap -wave model of the order parameter, but this yields parameters which seem unrealistic and dependent on the fit range. Broadband surface resistance measurements reveal a sample dependent residual loss whose origin is unclear. The data from the Ba0.72K0.28Fe2As2 samples can be made to scale as if the extrinsic loss is treated as an additive component, indicating large scattering rates. Finally, the temperature dependence of the surface resistance at 13 GHz obeys a power law very similar to those observed for .
pacs:
74.25.nn, 74.20.RpI Introduction
Tremendous interest was generated when the fluorine-doped layered compound LaFeAsO1-xFx was reported to superconduct at 26 K. Kamihara et al. (2008) In remarkably short time, the critical temperature of this compound was increased via pressure or chemical substitution to above 55 K, significantly higher than the highest reported in any superconductor outside the cuprates (cf., MgB2 Nagamatsu et al. (2001)). Superconductivity has since been found in Ba1-xKxFe2As2 with = 38 K, Rotter et al. (2008) and in Ba(Fe1-xCoAs2 with = 23 K. Ni et al. (2008) These so-called 122-compounds are particularly important since, unlike the cuprates or the 1111 iron pnictides, they are not oxides, eliminating the potentially problematic role of oxygen stoichiometry. Moreover, large single crystals with a variety of different cation dopings in the 122-pnictides have now been synthesized, which is essential for applying a wide range of measurements of their physical properties. The need to understand the pairing mechanism and the origin of the high in any new superconductor drives a need to determine the symmetry of the order parameter, however this usually requires several different measurements to arrive at a consensus. Such measurements need to be performed on single-phase samples with well-characterized stoichiometry and sharp transitions, which imply good homogeneity; otherwise, it is challenging to compare one measurement to the next. To go even further, cation and anion disorder should also be minimized and structural information (e.g., x-ray rocking curves) should be obtained.
Historically, one powerful class of measurements that can be thought of as topological include the flux quantization measurements Keene et al. (1987) that show superconductors are a condensate of pairs, the phase coherence measurements in bimetallic dc SQUIDs and tunnel junctions made from single crystals of YBa2Cu3O6.8 and thin films of the conventional -wave superconductor Pb, Wollman et al. (1993) and the observation of half flux quanta in geometrically frustrated junctions, Tsuei et al. (1994) which were decisive in proving the extra broken symmetry in the state of the cuprates. Another group of measurements directly probes the superconducting pairing gap via spectroscopic means. This was famously the case in conventional -wave superconductivity in which measurements such as tunneling, Giaver (1960) infrared Ginsberg and Tinkham (1960); Richards and Tinkham (1960) and microwave spectroscopy Turneaure and Weissman (1968) showed a well-defined gap with a sharp threshold energy and essentially no states below the energy gap at low temperatures and in the absence of pair-breaking magnetic impurities. Such measurements were more ambiguous in the cuprates because the presence of nodes in the pairing state gave a characteristic energy gap scale, but without the very sharp threshold and with many states available down to low energies. Angle-resolved photoemission Shen et al. (1993); Ding et al. (1996) helped resolve this by showing the gap variation as a function of momentum around the Fermi surface.
Other measurements rely on inferring the presence of a gapped spectrum of excitations in the system by observing the temperature dependence of a wide range of features, including thermodynamic, transport, and electrodynamic properties. We will concentrate on electrodynamic characteristics here but will start with an introductory comment on the difficulties of making inferences from temperature dependencies in these properties. In conventional -wave superconductivity, the presence of exponentially activated behavior in many properties at low temperatures signals the presence of a non-zero minimum energy gap and hence no nodes. Such measurements Corak et al. (1956); Corak and Satterthwaite (1956) even predate BCS theory, but it has always been difficult to do this decisively since it takes high resolution data, preferably over a few decades of the low temperature exponential behavior, to be convincing. This has, for instance, been achieved in high resolution measurements of the temperature dependent microwave loss of high Q resonant cavities made of Pb. Turneaure (1967); Halbritter (1970)
In the case of non -wave states with nodes, the temperature dependencies tend towards various power laws. Here there is a significant challenge in identifying the particular state, or even in being sure that it is not really exponentially activated. One case has proven relatively easy: the line nodes of a pairing state on a cylindrical Fermi surface gave rise to an unambiguous linear temperature dependence in the London penetration depth. Hardy et al. (1993) Unfortunately, disorder quickly changes this to a quadratic temperature dependence, Hirschfeld and Goldenfeld (1993) so that in materials with pair breaking defects, especially cation doping, these techniques place high demands on resolution and careful comparison of power laws versus exponentials, plus considerable systematic work on sample dependence and multiple materials within a family. An example of this can be seen in the long effort to understand the penetration depth in the electron-doped cuprates Pr2-xCexCuO4-δ and Nd2-xCexCuO4-δ. Kokales et al. (2000)
Universal consensus regarding the gap symmetry in the iron-based superconductors does not currently exist, but the field is working hard towards remedying this situation. For example, it is known that the antiferromagnetic ground state in the BaFe2As2 parent compound is suppressed through cation substitution, thus allowing superconductivity to emerge; Ni et al. (2008); Rotter et al. (2008) being near to a magnetic state might mean that magnetic fluctuations are important for pairing and this could be reflected in the symmetry of the gap. What, then, is the pairing symmetry?
Band structure calculations Barzykin and Gorko’kov (2008); Cvetkovic and Tesanovic (2009) and angle-resolved photoemission spectroscopy experiments Liu et al. (2008); Evtushinsky et al. (2009) demonstrate that multiple bands cross the Fermi surface, making multi-band superconductivity plausible. For the hole-doped Ba1-xKxFe2As2 compound, ARPES Ding et al. (2008); Zhao et al. (2008); Nakayama et al. (2009) has found at least two different superconducting nodeless gaps in the -plane. These results are further supported by directional point-contact Andreev-reflection spectroscopy Szabó et al. (2009) and microwave surface impedance Hashimoto et al. (2009) data which suggest fully-, and perhaps multiply-, gapped superconductivity. However, the possibility for a nodal gap has not been completely ruled out: measurements of reversible magnetization Salem-Sugui Jr. et al. (2009) and thermal Hall conductivity Checkelsky et al. both yield results consistent with nodes in the gap; 75As nuclear magnetic resonance measurements Fukazawa et al. (2009) revealed the spin-lattice relaxation rate 1/ to vary close to ; and, muon spin-relaxation measurements Goko et al. (2009) exhibit a nearly linear variation in temperature of the superfluid density at low temperatures. For the electron-doped Ba(Fe1-xCoAs2 compound, heat transport measurements Dong et al. (2010) suggest a nodeless superconducting gap in the -plane. However, tunnel diode resonator techniques Gordon et al. (2009) have revealed that the penetration depth as a function of temperature exhibits a robust power law (instead of exponential) behavior, with and n being between 2 and 2.5, depending on the doping level. The question of pairing symmetry remains open.
II Materials and Methods
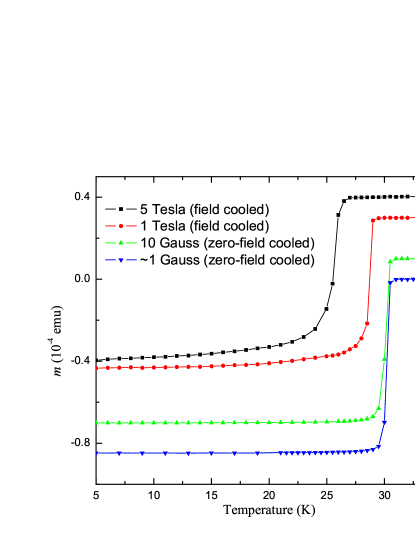
In this paper, we report on measurements of the temperature dependence of the London penetration depth and surface resistance in the hole-doped Ba0.72K0.28Fe2As2 and the electron-doped Ba(Fe0.95Co0.05)2As2 122-compounds. We have measured three high-quality single crystals, grown by the Wen group at the National Lab for Superconductivity in Beijing, using an FeAs self-flux method: Luo et al. (2008) two of Ba0.72K0.28Fe2As2 and one of Ba(Fe0.95Co0.05)2As2, with their dimensions listed in Table 1. The K-dopant occupies out-of-plane interstitial sites in the crystal lattice, whereas Co substitutes for Fe in the Fe2As2 plane. Our microwave techniques are optimized for 1 mm2 platelets and the samples used in these measurements were carefully selected to be the best single crystals available. The sample surfaces are known to degrade from prolonged exposure to ambient atmosphere. To limit surface degradation, we have only measured samples with cleaved -surfaces and between measurements the samples were stored in a vacuum desiccator. Furthermore, these samples have little secondary impurity phase (less than 10%) as checked by specific heat. Mu et al. (2009) Sample quality and homogeneity were confirmed via the width of the superconducting transition as a function of applied field, as shown in Fig. 1. The magnetic moment of sample A, for example, was measured in dc magnetic fields applied parallel to the -axis of the crystal. In low fields ( 10 G), = 30.1 K and 0.5 K. At 5 Tesla, is suppressed by 15% to 25.6 K, but the transition width remains narrow ( 1.5 K): a clear signature of a homogeneously doped sample.
| Sample | -surface | -axis | aspect | |
|---|---|---|---|---|
| (K) | (mm2) | (m) | ratio | |
| (Ba,K)Fe2As2 (A) | 29.5 | 0.928 | 50 | 20 |
| (Ba,K)Fe2As2 (B) | 28 | 0.508 | 10 | 50 |
| Ba(Fe,Co)2As2 (C) | 20 | 1.017 | 5 | 200 |
A 950 MHz loop-gap resonator, described in detail elsewhere, Hardy et al. (1993) has been used to measure the temperature dependence of the surface reactance (), thus allowing for a determination of = - (0), where is the magnetic penetration depth. Samples are mounted on the end of a temperature-controlled sapphire plate with a small a mount of silicon grease. Microwave magnetic fields are applied parallel to the -plane, a geometry in which the applied magnetic field at the surface of the sample is almost everywhere equal to the applied field, and the cavity resonance frequency is measured as a function of the sample temperature. In this geometry, screening currents flow around the crystal in both the - and -axis directions. To limit the effects of -axis contamination, platelets with large aspect ratios are preferred. When the system is run as an oscillator (rather than as a conventional resonator), an absolute frequency stability of 0.1 Hz/min provides sub-angstrom resolution in measurements. The samples were cooled to 1.2 K via a 4He pumped cryostat, and to 0.4 K via a 3He pot and a charcoal sorption pump at 4.2 K. The resonator remained at 1.2 K, in direct contact with a pumped 4He bath, throughout the experiment.
Surface resistance measurements were made using a recently developed non-resonant broadband microwave apparatus operating between 0.5 and 20 GHz, described in detail elsewhere. Turner et al. (2004) As with the above technique, microwave magnetic fields are applied parallel to the -plane. The microwave power is modulated at low frequency and the measured temperature oscillation of the superconducting sample gives a direct measure of the absorbed power. A reference alloy of Ag:Au, placed in an electromagnetically equivalent position as the superconducting sample, is then used to calibrate the absolute surface resistance of the FeAs crystal.
The temperature dependence of was measured at 13 GHz in the axial microwave magnetic fields of the TE011 modes of a right-circular cylindrical cavity, described elsewhere. Hosseini et al. (1999)
III Penetration Depth Results
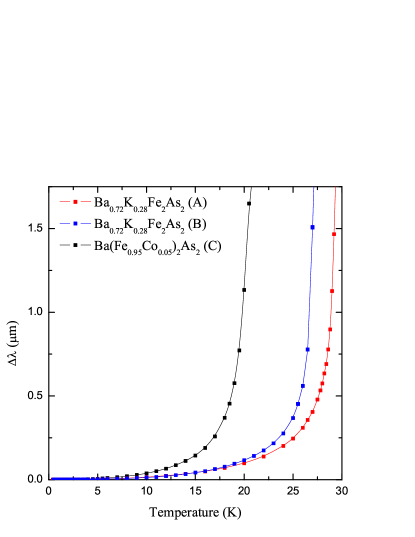
The measured magnetic penetration depth for all three samples is shown in Fig. 2 as a function of temperature. The measured background frequency shift from an empty sapphire plate with a small amount of silicone grease (approximately equal to that used to hold the sample in place) corresponds to about 0.2 Å in at base temperature and shows no systematic temperature dependence. The penetration depth of both K-doped crystals (samples A and B) has also been measured in a 12 kHz ac susceptometer, described in detail elsewhere Bidinosti and Hardy (2000) and, to within calibration uncertainties, agrees with the 950 MHz cavity perturbation measurements.
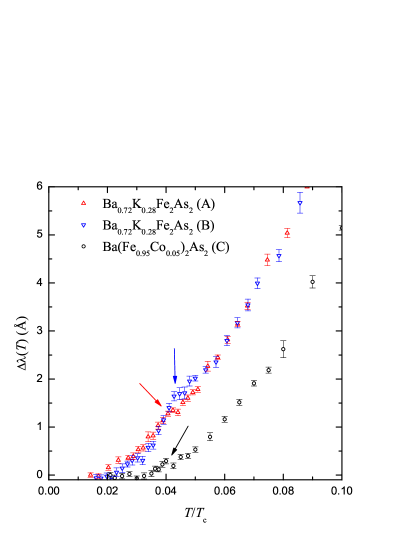
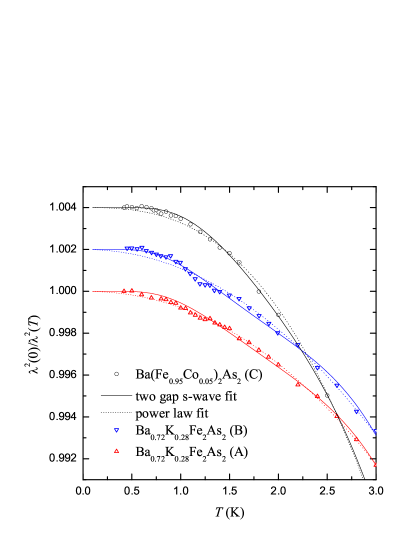
Before fitting models to the data, an anomaly that appears near 0.04 in the measured of all three samples is shown in Fig. 3. That the anomaly scales with is likely an indication that the feature is relevant and may be related to the onset of magnetic order in the crystals; for example, samples A and B are in the doping range where coexistence of a spin-density wave and superconductivity has been reported, Chen et al. (2009) and sample C has a doping level which is very close to where antiferromagnetism has been observed to coexist with superconductivity. Ni et al. (2008); Chu et al. (2009) Concern that this feature might be due to a trace contaminant, such as a small particle of superconducting aluminum metal, led us to re-measure after carefully re-cleaning the samples and sapphire. The anomaly persisted, and its origin in the bulk properties of the sample remains uncertain. Due to its small magnitude one can seek to model the overall low temperature behavior without explicitly addressing its presence.
The temperature dependence of the penetration depth provides access to the superfluid density or, more correctly, the superfluid phase stiffness, provided one has a measure of ), where is some suitably low temperature. Fig. 4 shows the extracted superfluid phase stiffness for all three samples. For the analysis that follows, we take = 2000 Å, Li et al. (2008) but Fig. 4 shows that the choice of 25% does not affect the qualitative features of the superfluid density.
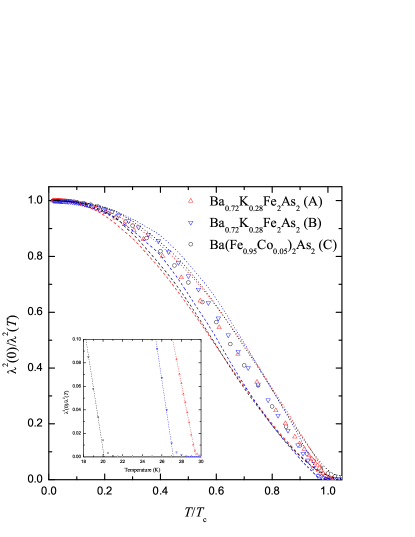
At higher temperatures, the superfluid phase stiffness approaches approximately linearly, as shown in the inset of Fig. 4, consistent with mean field behavior. Small deviations from linearity occur about 0.5 K from . The onset of curvature is likely a result of small sample inhomogeneity. There appears to be no evidence for the 3D XY critical fluctuation behavior seen in very high quality YBa2Cu3O7-δ samples Kamal et al. (1998) where / approaches with infinite, rather than finite, slope. The present iron arsenide crystals under study appear quite homogeneous, especially when compared to the broad “feet” seen in the superfluid density near in some measurements. Hashimoto et al. (2009); Prozorov et al. (2009); Martin et al. (2009)
The temperature dependence upon approaching = 0 provides the strongest constraints on possible nodes in the superconducting gap, since low temperatures query the lowest energy excitations in the system. At the lowest temperatures, there exists a number of different models, each of which are motivated by physically realizable scenarios. The simple -wave BCS model Mühlschlegel (1959) that, at low temperatures, takes the form
| (1) |
does not fit the data well at all, and additionally yields uncharacteristically small gaps of 2/kB 1.5 under the best fit conditions for the K-doped samples A and B, and 2/kB 2.0 under the best fit conditions for the Co-doped sample C. The best fit curves are not shown.
Also worth considering is whether the deviation is quadratic in temperature. A temperature dependence of the penetration depth for is expected for a superconducting gap with line nodes; e.g., -wave symmetry, in the presence of strong scattering, which will create an additional quasiparticle density of states. Hirschfeld and Goldenfeld (1993) This deviation from otherwise linear behavior of predicted for a -wave gap symmetry is expected to occur only below a characteristic temperature , controlled by the impurity concentration. The model we apply to the superfluid phase stiffness takes the form
| (2) |
The quadratic temperature dependence fits to the data work moderately well (not shown) and return values of , which is not surprising, as so much scattering should suppress . It is worth noting that variation of the superfluid density at the lowest temperatures has been observed before, in YBCO films Lee and Lemberger (1993) and crystals Bonn et al. (1993) of relative poor quality. Also worth noting is that within the -wave model with impurity scattering, Bang et al. (2009) some low energy quasiparticle excitations can occur leading to a power law-like dependence, such as a density of states proportional to .
The data can be reasonably well described by a two-gap -wave model, Kim et al. (2002) which might be an appropriate starting point for a superconductor with multiple Fermi surface sheets. At very low temperatures, the change of superfluid phase stiffness with temperature is dominated by the smallest gap, with the larger gap becoming more apparent at high temperatures. The main role of the large gap in modeling the low temperature data is to limit the rapid rise in penetration depth if a small gap were allowed to dominate a large fraction of the Fermi surface in the Brillouin zone. The model applied takes the form
| (3) |
where and is the fractional contribution of the small gap to the total superfluid density. These fits are shown as the solid black lines in Fig. 5. The gap sizes obtained from the two-gap model are small: is nearly five times smaller than , and both are less than the weak-coupling BCS expectation of .
Finally, we attempt fits to a power law,
| (4) |
In clean superconductors, the deviation of the penetration depth from its zero-temperature value (0) is proportional to and unveils the topology of the superconducting gap. Specifically, n = 1 for line nodes and n = 2 for point nodes. Non-local effects, impurities, and other defects serve to increase the exponent n; Hirschfeld and Goldenfeld (1993) consequently, deciphering the curious exponent n relies upon whether it is larger or smaller than 2. The dashed lines of Fig. 5 show how a power law with n 2.5 can be used to describe the superfluid density of these samples at low temperatures. This power law is in agreement with previous penetration depth measurements. Gordon et al. (2009)
For samples A and B, the data is best described by a power law (as determined by a statistic), regardless of the temperature range over which the fit is applied. For sample C, both a power law fit and a two-gap fit describe the data equally well. Table 2 shows the extracted fit parameters for each model. Note that the fit parameters systematically increase as the fit range is increased for the two-gap model, while there is no such systematic deviation in the parameters for the power law fits. As the 122-system is studied over successively smaller temperature ranges, it seems as though the parameters extracted from two-gap models always seem to tend towards a very small gap on an insignificant fraction of the Fermi surface.
| Sample A | two gap | power law | |||
|---|---|---|---|---|---|
| fit range | n | ||||
| 3 K | 0.9% | 0.30 | 1.65 | 2.15 | 28.0 K |
| 4 K | 1.2% | 0.34 | 1.84 | 2.22 | 25.8 K |
| 5 K | 1.8% | 0.41 | 2.08 | 2.25 | 24.9 K |
| 6 K | 2.5% | 0.48 | 2.26 | 2.31 | 23.8 K |
| 7 K | 3.3% | 0.54 | 2.40 | 2.35 | 23.0 K |
| Sample B | two gap | power law | |||
| fit range | n | ||||
| 3 K | 0.8% | 0.29 | 1.69 | 2.07 | 29.3 K |
| 4 K | 1.2% | 0.34 | 1.94 | 2.11 | 27.9 K |
| 5 K | 1.8% | 0.42 | 2.24 | 2.11 | 28.1 K |
| 6 K | 2.6% | 0.50 | 2.49 | 2.09 | 28.5 K |
| 7 K | 3.3% | 0.56 | 2.67 | 2.11 | 27.9 K |
| Sample C | two gap | power law | |||
| fit range | n | ||||
| 3 K | 2.1% | 0.57 | 2.24 | 2.73 | 14.1 K |
| 4 K | 3.6% | 0.70 | 2.62 | 2.60 | 15.4 K |
| 5 K | 4.0% | 0.72 | 2.75 | 2.53 | 16.2 K |
| 6 K | 3.5% | 0.69 | 2.66 | 2.75 | 14.4 K |
| 7 K | 4.1% | 0.74 | 2.71 | 2.70 | 14.7 K |
IV Microwave Spectroscopy Results
Well below , most superconducting properties should depend strongly on the quasiparticle excitations near the nodes (or minima) of the gap function. Important signatures of nodal-quasiparticle transport emerge in the frequency dependence of the in-plane microwave conductivity, (,), which is extracted from measurements of . Specifically, at low temperature, the surface resistance is related to the conductivity via the relation: Chang and Scalapino (1989)
| (5) |
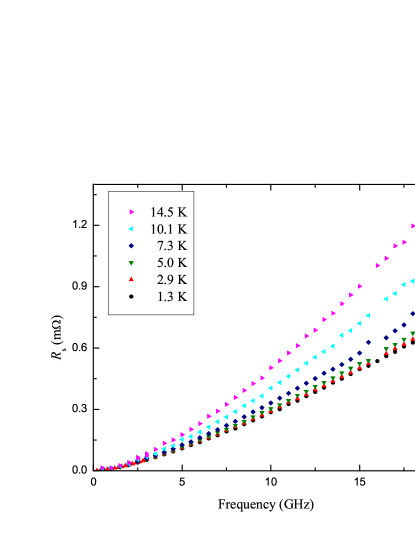
spectra of the two Ba0.72K0.28Fe2As2 samples B and A are shown in Figs. 6 and 7, respectively. There is a significant difference in the low temperature surface resistance between the two samples. At 20 GHz and 3 K, the of the thick sample A is roughly 3.5 times larger than that of the thin sample B. The same is not true, however, at higher temperatures. At 20 GHz and 15 K, the of the two samples are now much closer and differ only by 30%. This could be the result of an extrinsic temperature-independent residual loss (of unknown origin), dominant when the sample itself shows little loss and obscured when the sample loss is sufficiently high.
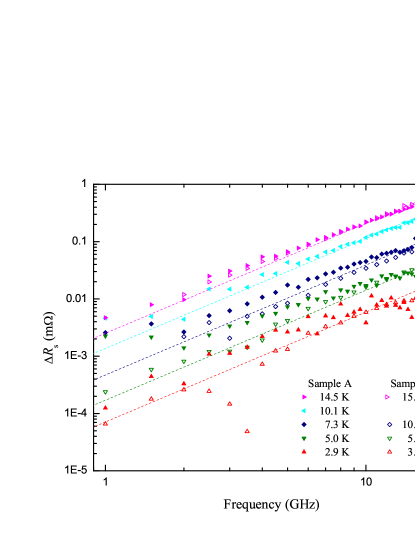
Another indication that the low temperature loss might be extrinsic is that at = 15 K in the lower loss sample, shown in Fig. 6, is proportional to , a result expected if there is sufficient scattering to yield conductivity that is independent of frequency in the microwave range. Elimination of the residual component is performed by subtracting the loss at the lowest measured temperature, a procedure which has been shown to work for -wave superconductors. Turneaure (1967) Doing this reveals that the absolute temperature evolution of is the same for both samples, as highlighted by the plot of = in Fig. 8, supporting the hypothesis of an extrinsic residual loss. Specifically, Fig. 8 demonstrates that the resulting loss after subtraction seems to be intrinsic, in that it has the same temperature and dependence in both samples. Making this subtraction, however, removes the possibility of being able to state whether or not some intrinsic residual resistivity actually does exist.
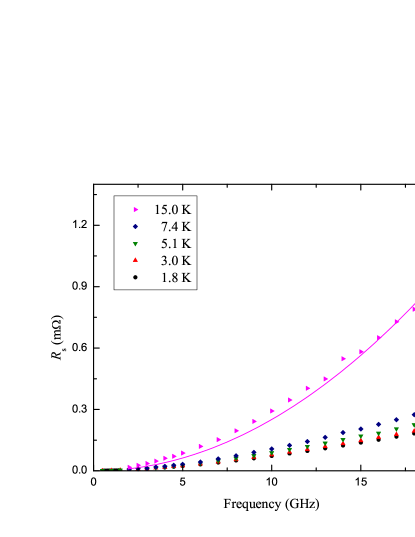
In the Ba0.72K0.28Fe2As2 samples A and B, it is very likely that the K-dopants are the dominant source of quasiparticle scattering. With such a high concentration (28%) of dopants, it is reasonable to expect that the widths of the quasiparticle conductivity spectra lie well outside of our measurement bandwidth. In this case, the in-plane microwave conductivity would appear frequency independent, resulting in the as shown by the lines in Fig. 8.
There exist a number of factors that might account for the observed excess loss in the Ba0.72K0.28Fe2As2 samples, and surface contamination (perhaps a barium oxide layer) seems to be the most likely source. Both samples A and B were cleaved from a larger crystal before they were measured, with one potentially significant difference: while one surface of sample A was cleaved just prior to the start of measurements, the opposite surface had been cleaved weeks earlier allowing for the possibility of enhanced degradation of that surface. Sample B, on the other hand, had both surfaces freshly cleaved immediately before measurements began.
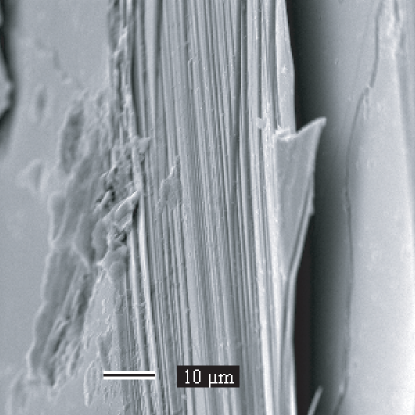
A second possible source of the observed excess loss is the presence of delaminated edges on the samples. Sample edges that resemble the unbound leafy edge of a book present obvious problems for microwave measurements. In the extreme case, the microwave fields would be allowed to penetrate the regions between loosely connected “sheets” of the sample. Currents that loop around the sample are presented with a tortuous path near the edges that increases the effective surface area of the sample. In fact, preliminary measurements of by our group on early samples with obvious edge problems showed a linear temperature dependence that had an unrealistic slope of 200 Å/K, cf. YBCO that has 4 Å/K. Kamal et al. (1998) Scanning electron microscope images, as in Fig 9, have confirmed that some crystals do show signs of delaminated edges with sheets m thick. This effect is therefore suppressed for the thinner Ba0.72K0.28Fe2As2 sample B (and the Ba(Fe0.95Co0.05)2As2 sample C), compared to the thicker sample A, measured in this work. This effect touches upon a slightly different issue than the surface degradation problem mentioned above, since it could affect the data in a multiplicative way, not just additively; however, it is an effect worth noting as yet another reason to work on only very thin and freshly cleaved samples.
It also seems possible that intrinsic -axis contamination was providing the excess loss. However, the thicker sample A was cut into two pieces such that any -axis contribution to the measurements would be enhanced (doubled) but such enhancement was not observed in the measurements.
Despite falling well outside the measurement bandwidth, it is possible to obtain an estimate of the spectral width through the oscillator-strength sum rule. (Our broadband system measures out to /2 = 20 GHz and in this spectral region we find is independent of and therefore no direct measure of the width of the conductivity spectrum can be obtained.) The oscillator-strength sum rule is given by:
| (6) |
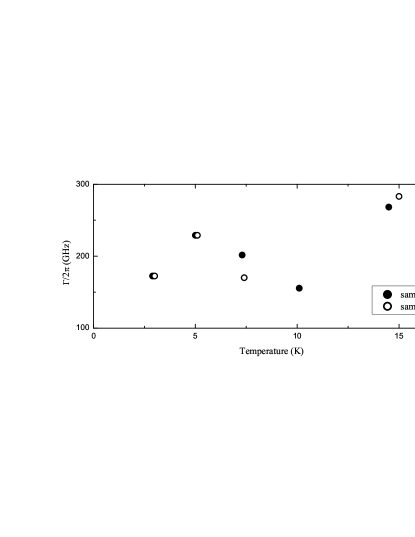
As the temperature is raised, any spectral weight depleted from the superfluid density () must reappear as an increase in the frequency-integrated quasiparticle conductivity. One can approximate the integral on the right-hand side of Eq. 6 to be equal to , and the left-hand side of Eq. 6 is determined by partitioning the conduction electron density into a superfluid density and a normal-fluid density = - 1/, corresponding to quasiparticles thermally excited from the condensate. In so doing, we make use of being the extrapolated value of ( 0) and as a measure of the spectral width of . From this generalized two-fluid model, Berlinsky et al. (1993) the value of (and its temperature dependence) is determined from measurements of the magnetic penetration depth and recalling the definition of the London penetration depth =. The temperature dependence of the spectral widths of samples A and B so determined are shown in Fig. 10. These values of are more than an order of magnitude larger then what has been observed in YBCO Turner et al. (2003) and show no clear temperature dependence; their magnitudes, however, are comparable to the low temperature scattering rates of Bi2Sr2CaCu2O8+δ derived from THz spectroscopy. Bonn and Hrady (1996)
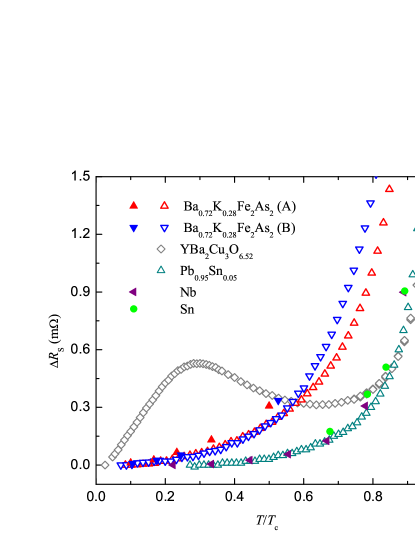
Finally, Fig. 11 shows the temperature dependence of at 13 GHz for a variety of superconductors. For each of the conventional BCS -wave superconductors (Pb0.95Sn0.05, Nb, and Sn), scales as and shows a very weak temperature dependence below . The Ba0.72K0.28Fe2As2 data, on the other hand, shows no signs of flattening and obeys a power law down to the lowest measurement temperature. Fits up to give , which is the temperature dependence expected for a normal fluid density that tracks the loss of superfluid density. Rigorous comparisons to the low- power law fits to the superfluid phase stiffness, however, are not possible because the do not extend to low enough base temperatures and the resolution of the measurement at the lowest temperatures is inadequate. Nevertheless, it is clear that the overall temperature dependence of the surface resistance of the Ba0.72K0.28Fe2As2 samples differs significantly from that of the -wave BCS superconductors.
The surface resistance of ortho-II ordered YBa2Cu3O6.52 (grey open symbols of Fig. 11) shows a low-temperature peak (as does the quasiparticle conductivity). This peak results from a competition between the temperature dependencies of the normal fluid density and of the quasiparticle scattering rates; at lower temperatures it is the reduced normal fluid density which wins out over large scattering rates, while the converse is the case at higher temperatures. Hosseini et al. (1999); Harris et al. (2006) This feature is known to be extremely sensitive to disorder and/or impurities, Bonn et al. (1994) and considering that the spectral width of the quasiparticle conductivity of Ba0.72K0.28Fe2As2 is estimated to be an order of magnitude larger than it is in ortho-II ordered YBa2Cu3O6.52, the absence of a peak in is not surprising, even though there may be a modest decrease in the scattering rate below .
Because the broadband measurements have revealed an excess extrinsic loss in our Ba0.72K0.28Fe2As2 samples, it is not possible to obtain reliable quasiparticle conductivities from our measurements. The exact behavior of necessitates simultaneous measurements of and . Limited to what we can extract, an approximated quasiparticle conductivity, we see no evidence of a coherence peak just below . This is in contrast to what has been previously reported, Hashimoto et al. (2009) but those conclusions were drawn from a broad, nearly 5 K wide enhancement in the quasiparticle conductivity just below in a sample whose superconducting transition temperature width 2.5 K. The behavior of is known to be highly susceptible to inhomogeneity broadening of the superconducting transition. Similar quasiparticle conductivity enhancements below were observed early on in the cuprates Bonn et al. (1993); Holczer et al. (1991) but were later attributed to broadened superconducting transitions. Glass and Hall (1991); Klein et al. (1992); Olsson and Koch (1992) Our samples have 0.5 K and we extract a much narrower, only 0.5 K wide, sharp cusp that can be attributed to superconducting critical fluctuations, rather than evidence of a coherence peak. We do, however, observe the same lower peak associated with the quasiparticle scattering rate.
V Conclusions
We have measured the microwave electrodynamics of single crystal iron-based superconductors Ba0.72K0.28Fe2As2 (hole-doped, 30 K) and Ba(Fe0.95Co0.05)2As2 (electron-doped, 20 K), by cavity perturbation and broadband spectroscopy.
Sample quality and homogeneity were confirmed with a SQUID magnetometer via the width of the superconducting transition as a function of applied field. Penetration depth measurements further confirm that these samples were homogeneously doped, especially when compared with the sharpness of the transitions in other published superfluid measurements, which show a wide range of “feet” above .
Using a 950 MHz loop-gap resonator (with results checked against a 12 kHz ac susceptometer), we were able to measure with sub-angstrom resolution down to 0.4 K. An anomaly in , common to all three samples, occurred at / 0.04. While the source of this feature is not currently understood, we have ruled out contaminants on the sample surface and systematic background signals associated with the experimental apparatus. Four separate mathematical models were fit to the superfluid phase stiffness, extracted from the data, over a temperature range which extends up to 20% of . For the Ba0.72K0.28Fe2As2 samples, the behavior is best described by a power law with . The data was also relatively well-described with a two-gap -wave model, although the fit parameters (, , and ) all systematically increase as the fit range is increased. Moreover, is very small resulting in unbalanced contributions to 1/(0) from the small and large gaps, and the gap values are always smaller than the BCS weak-coupling result: 2/k 3.5. These are perhaps all indications that the -wave two-gap scenario is not the correct picture for the 122-pnictides. Alternatively, if interband coupling is strong, a multiple gap scenario could persist, however it may not then be appropriate to treat the gaps independently. For the Ba(Fe0.95Co0.05)2As2 sample, both the power law and the two-gap -wave models seemed to work equally well. None of the data is very well-described with a fit.
We have also taken broadband surface resistance measurements, from 1-20 GHz, which reveal a sample dependent residual loss in the Ba0.72K0.28Fe2As2 samples whose origin is unclear. An additive extrinsic loss is posited, from which an underlying intrinsic behavior common to both samples can be recovered by subtracting the lowest temperature measure of (). In so doing, both Ba0.72K0.28Fe2As2 samples follow a nearly trend. The direct implication is that the quasiparticle conductivity is frequency independent up to our highest frequency of 20 GHz. This is consistent with our estimates of the quasiparticle scattering rates which are in the range of 150 - 270 GHz, much higher than those seen in YBCO but comparable to the rates observed in BSSCO.
VI Acknowledgments
The work done at the University of British Columbia was funded by the Natural Sciences and Engineering Research Council of Canada and the Canadian Institute for Advanced Research. The work done at the National Laboratory for Superconductivity was supported by the Natural Science Foundation of China, the Ministry of Science and Technology of China (No. 2006CB601000, No. 2006CB921802), and the Chinese Academy of Sciences.
References
- Kamihara et al. (2008) Y. Kamihara, T. Watanabe, M. Hirano, and H. Hosono, J. Am. Chem. Soc., 130, 3296 (2008).
- Nagamatsu et al. (2001) J. Nagamatsu, N. Nakagawa, T. Muranaka, Y. Zenitani, and J. Akimitsu, Nature, 410, 63 (2001).
- Rotter et al. (2008) M. Rotter, M. Tegel, D. Johrendt, I. Schellenberg, W. Hermes, and R. Pöttgen, Phys. Rev. B, 78, 020503 (2008a).
- Ni et al. (2008) N. Ni, M. E. Tillman, J.-Q. Yan, A. Kracher, S. T. Hannahs, S. L. Bud ko, and P. C. Canfield, Phys. Rev. B, 78, 214515 (2008).
- Keene et al. (1987) M. N. Keene, J. T. Jackson, and C. E. Gough, Nature, 326, 855 (1987).
- Wollman et al. (1993) D. A. Wollman, D. J. Van Harlingen, W. C. Lee, D. M. Ginsberg, and A. J. Leggett, Phys. Rev. Lett., 71, 2134 (1993).
- Tsuei et al. (1994) C. C. Tsuei, J. R. Kirtley, C. C. Chi, L. S. Yu-Jahnes, A. Gupta, T. Shaw, J. Z. Sun, and M. B. Ketchen, Phys. Rev., 73, 593 (1994).
- Giaver (1960) I. Giaver, Phys. Rev. Lett., 5, 147 (1960).
- Ginsberg and Tinkham (1960) D. M. Ginsberg and M. Tinkham, Phys. Rev., 118, 990 (1960).
- Richards and Tinkham (1960) P. L. Richards and M. Tinkham, Phys. Rev., 119, 575 (1960).
- Turneaure and Weissman (1968) J. P. Turneaure and I. Weissman, J. Appl. Phys., 39, 4417 (1968).
- Shen et al. (1993) Z.-X. Shen, D. S. Dessau, B. O. Wells, D. M. King, W. E. Spicer, A. J. Arko, D. Marshall, L. W. Lombardo, A. Kapitulnik, P. Dickinson, S. Doniach, J. DiCarlo, A. G. Loeser, and C. H. Park, Phys. Rev. Lett., 70, 1553 (1993).
- Ding et al. (1996) H. Ding, M. R. Norman, J. C. Campuzano, M. Randeria, A. F. Bellman, T. Yokoya, T. Takahashi, T. Mochiku, and K. Kadowaki, Phys. Rev. B, 54, R9678 (1996).
- Corak et al. (1956) W. S. Corak, B. B. Goodman, C. B. Satterthwaite, and A. Wexler, Phys. Rev., 102, 656 (1956).
- Corak and Satterthwaite (1956) W. S. Corak and C. B. Satterthwaite, Phys. Rev., 102, 656 (1956).
- Turneaure (1967) J. P. Turneaure, Microwave measurements of the surface impedance of superconducting tin and lead, Ph.D. thesis, Stanford University (1967).
- Halbritter (1970) J. Halbritter, Z. Phys., 238, 466 (1970).
- Hardy et al. (1993) W. N. Hardy, D. A. Bonn, D. C. Morgan, R. Liang, and K. Zhang, Phys. Rev. Lett., 70, 3999 (1993).
- Hirschfeld and Goldenfeld (1993) P. J. Hirschfeld and N. D. Goldenfeld, Phys. Rev. B, 48, 4219 (1993).
- Kokales et al. (2000) J. D. Kokales, P. Fournier, L. V. Mercaldo, V. V. Talanov, R. L. Greene, and S. M. Anlage, Phys. Rev. Lett., 85, 3696 (2000).
- Rotter et al. (2008) M. Rotter, M. Tegel, and D. Johrendt, Phys. Rev. Lett., 101, 107006 (2008b).
- Barzykin and Gorko’kov (2008) V. Barzykin and L. P. Gorko’kov, JETP Lett., 88, 131 (2008).
- Cvetkovic and Tesanovic (2009) V. Cvetkovic and Z. Tesanovic, Eur. Phys. Lett., 85, 37002 (2009).
- Liu et al. (2008) C. Liu, G. D. Samolyuk, Y. Lee, N. Ni, T. Kondo, A. F. Santander-Syro, S. L. Bud’ko, J. L. McChesney, E. Rotenberg, T. Valla, A. V. Fedorov, P. C. Canfield, B. N. Harmon, and A. Kaminski, Phys. Rev. Lett., 101, 177005 (2008).
- Evtushinsky et al. (2009) D. V. Evtushinsky, D. S. Inosov, V. B. Zabolotnyy, A. Koitzsch, M. Knupfer, B. Buchner, M. S. Viazovska, G. L. Sun, V. Hinkov, A. V. Boris, C. T. Lin, B. Keimer, A. Varykhalov, A. A. Kordyuk, and S. V. Borisenko, Phys. Rev. B, 79, 054517 (2009).
- Ding et al. (2008) H. Ding, P. Richard, K. Nakayama, K. Sugawara, T. Arakane, Y. Sekiba, A. Takayama, S. Souma, T. Sato, T. Takahashi, Z. Wang, X. Dai, Z. Fang, G. F. Chen, L. J. L., and N. L. Wang, Eur. Phys. Lett., 83, 47001 (2008).
- Zhao et al. (2008) L. Zhao, H.-Y. Liu, W.-T. Zhang, J.-Q. Meng, J. X.-W., G.-D. Liu, X.-L. Dong, G.-F. Chen, J.-L. Luo, N.-L. Wang, W. Lu, G.-L. Wang, Y. Zhou, Y. Zhu, X.-Y. Wang, Z.-Y. Xu, C.-T. Chen, and X.-J. Zhou, Chin. Phys. Lett., 25, 4402 (2008).
- Nakayama et al. (2009) K. Nakayama, T. Sato, P. Richard, Y.-M. Xu, Y. Sekiba, S. Souma, G. F. Chen, J. L. Luo, N. L. Wang, H. Ding, and T. Takahashi, Eur. Phys. Lett., 85, 67002 (2009).
- Szabó et al. (2009) P. Szabó, Z. Pribulová, G. Pristáš, S. L. Bud’ko, P. C. Canfield, and P. Samuely, Phys. Rev. B, 79, 012503 (2009).
- Hashimoto et al. (2009) K. Hashimoto, T. Shibauchi, S. Kasahara, K. Ikada, S. Tonegawa, T. Kato, R. Okazaki, C. J. van der Beek, M. Konczykowski, H. Takeya, K. Hirata, T. Terashima, and Y. Matsuda, Phys. Rev. Lett., 102, 207001 (2009).
- Salem-Sugui Jr. et al. (2009) S. Salem-Sugui Jr., L. Ghivelder, A. D. Alvarenga, J. L. Pimentel, H. Q. Luo, Z. Wang, and H.-H. Wen, Phys. Rev. B, 80, 014518 (2009).
- (32) J. G. Checkelsky, L. Li, G. F. Chen, J. L. Luo, N. L. Wang, and N. P. Ong, ArXiv:0811.4668 (2008).
- Fukazawa et al. (2009) H. Fukazawa, T. Yamazaki, K. Kondo, Y. Kohori, N. Takeshita, P. M. Shirage, K. Kihou, K. Miyazawa, H. Kito, H. Eisaki, and A. Iyo, J. Phys. Soc. Jpn., 78, 033704 (2009).
- Goko et al. (2009) T. Goko, A. A. Aczel, E. Baggio-Saitovitch, S. L. Bud’ko, P. C. Canfield, J. P. Carlo, G. F. Chen, P. Dai, A. C. Hamann, W. Z. Hu, H. Kageyama, G. M. Luke, J. L. Luo, B. Nachumi, N. Ni, D. Reznik, D. R. Sanchez-Candela, A. T. Savici, K. J. Sikes, N. L. Wang, C. R. Wiebe, T. J. Williams, T. Yamamoto, W. Yu, and Y. J. Uemura, Phys. Rev. B, 80, 024508 (2009).
- Dong et al. (2010) J. K. Dong, S. Y. Zhou, T. Y. Guan, X. Qiu, C. Zhang, P. Cheng, L. Fang, H. H. Wen, and S. Y. Li, Phys. Rev. B, 81, 094520 (2010).
- Gordon et al. (2009) R. T. Gordon, C. Martin, H. Kim, N. Ni, M. A. Tanatar, J. Schmalian, I. I. Mazin, S. L. Bud’ko, P. C. Canfield, and R. Prozorov, Phys. Rev. B, 79, 100506(R) (2009).
- Luo et al. (2008) H. Q. Luo, Z. S. Wang, H. Yang, P. Cheng, X. Y. Zhu, and H.-H. Wen, Supercond. Sci. Technol., 21, 125014 (2008).
- Mu et al. (2009) G. Mu, H. Luo, Z. S. Wang, L. Shan, C. Ren, and H.-H. Wen, Phys. Rev. B, 79, 174501 (2009).
- Turner et al. (2004) P. J. Turner, D. M. Broun, S. Kamal, M. E. Hayden, J. S. Bobowski, R. Harris, D. C. Morgan, J. S. Preston, D. A. Bonn, and W. N. Hardy, Rev. Sci. Instrum., 75, 124 (2004).
- Hosseini et al. (1999) A. Hosseini, R. Harris, S. Kamal, P. Dosanjh, J. Preston, R. Liang, W. N. Hardy, and D. A. Bonn, Phys. Rev. B, 60, 1349 (1999).
- Bidinosti and Hardy (2000) C. P. Bidinosti and W. N. Hardy, Rev. Sci. Instrum., 71, 3816 (2000).
- Chen et al. (2009) H. Chen, Y. Ren, Y. Qiu, W. Bao, R. H. Liu, G. Wu, T. Wu, Y. L. Xie, X. F. Wang, Q. Huang, and X. H. Chen, Euro. Phys. Lett., 85, 17006 (2009).
- Chu et al. (2009) J.-H. Chu, J. G. Analytis, C. Kucharczyk, and I. R. Fisher, Phys. Rev. B, 79, 014506 (2009).
- Li et al. (2008) G. Li, W. Z. Hu, J. Dong, Z. Li, P. Zheng, G. F. Chen, J. L. Luo, and N. L. Wang, Phys. Rev. Lett., 101, 107004 (2008).
- Kamal et al. (1998) S. Kamal, R. Liang, A. Hosseini, D. A. Bonn, and W. N. Hardy, Phys. Rev. B, 58, R8933 (1998).
- Prozorov et al. (2009) R. Prozorov, M. A. Tanatar, R. T. Gordon, C. Martin, H. Kim, V. G. Kogan, N. Ni, M. E. Tillman, S. L. Bud’ko, and P. C. Canfield, Physica C, 469, 582 (2009).
- Martin et al. (2009) C. Martin, R. T. Gordon, M. A. Tanatar, H. Kim, N. Ni, S. L. Bud’ko, P. C. Canfield, H. Luo, H. H. Wen, Z. Wang, A. B. Vorontsov, V. G. Kogan, and R. Prozorov, Phys. Rev. B, 80, 020501 (2009).
- Mühlschlegel (1959) B. Mühlschlegel, Z. Phys., 155, 313 (1959).
- Lee and Lemberger (1993) J. Lee and T. R. Lemberger, Appl. Phys. Lett., 62, 2419 (1993).
- Bonn et al. (1993) D. A. Bonn, R. Liang, T. M. Riseman, D. J. Baar, D. C. Morgan, K. Zhang, P. Dosanjh, T. L. Duty, A. MacFarlane, G. D. Morris, J. H. Brewer, W. N. Hardy, C. Kallin, and A. J. Berlinsky, Phys. Rev. B, 47, 11314 (1993).
- Bang et al. (2009) Y. Bang, H. Y. Choi, and H. Won, Phys. Rev. B, 79, 054529 (2009’).
- Kim et al. (2002) M.-S. Kim, J. A. Skinta, T. R. Lemberger, W. N. Kang, H.-J. Kim, E. M. Choi, and S.-I. Lee, Phys. Rev. B, 66, 064511 (2002).
- Chang and Scalapino (1989) J.-J. Chang and D. J. Scalapino, Phys. Rev. B, 40, 4299 (1989).
- Berlinsky et al. (1993) A. J. Berlinsky, C. Kallin, G. Rose, and A. C. Shi, Phys. Rev. B, 48, 4074 (1993).
- Turner et al. (2003) P. J. Turner, R. Harris, S. Kamal, M. E. Hayden, D. M. Broun, D. C. Morgan, A. Hosseini, P. Dosanjh, G. K. Mullins, J. S. Preston, R. Liang, D. A. Bonn, and W. N. Hardy, Phys. Rev. Lett., 90, 237005 (2003).
- Bonn and Hrady (1996) D. A. Bonn and W. N. Hrady, Physical Properties of High Temperature Superconductors, edited by D. M. Ginsberg (World Scientific, 1996).
- Harris et al. (2006) R. Harris, P. J. Turner, S. Kamal, A. R. Hosseini, P. Dosanjh, G. K. Mullins, J. S. Bobowski, C. P. Bidinosti, D. M. Broun, R. Liang, W. N. Hardy, and D. A. Bonn, Phys. Rev. B, 74, 104508 (2006).
- Bonn et al. (1994) D. A. Bonn, S. Kamal, K. Zhang, R. Liang, D. J. Baar, E. Klein, and W. N. Hardy, Phys. Rev. B, 50, 4051 (1994).
- Holczer et al. (1991) K. Holczer, L. Forro, L. Mihály, and G. Grüner, Phys. Rev. Lett., 67, 152 (1991).
- Glass and Hall (1991) N. E. Glass and W. F. Hall, Phys. Rev. B, 44, 4495 (1991).
- Klein et al. (1992) O. Klein, K. Holczer, and G. Grüner, Phys. Rev. Lett., 68, 2407 (1992).
- Olsson and Koch (1992) H. K. Olsson and R. H. Koch, Phys. Rev. Lett., 68, 2406 (1992).