Keck/LRIS Spectroscopic Confirmation of Coma Cluster Dwarf Galaxy Membership Assignments
Abstract
Keck/LRIS multi-object spectroscopy has been carried out on 140 of some of the lowest and highest surface brightness faint () dwarf galaxy candidates in the core region of the Coma Cluster. These spectra are used to measure redshifts and establish membership for these faint dwarf populations. The primary goal of the low surface brightness sample is to test our ability to use morphological and surface brightness criteria to distinguish between Coma Cluster members and background galaxies using high resolution HST/ACS images. Candidates were rated as expected members, uncertain, or expected background. From 93 spectra, 51 dwarf galaxy members and 20 background galaxies are identified. Our morphological membership estimation success rate is % for objects expected to be members and better than % for galaxies expected to be in the background. We confirm that low surface brightness is a very good indicator of cluster membership. High surface brightness galaxies are almost always background with confusion arising only from the cases of the rare compact elliptical galaxies. The more problematic cases occur at intermediate surface brightness. Many of these galaxies are given uncertain membership ratings, and these were found to be members about half of the time. Including color information will improve membership determination but will fail for some of the same objects that are already mis-identified when using only surface brightness and morphology criteria. Compact elliptical galaxies with colors magnitudes redward of the red sequence in particular require spectroscopic follow-up. In a sample of 47 high surface brightness, ultra compact dwarf candidates, 19 objects have redshifts which place them in the Coma Cluster, while another 6 have questionable redshift measurements but may also prove to be members. Redshift measurements are presented and the use of indirect means for establishing cluster membership is discussed.
1 Introduction
In order to study the dwarf galaxy population of clusters, cluster membership must first be unambiguously determined. Only in the Local and other very nearby groups, such as M81, can membership be determined directly for all potential members. Few rich galaxy clusters are close enough for a complete census. Historically, astronomers have assigned membership probability based on indirect means such as colors or morphology, or have resorted to statistical methods for estimating membership. The latter method estimates the number of galaxies belonging to a cluster by correcting the total galaxy counts in a cluster region for the expected background population based on galaxy counts in nearby or blank regions of the sky. This statistical method may be the least secure as it assumes nearby regions on the sky to have the same background structure as the cluster area, yet it is known that structure is not homogeneous and that counts can vary by % on scales of deg (Hradecky et al., 2000; Lopez-Cruz, 1997). The situation may be worse around rich galaxy clusters which are found at the intersections of filaments where the true background population may be significantly larger than in nearby less dense regions of sky. The statistical method therefore not only introduces large uncertainties due to field-to-field variance, but may suffer from significant systematic bias as well. It is expected that the use of colors and morphology will do a better job, but this needs to be tested through direct means. It is prohibitively time consuming to obtain sufficiently high S/N spectra to measure redshifts for every galaxy in a cluster region down to the regime of the abundant faint dwarf galaxy population, and impossible with our current technology to measure redshifts of the faintest and lowest surface brightness objects. We can, however, observe a subsample of spectra to test memberships determined from indirect methods such as surface brightness, morphology, and color criteria.
Using morphological criteria to establish membership involves weeding out objects with structure resembling that of background late type galaxies, and using surface brightness, scale length, and morphological class to constrain the remainder. It is expected that most cluster galaxies are quiescent early-type galaxies that have relatively lower surface brightness as compared to background objects. In rich galaxy clusters, the dwarf ellipticals form the dominant population at low luminosities. These galaxies have smooth low surface brightness profiles and relatively large sizes compared to background galaxies with similar apparent magnitudes (e.g. Caldwell & Bothun, 1987; Impey et al., 1988; Ferguson & Sandage, 1988). Thus, at faint magnitudes, it is expected that cluster dwarf galaxies can be distinguished from background galaxies by such properties as surface brightness and size. However, there is always the possibility that these criteria could fail if, for example, there existed a large population of very compact objects (e.g. compact dEs and UCDs) which reside within the cluster but are indistinguishable, morphologically, from background spheroidals or foreground stars, or if there existed a large population of giant low surface brightness galaxies in the cluster background. Such possibilities can be tested with spectroscopic samples.
This work is part of the HST/ACS Coma Cluster Treasury Survey (Carter et al., 2008), a two-passband imaging survey originally designed to cover 740 arcmin2 in the Coma Cluster to a depth of for point sources and mag arcsec-2 for extended sources. Over 200 arcmin2 have been completed. The Coma Cluster was chosen because it is the densest, richest cluster of galaxies at high galactic latitude within 100 Mpc and will provide the local and current analog of rich clusters seen at higher redshift. In addition, much progress has already been made towards understanding the cluster dynamics and galaxy properties of this rich cluster. The HST/ACS survey provides a database of high spatial resolution images with the overall goals to study the structure, stellar populations, and morphologies of, and environmental effects on, the cluster dwarf galaxy population to a regime fainter than could be explored before. Specifically, we are using the ACS data to study e.g. the faint end of the cluster galaxy luminosity function (Trentham et al. in prep), structural parameters of dwarf galaxies (Hoyos et al. in prep), stellar populations (Smith et al., 2008), the nature of compact and ultra compact dwarf galaxies (Price et al., 2009, Chiboucas et al. in prep), and globular cluster systems (Puzia et al. in prep, Peng (2010)). This study will moreover provide the local rich cluster benchmark for various scaling relations.
The high quality ACS data are used to study structural, photometric, and morphological properties of the cluster members. However, cluster members must first be identified. Several members of the team have therefore made use of morphological, surface brightness, and size criteria to assign a membership probability to each object in our ACS images. As a follow-up to this ACS imaging survey, we are therefore establishing membership for faint dwarf galaxies through spectroscopy for a subset of objects suspected of being cluster members. A separate MMT/Hectospec campaign has measured redshifts for over 8700 galaxies down to , where it is % complete for the ACS surveyed region. We are using Keck/LRIS to obtain spectra of even fainter galaxies (), targeting both the low and high surface brightness segments of the dwarf population.
Galaxies at the faint end of the luminosity function tend to be low surface brightness (LSB) dwarf ellipticals (Trentham et al., 2001; Ferguson & Binggeli, 1994). To test our membership assignments which follow from that assumption, we have observed samples of both low surface brightness faint galaxies expected to be members and higher surface brightness galaxies expected to lie in the background. We target the central core of the Coma Cluster where we have obtained high resolution HST/ACS imaging and have completed morphological estimates for membership.
At the very high surface brightness end of the spectrum lie the ultra compact dwarfs (UCDs). First discovered in spectroscopic studies of the Fornax cluster, including an all-object spectroscopic survey by Drinkwater et al. (2000), significant UCD populations have now been established to exist in the Fornax, Virgo, and Centaurus clusters (Hilker et al., 1999; Drinkwater et al., 2004; Firth et al., 2008; Jones et al., 2006; Haşegan et al., 2005; Mieske et al., 2007a, 2009) while candidate UCDs have been identified in the Hydra, A1689, AS0740, and Coma Clusters and the NGC 1023 group (Wehner & Harris, 2007; Mieske et al., 2004b; Blakeslee & Barber DeGraaff, 2008; Adami et al., 2009; Mieske et al., 2007b).
UCDs have magnitudes in the range and are extremely compact, with physical sizes ranging from pc (Mieske et al., 2007a; Jones et al., 2006; Mieske et al., 2008). In the Coma Cluster, this range corresponds to angular sizes of arcsec. Coma UCDs are therefore unresolved in typical ground-based imaging, and only the largest can be resolved with HST/ACS. With high surface brightness and low luminosities, they are well distinguished from the magnitude - surface brightness relation of ”typical” dwarf galaxies. UCDs also tend to be redder than the dE red sequence by magnitudes. This property is likely driven by high metallicities (Mieske et al., 2006; Chilingarian et al., 2008). The origin of these enigmatic objects is not clear. They may be the visible nuclei of extremely low surface brightness dwarf galaxies or they may constitute a population of remnant nuclei formed from ”threshing” of nucleated dwarf ellipticals via tidal encounters with giant galaxies (Phillipps et al., 2001; Bekki et al., 2003; Haşegan et al., 2005). Alternatively, they may make up a bright tail of the globular cluster luminosity function or they may have formed as mergers of young massive star clusters themselves formed during galaxy mergers (Drinkwater et al., 2000; Fellhauer & Kroupa, 2002; Chilingarian et al., 2008). The population size, spatial distribution, and intrinsic properties of this object class, should UCDs exist within the Coma Cluster, will provide critical new clues for understanding the formation mechanisms of these unusual objects, and expand our understanding of the full dwarf galaxy population.
In Section 2 we detail the target selection, observations, and data reduction. We provide results of the spectroscopic study in Section 3 including the success rates for using indirect means to estimate cluster membership. In Section 4 we discuss these results and in Section 5 we provide a summary and conclusions. Throughout this paper, we assume a distance to the Coma Cluster of 100 Mpc and a distance modulus (see Carter et al., 2008, Table 1).
2 Observations and Data Reduction
2.1 Target Selection
Our survey of faint dwarf galaxies in the Coma Cluster was divided into the two surface brightness samples each with a slightly different science objective. For the LSB sample the goal is to use redshift measurements to test our ability to correctly determine membership for Coma Cluster galaxies through indirect means. This test provides statistical probabilities for dwarf galaxy cluster membership, which are needed to constrain the poorly known faint-end slope of the LF and to enable dwarf population studies at the very faint regime. The goal of the high surface brightness sample is to investigate whether the Coma Cluster hosts a population of UCDs.
Prior to our initial observing run, redshifts existed for all galaxies in the Coma region with and for almost all expected members to . An ongoing MMT/Hectospec campaign has been targeting all galaxies with . Our plan was to take spectroscopic observations magnitudes deeper. Our low surface brightness targets were therefore chosen within the magnitude range , and with central surface brightnesses . band photometry was taken from the catalog of Adami et al. (2006). At high surface brightness, we targeted objects to .
2.1.1 Morphological Membership Assessment
Indirect means are required to establish membership at faint magnitudes where galaxy counts become too large for comprehensive spectroscopic coverage. We therefore use known and expected morphological and structural properties of the cluster population in order to distinguish between background and cluster galaxies in our high resolution ACS imaging. This method has been used previously for studies of other nearby galaxy groups and clusters. One of the historically more prominent uses was the assembly of the Virgo Cluster Catalog using primarily morphological means (Binggeli et al., 1985). Morphological classification of galaxies in this region was performed by Sandage & Binggeli (1984) who define the classification scheme and supply a reference set of examples to serve as templates. Cluster membership was then determined primarily based on the morphological classification for each galaxy. More recently, this method has been used to assign membership to nearby group and cluster galaxies in order to construct the galaxy luminosity functions (Trentham et al., 2001; Trentham & Tully, 2002; Mahdavi et al., 2005). These studies used a very similar method as this work to assign membership to groups times closer with times lower spatial resolution from ground-based imaging.
The majority of faint galaxies imaged within a field of even a rich galaxy cluster will be background galaxies. Faint cluster members are the dwarf galaxies, and within a rich cluster, the great majority of these will be of the early type dE class. Both dwarf elliptical and dwarf irregular galaxies follow a well defined magnitude - surface brightness relation where surface brightness decreases with magnitude such that the physical radius of the galaxy remains nearly constant (e.g. Caldwell & Bothun, 1987; Binggeli & Cameron, 1991; Binggeli, 1994; Mieske et al., 2004a; Boselli et al., 2008). Thus, at a given apparent magnitude, dwarf cluster members are expected to be of lower surface brightness and to have larger sizes than the majority of background galaxies. The dwarf members are also expected to have roughly similar sizes. Furthermore, late type field background galaxies can be distinguished based on morphological and structural properties. The presence of features such as spiral arms, dust lanes, evidence for tidal disruption, flat edge-on disks, central bulges, major bars, etc. are all good indicators for late type morphology more likely to be associated with intrinsically high luminosity background galaxies than intrinsically low luminosity dwarf members.
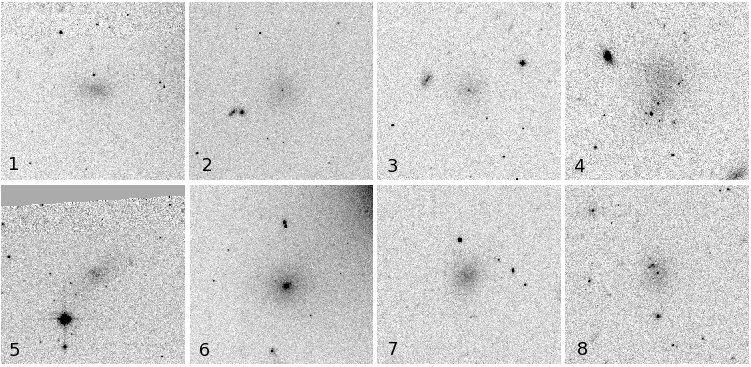
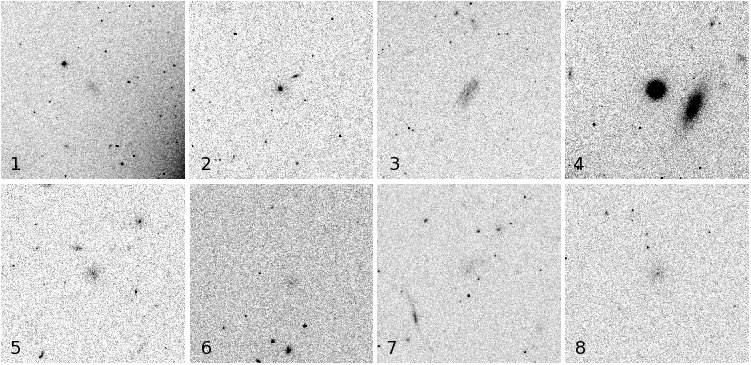
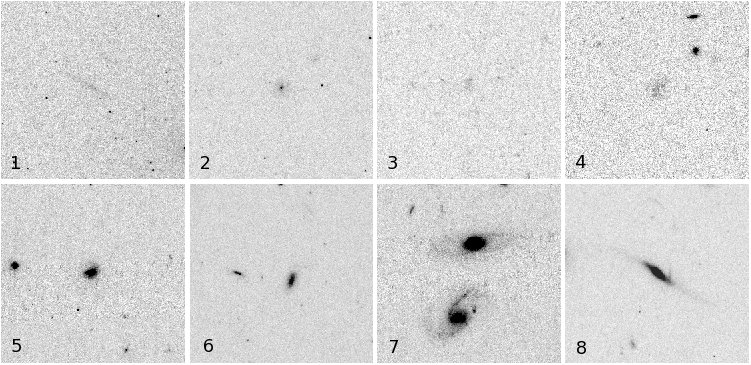
All ACS images from our survey were visually inspected by two of the authors (NT and HF) who closely followed the Sandage & Binggeli (1984) prescription for galaxy classification. Galaxies in the Coma Cluster fields were then placed into 4 membership categories based on the following considerations. Objects at that are compact and/or have spiral or other obvious structure indicative of intrinsically luminous galaxies were assumed to lie in the background. From the magnitude - surface brightness relation, faint members are expected to have low surface brightness and relatively large sizes in comparison with the abundant background galaxies of similar apparent magnitude. These mostly featureless diffuse LSB galaxies are assigned to the dE class and are assumed to be members. LSB galaxies with small central nuclei are morphologically assigned to be of the dE,N class and can also be identified as members with relative certainty. Besides the obvious members and background galaxies there will be some cases where the membership cannot be unambiguously determined based on morphological grounds alone. The following probability ranking scheme, described further in Trentham et al. (in prep), was then used to assign a membership likelihood to each galaxy:
- 1:
-
Expected member
- 2:
-
Probable member
- 3:
-
Possible member
- 4:
-
Expected background
Examples from each class are shown in Figures 1 - 3. We cannot provide a specific recipe for assigning memberships. This rating scheme is subjective and therefore not perfectly reproducible. However, it is expected that a human can be trained through experience looking at many images in different contexts to morphologically classify galaxies and reliably pick out members from qualitative determinations better than any devised algorithm. Both authors here have significant experience with this technique. Given previous success using this method to determine membership for nearby group and cluster members, it is expected that this method will have good success in assigning membership for the more distant Coma Cluster galaxies (100 Mpc) using high resolution HST/ACS images. We test this hypothesis in this paper.
To test the reliability of these membership assignments, we chose samples from each of the 4 membership classes for follow-up spectroscopy. We weighted all possible targets based on membership probability, giving higher weights to those galaxies considered likely and probable members (ranking 1-2), a lower weighting for those considered possible members (3), and the lowest weighting for those considered background (4). These weights were used strictly in the LRIS mask making software, Autoslit3, and were implemented primarily to obtain roughly equal numbers of each category in the final masks, since total numbers of objects increased inversely with membership likelihood. In the end, objects were chosen from each of the membership classes. In order to ensure that the majority of spectra were of high enough S/N to measure redshifts, we also gave slightly greater weight to those objects with higher surface brightness. While this is a selection bias, the main goal was to obtain high enough S/N for as many targets as possible from which to extract secure redshift measurements. The sample for which we successfully measured redshifts has a large enough range to investigate any possible bias or trend as a function of surface brightness. We discuss this further in Section 4.
2.1.2 UCD Candidate Selection
The second goal of our spectroscopic survey was to search for the existence of a UCD population within the dynamically evolved Coma Cluster. UCDs are extremely compact and faint objects having apparent magnitudes at the distance of Coma in the range , colors up to 0.2 magnitudes redder than the red sequence, and half-light radii corresponding to arcsec. In ground-based surveys, these objects are not resolved, but with the resolution of ACS the larger ones are just resolved. It is therefore challenging, even with HST imaging, to distinguish these near point sources from foreground stars.
To choose a sample of UCD candidates, we first identified point sources in the catalog of Adami et al. (2006) based on their large ground-based CFHT/CFH12K survey. We then imposed the following criteria:
-
1.
( aperture mags)
-
2.
( apertures)
-
3.
Higher priority to sources with
-
4.
Located in regions with processed ACS images (available before 2007 February)
-
5.
Gave highest weight to sources showing any sign of having profiles broader than stellar in our ACS images.
This last point biases the sample to larger objects although unresolved sources were included in the target list as well. The () range includes the Fornax/Virgo UCDs at the blue end and compact ellipticals (cEs) at the red end. In part because of potentially large photometric errors at these faint magnitudes, we refrained from making our color cut too restrictive. The final list contains 165 UCD candidates. The weights were implemented by the Autoslit3 mask making software for choosing targets.
2.2 Observations
The spectroscopic setup was intended to maximize light throughput at the expense of resolution. As we only need to establish cluster membership for these galaxies, and the Coma Cluster has a velocity dispersion of km/s, a resolution of 200 km/s is adequate. The spectral range was chosen to include the Ca H and K lines and Balmer break at the blue end (Å at the redshift of Coma) and the Ca triplet at the red end (around 8600Å). Because the most critical spectral features for redshift measurements of low redshift, faint galaxies are the Ca H & K lines and Balmer break, we require high sensitivity in the blue.
In order to attain these specifications, we use the Keck LRIS low resolution imaging spectrometer (Oke et al., 1995) in multi-object spectroscopy mode. A dichroic was used to split light at 5600Å between red and blue detectors. On the blue-side, we used the 400 line mm-1 grism blazed at 3400Å providing a dispersion of 1.09Å pix-1 and wavelength coverage of 4384Å. With 1.2 arcsec slitlets, we achieved a resolution of 7.8Å FWHM. On the red-side we chose the 400 line mm-1 grating blazed at 8500Å with wavelength coverage 3950Å and 1.92Å pix-1 dispersion. These provide peak efficiencies of 50% at 3900Å and over 40% at 7000Å, along with the intended full wavelength coverage.
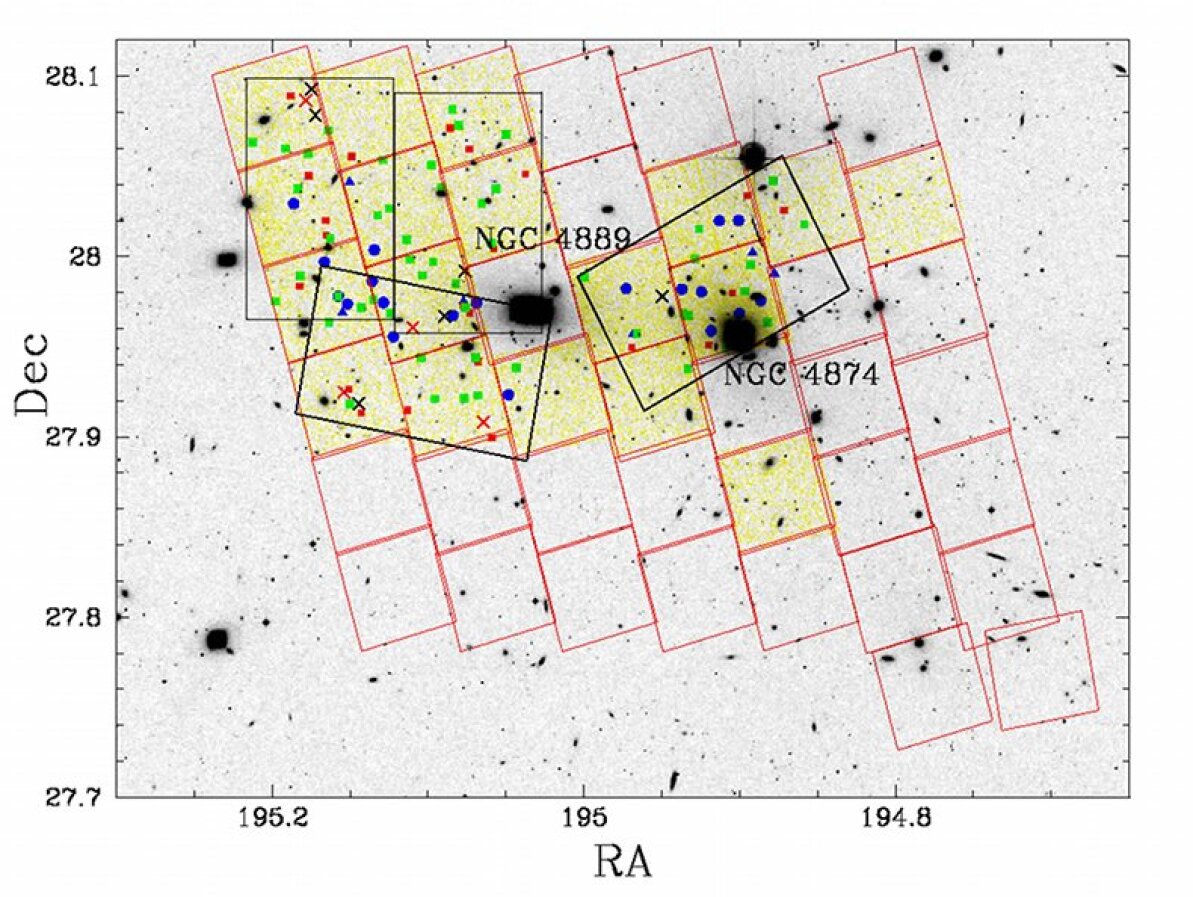
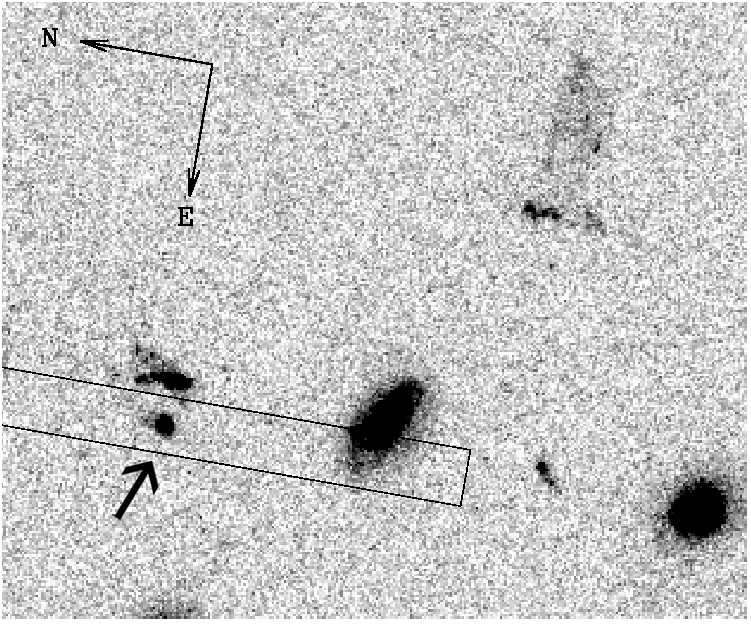
We observed 4 masks over 2 nights 2-3 April 2008. Details of these observations are provided in Table 1. Each MOS mask covers a field of view of . Total integrations for each mask were s with the exception of the blue side of the 3rd mask for which we only obtained s. The masks covered 4 separate fields with only slight overlap (4 objects were observed in 2 masks each), and nearly cover the full core region with completed ACS imaging. A total of 140 objects were targeted with the 4 LRIS masks for an average of 35 slitlets per mask. These included 20 expected background galaxies (membership probability 4), 73 low surface brightness probable/potential cluster members (membership probabilities 1-3), and 47 UCD candidates. In Figure 4, we overlay the locations of the 4 LRIS fields on an image of the central Coma Cluster region. Red boxes designate the originally proposed locations for the ACS imaging; those highlighted in yellow have been completed. The locations of targets are also shown.
A subsequent observing run in 2009 focused on the continuation of our UCD search. UCD discoveries will be presented in a future paper. However we did measure redshifts for two new LSB members. We include these measurements in Table 2, but as these two objects are not statistically relevant to the discussion in this paper, we do not discuss them further.
Calibration arc lamps were observed each evening and sky lines were used to determine observational shifts. Dome and halogen lamp flats were also observed daily. The signal-to-noise per Angstrom for the galaxy spectra ranges from to less than 1. The brightest high surface brightness objects had S/N (around 5000Å) . Typical S/N for the low surface brightness dwarfs for which we were able to measure redshifts ranged from around 5000Å. For the UCD sample, membership was established for targets having S/N while less secure redshifts were derived from spectra with S/N .
2.3 Data Reduction
Data were reduced using the standard procedures in IRAF. We first overscan/bias corrected the images using tasks lccdproc/lrisbias. For the blue-side data, 2 CCD chips read out with 4 amplifiers were corrected for different gains and tiled into a single image. Data on the red-side were likewise corrected for 2-amp readout. Halogen flats for each mask were combined and a normalized flat image was generated with apflatten. Science MOS images were divided by this flat, and the 8 individual exposures for each mask were subsequently median combined using sigma clipping after first fixing bad columns.
Slit spectra were rectified by first tracing the slit gaps for each mask and fitting these with 4th order legendre polynomials. geomap was run to compute the 2D surface for the full set of slit gaps in a mask and geotran was then run to generate images with straightened slits using that transformation. Once this operation was completed, individual 2-D spectra were cut out. Arc spectra were rectified and extracted for each slitlet in the same manner.
We ran the IRAF tasks identify (reidentify) and fitcoord to wavelength calibrate the lamp spectra, and transform to calibrate the object spectra using these arc wavelength solutions. Sky lines in the slitlet spectrum of each object were used to correct for offsets from the lamp wavelength calibrations. On the blue-side spectra, the shift was calculated primarily with the Å emission line. However, in many spectra this line was at the very edge of the spectrum or, for objects with slits at the edge of the mask, missing from the spectrum altogether. Because we were unable to accurately correct for the shift in many spectra, we believe we may suffer from systematic errors as large as 100 km/s. To extract 1-dimensional spectra, we used apall to identify the spectrum center, width, and sky regions. The RVSAO package was used, along with absorption and emission line template spectra, to measure cross correlated redshifts.
In the red-side spectra we had to contend with bright skylines redward of 7000Å. Sky regions within the slitlet were used to subtract these out, but residual noise in most cases is brighter than the target galaxy signal. We therefore only used these spectra when the source signal was bright and to search for emission lines.
3 Results
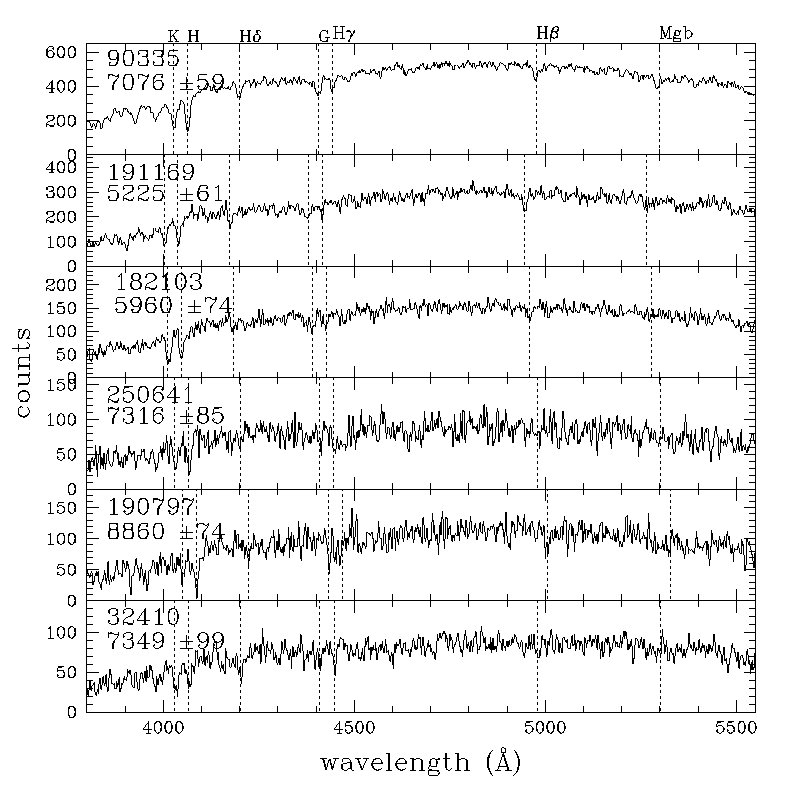
In Fig. 5, we display 6 spectra for dE and dE,N galaxies from which we obtained redshift measurements, arranged in order of increasing band magnitude. The majority of redshifts for Coma member galaxies were measured using prominent lines in the blue, in particular the Ca H&K, Balmer break, and H lines. High redshifts were more often measured from emission lines in the red-side spectra. Spectra from our faint and low surface brightness dwarfs were most often too faint to extract redshift measurements from our red-side spectra due to bright sky emission.
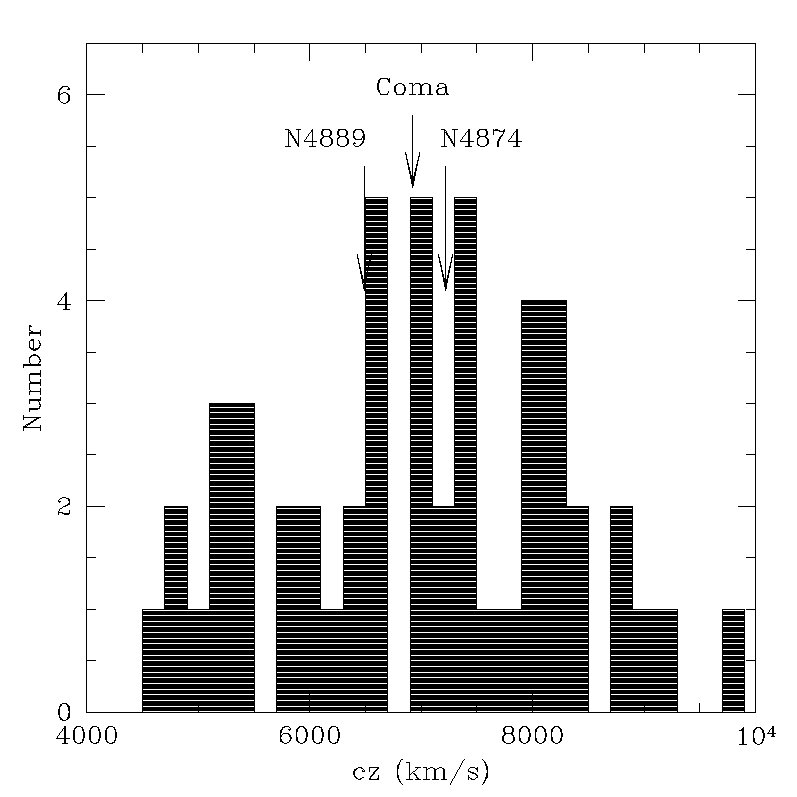
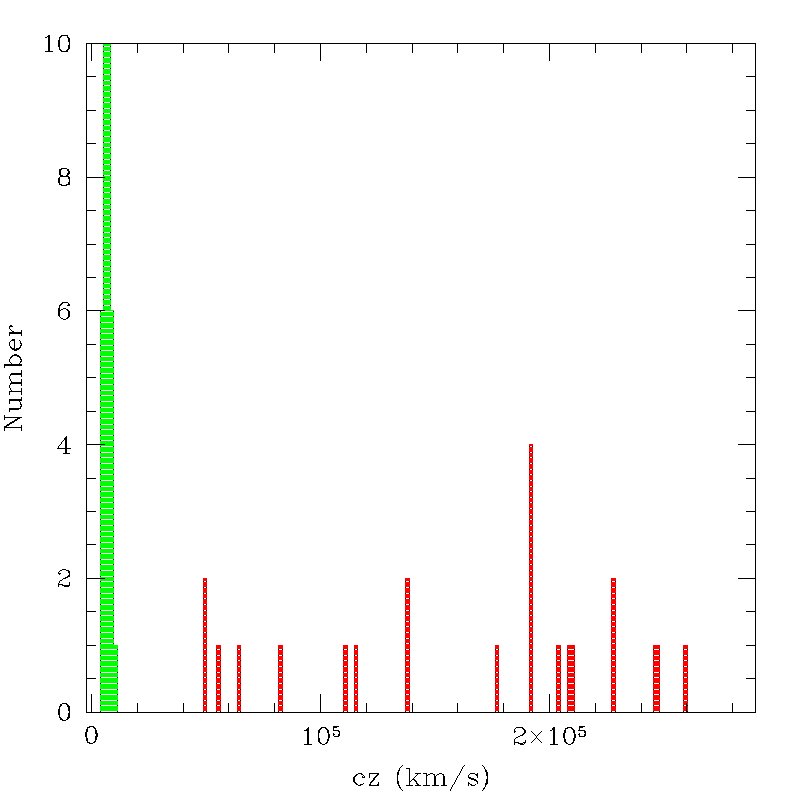
The mean redshift of the Coma Cluster is cz km s-1 with km s-1 (Wegner et al., 1999; Gurzadyan & Mazure, 2001; Shao et al., 1994; Edwards et al., 2002). We take Coma members to be those galaxies within of the cluster mean velocity, or between km s-1. In total we measured redshifts for 70 Coma Cluster members including 19 UCDs. Spectra for the 19 objects confirmed as UCDs are provided in Chiboucas et al. (in prep). Another 14 objects have less secure redshift measurements consistent with Coma Cluster membership including 6 potential UCDs. Redshifts confirmed that another 24 objects are background galaxies while 6 UCD candidates proved to be foreground stars. For the remainder of the targets, the S/N of the spectra was too low to extract redshifts. In total, we measured redshifts for over 80% of our targets. We present the redshift measurements in Table 2 for the non-UCD sample and display histograms of the radial velocities in Fig 6. Redshift measurements for the UCDs are provided in Chiboucas et al. (in prep).
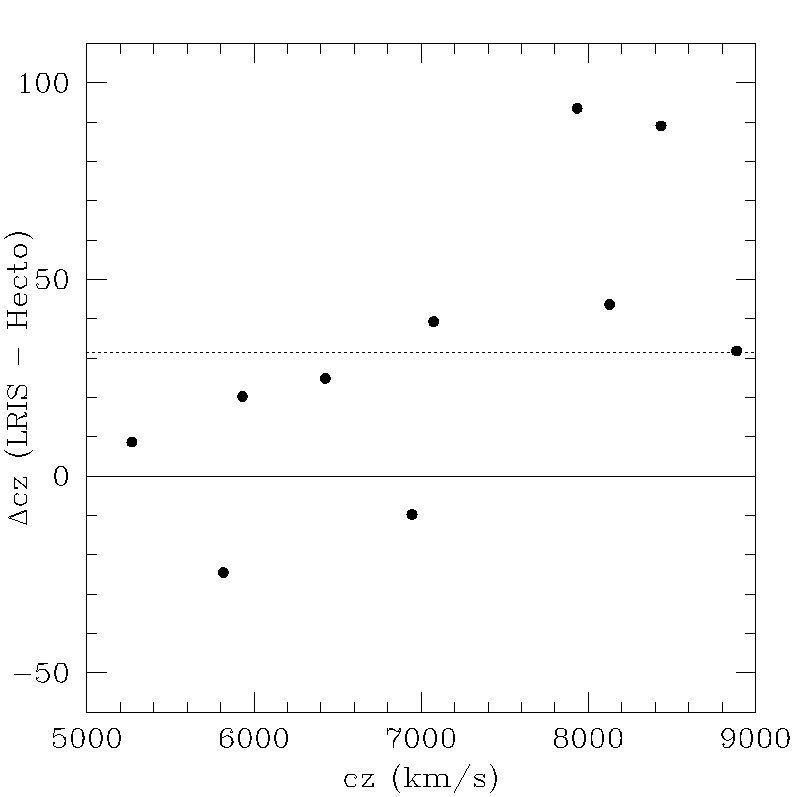
In Figure 7 we compare radial velocity measurements for galaxies that overlapped in the Hectospec sample. The average difference for all 10 galaxies in common is 32 km s-1. Two objects differ by nearly 100 km s-1. These are objects which were observed on the far edge of LRIS masks cutting off much of the red portion of the spectra. For these galaxies, and up to 11% of the sample, the blue-side spectra cut off at the red end by Å. There are few arc lines in this region, so the wavelength calibration is not well constrained at the red end, and no sky lines from which to determine relative shifts from the arc calibration. We therefore expect larger uncertainties for galaxies located along one side of the masks. However, neither the small systematic offset from Hectospec velocities nor larger uncertainties for some galaxies are significant compared to the Coma Cluster velocity dispersion, and so do not affect the cluster membership determination.
For 51 non-UCD member galaxies, we find with . Excluding the one highest redshift object at 9870 km/s, we find with . Edwards et al. (2002) found a mean radial velocity for the Coma Cluster of 6925 km s-1 with velocity dispersions for the giant and dwarf galaxy populations of and km s-1 respectively. The velocity dispersion found for our faint, low surface brightness sample is 1 larger than their dwarf galaxy measurement. This may be due in part to the smaller sample size or smaller field coverage of this study, and in particular with the fact that our sample is confined to the cluster core since velocity dispersion typically decreases with projected radius in clusters. However, it is also consistent with the trend of increasing velocity dispersion with decreasing galaxy luminosity (or mass) previously found for the Coma cluster and which may be due to dynamical friction processes that lead to equipartition (Adami et al., 1998).
From the low S/N failures, we can determine our spectroscopic survey limits. We find that in our 3.3 hr integrated exposures, we are able to measure redshifts for all targets with central surface brightness higher than mag arcsec-2. For well resolved galaxies, we are able to measure redshifts down to for galaxies brighter than (or to mean effective surface brightness for galaxies brighter than ). For the quasi-point source UCD candidates, we reach a magnitude deeper, becoming incomplete at and (see Fig. 13-14).
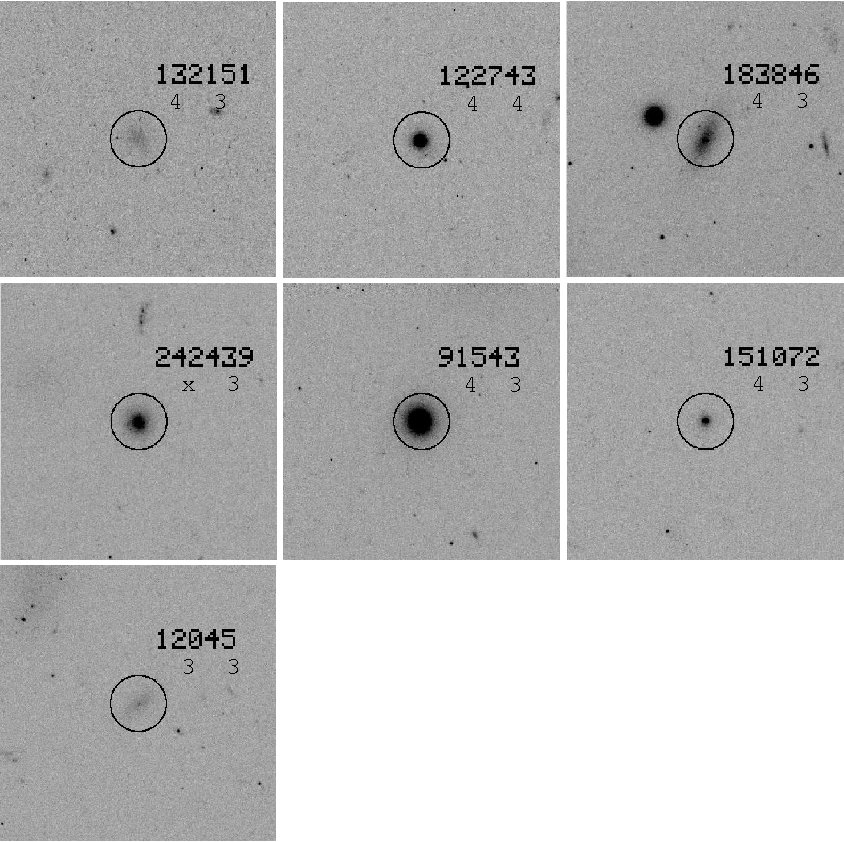
From the redshift measurements of the sample selected to test membership probabilities we find a high success rate for establishing membership through indirect means. Of the 50 objects in our LSB sample that were confirmed to be members, 43 were expected to be members (probability classes 1-2) by one or both of NT and HF. Only 7 had been designated class 3-4 by both. We display thumbnails of these 7 morphologically ambiguous objects in Figure 8. All 7 are classified as types other than dE. One is classified as an irregular, 4 as normal ellipticals, and 2 as S0 and dS0. This last was given the membership probability 3 (uncertain) by both authors. Based on the spectroscopic redshifts, we see that two of the confirmed members classified as E types (91543, 122743) are in fact compact elliptical (cE) galaxies. The other two galaxies classified as Es are even more compact high surface brightness objects. One (151072) may be a member of the UCD class based on its size and surface brightness. The other (242439) is larger and appears to have a low surface brightness envelope with some additional structure. The objects correctly identified as members based on morphology and surface brightness are largely of the dE and dE,N classes with only a few exceptions. The failures are largely featureless, and often round, compact early types.
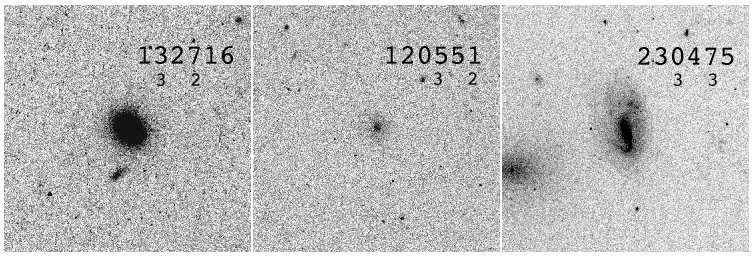
Of the 20 confirmed background objects, 17 had been correctly assigned a 4 (definite background) by at least one author. The remaining 3 had been classified as 3 (uncertain) by at least one author. We show these 3 objects in Figure 9. It is easy to understand the confusion of two of these objects with cE and dE,N type cluster galaxies.
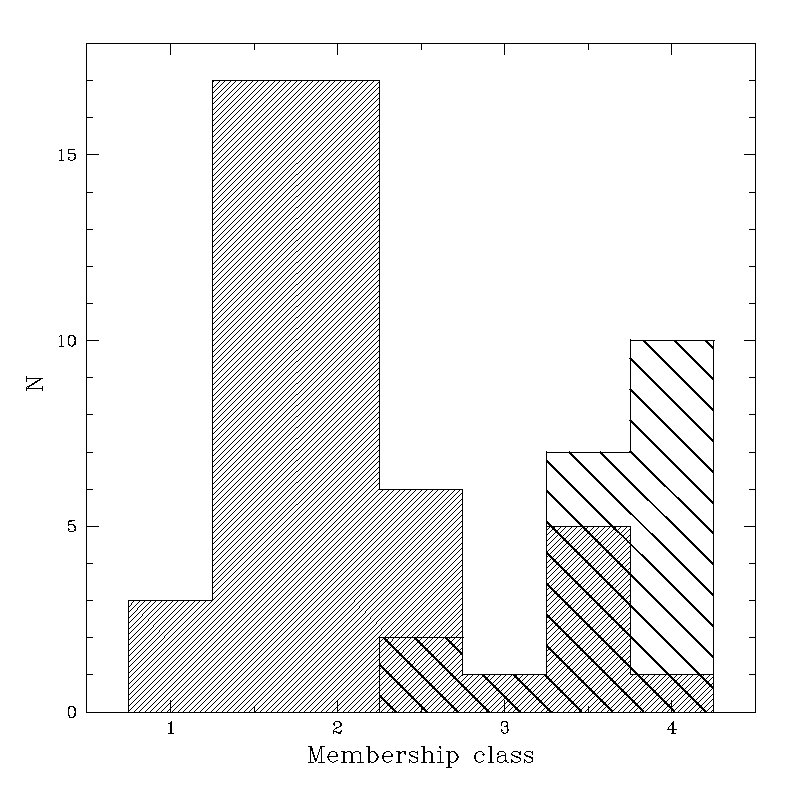
These results indicate very good success for establishing membership through indirect means, although failures are clearly due to morphological biases inherent in using this methodology. We graphically display these results in Fig. 10. The shaded histogram shows, as a function of the average membership probability, the number of objects confirmed to be members while the open hatched histogram shows counts for confirmed background galaxies. For objects designated as 1-2 by both authors, we find a 100% success rate. For objects classified as 4 (background) by both, we find a 91% success rate. We note that our small background sample does not reflect the full range of likely background galaxies. The great majority of background galaxies have spiral arms and other tell-tale features and can be confidently associated with the background. We expect this 91% success rate to therefore be a lower limit. Between the expected member and background galaxies, in the range where at least one author designated the galaxy as an uncertain 3, we encounter the problem cases. Objects with an average probability of 2.5 turned out to be members 75% of the time, those with a probability of 3 turned out to be members half of the time, and those with a probability of 3.5 turned out to be members 42% of the time. On average, for these 22 cases where at least one author chose the uncertain probability 3, 55% turned out to be members while 45% turned out to be background. This is very close to a 50-50 split one might expect for such an uncertain category. For the full sample of morphologically classified galaxies in our ACS fields, this would imply that % of 400 galaxies ranked may be expected to be members and % of 364 galaxies designated may be expected to lie in the background. Another galaxies from the uncertain category 3.0 may also prove to be members.
In summary, we find that if mistakes are made with membership assignments based on morphology, it is often because a small fraction of textureless high surface brightness objects taken to be in the background are compact dwarfs in the cluster. Candidates expected to be members almost always are. Candidates in the uncertain category split almost evenly between member and non-member.
For the UCD sample, our spectroscopy measurements become incomplete by . For targets brighter than this, where we are able to measure secure redshifts, an astonishing 19, or 66%, have turned out to be members. Only 4 targets were found to lie in the background while 6 proved to be stars. We discuss these results in greater detail in Chiboucas et al. (in prep).
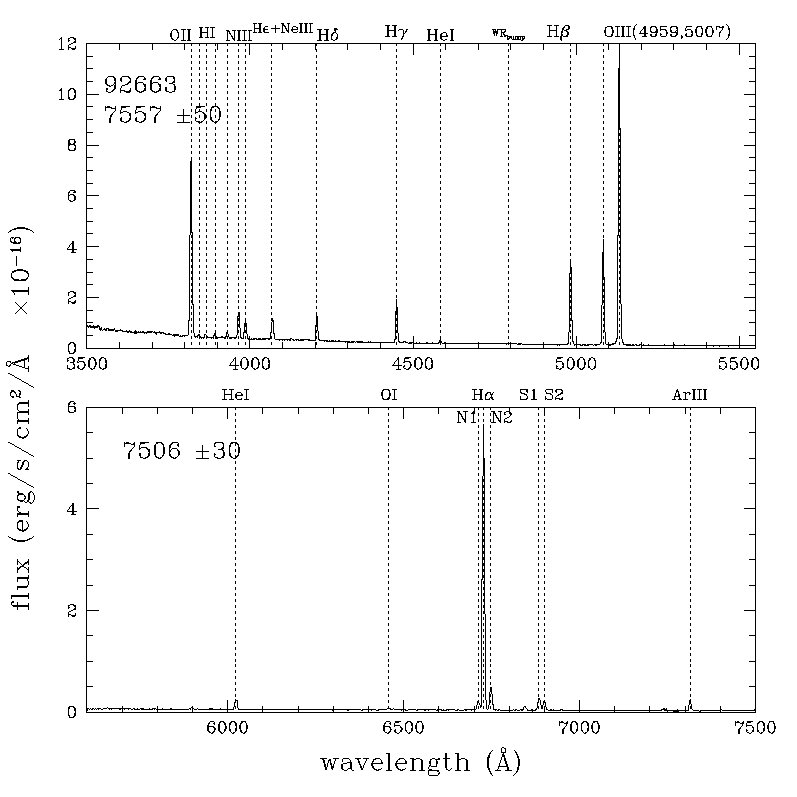
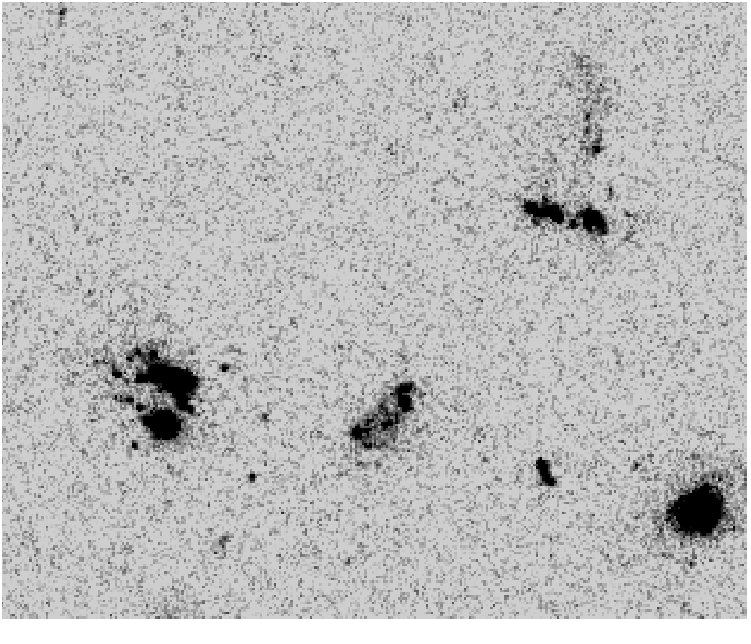
One object (92663) targeted originally as a UCD candidate was confirmed to be a cluster member with km s-1 through unusually strong emission lines. We show the relative flux calibrated red and blue-side spectra in Fig. 11. The spectrum exhibits strong emission lines along with continuum. No absorption lines are apparent in this spectrum. Nebular He and a Wolf-Rayet bump centered around restframe are also visible, indicative of a young starburst. Placing our line strength measurements of [O III]5007/H (0.6) and [N II]6583/H (-1.0) on a BPT diagram (Baldwin et al., 1981), we find our object lies on the branch of objects that are strongly star forming/HII regions. Because these are line ratios of neighboring lines, effects of reddening and flux calibration uncertainties are minimized. From [NII] H (the N2 index) we calculate the oxygen abundance 12 + log(O/H) = 8.3 using the relation found by Pettini & Pagel (2004), somewhat lower than the solar value 8.66. We measure an equivalent width of for H well above the threshold for the definition of a starburst (Lee et al., 2009). Using STARBURST99 models (Leitherer et al., 1999), we estimate an age of this starburst of Myr depending on the model parameters used, consistent with the Wolf-Rayet features observed in the spectrum. As might be expected from the strong H emission line, this object has been detected in both NUV and FUV with GALEX along with H imaging from the 2.5m Isaac Newton Telescope. These data are discussed further in Smith et al. (2010).
This object, targeted as a UCD candidate, has a magnitude and size in the band expected for UCDs. Just to the west of this object, and just outside the slit, is another object visible in the image with a high surface brightness core and distorted envelope (Fig. 12). However, from the band image, we find these two objects are very blue and more extended than seen in the image. They are most likely associated, perhaps as an interacting pair or a single dwarf irregular galaxy having two separate star bursting regions. The targeted object is most likely a large HII/OB complex. The magnitude of the targeted object is , the one just above is a half magnitude brighter. Both objects are quite blue: the targeted source has while the second object has . The double object spans arcsec, or at the distance of Coma, 1.1 kpc.
We note that there is another unusual blue object in the immediate vicinity which appears to be a tidal stream or tidally disturbed galaxy with brighter patches at one end having, presumably, high star formation rates. If this object is also a Coma Cluster member, these two star bursting objects would be separated by a projected distance of kpc. It would seem unusual to find such strongly star forming objects in an old, evolved cluster. However, similar objects have been found in the Coma core region. Yoshida et al. (2008) find an unusual starbursting complex to the southwest of the core which they refer to as ’fireballs’ due to the multiple blue blobs and streams associated with this object. The fireballs appear to be associated with a nearby merger remnant galaxy. Near the ’fireballs’, Yagi et al. (2007) find a long H emitting stream associated with a post-starburst galaxy. In a study of Coma supercluster galaxies, Mahajan et al. (2010) find that star-forming dwarf galaxies on first infall through the dense intracluster medium undergo a burst of star formation and are subsequently quenched. This may be what we are seeing here, although tidal effects could also play a role. This emission line object is discussed further in Smith et al. (2010).
4 Discussion
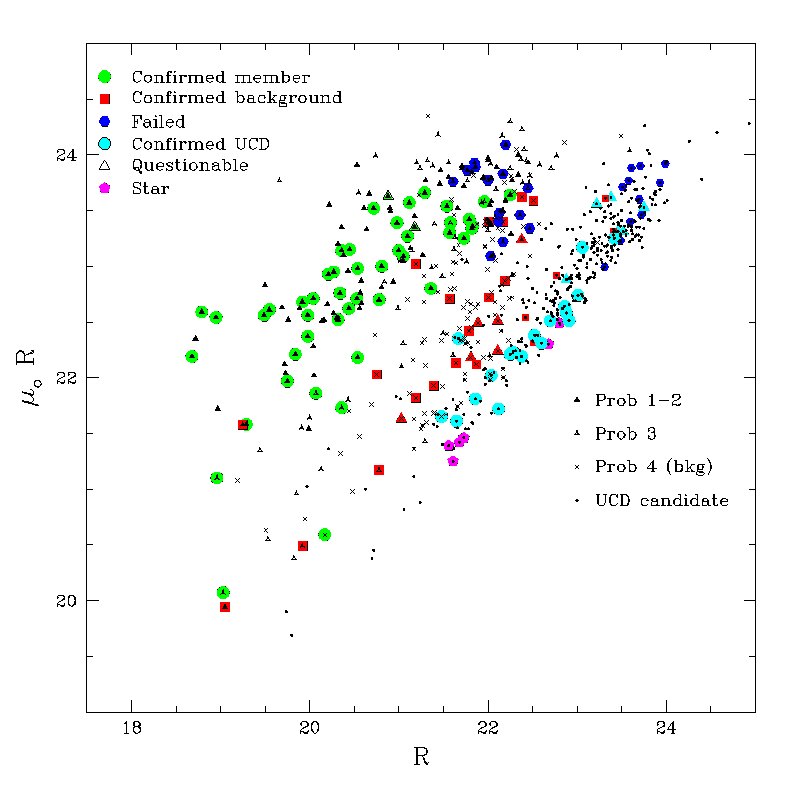
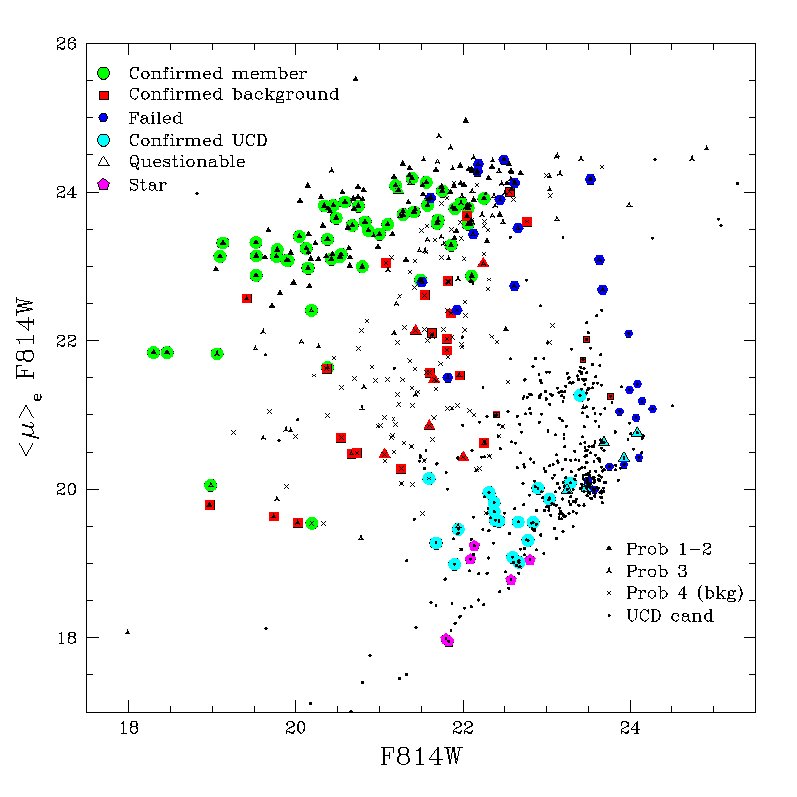
We display membership results in magnitude - surface brightness space in Figures 13 - 14. -band photometry comes from the ground-based Adami et al. (2006) catalog. photometry comes from SExtractor measurements from our ACS data (Hammer et al., 2010). Underlying symbols denote the original membership probability. Those highlighted in green circles were confirmed through redshifts to be members, while red squares highlight the background galaxies. Cyan circles represent confirmed UCDs. Two roughly parallel sequences of cluster members are visible in these figures. The normal dwarf population lies along the low surface brightness end of the range and follows the well known magnitude - surface brightness relation for dwarf ellipticals. On the other side of the surface brightness spectrum are the very high surface brightness and compact UCDs which appear to follow a sequence parallel to that of the dEs. This region is closely bounded by the stellar sequence. Note that due to seeing limitations, the ground based photometry generates narrow UCD and stellar sequences that merge and are bounded on the high surface brightness side by the seeing disk. Although there is still some overlap, ACS measurements expand this surface brightness space and do a better job at separating UCDs and stars. In between the compact and LSB sequences, the great majority of objects are confirmed and expected background galaxies.
These figures demonstrate that, at least in the case of normal dwarf galaxies, surface brightness is a good, and reliable, indicator of membership. In the lowest surface brightness regime, all objects with measured redshifts are members. This result is significant because our spectroscopic survey becomes incomplete due to low surface brightness before becoming incomplete at faint magnitudes. From these diagrams, we may assume that lower surface brightness galaxies without spectra, brightward of , are members as expected from their membership probability classes.
However, these figures also illuminate several issues with this indirect membership assignment technique. At intermediate surface brightnesses, member galaxies overlap in magnitude and surface brightness with the background population. In this region we will expect greater uncertainty with the membership assignments. Also evident is the surface brightness bimodality in the Coma Cluster member population. At the highest surface brightnesses, there is a second significant population of UCD cluster members which overlap, even in ACS images, with the stellar sequence. The UCD sequence may continue to brighter magnitudes than we find here, but in our 2008 observing run we did not target any UCD candidates brighter than . In addition there are a pair of cEs that fall within the surface brightness-magnitude region of the background population. It is strikingly apparent that if these two classes of compact objects constitute significant populations in the Coma Cluster, we may be seriously mis-representing the Coma Cluster galaxy population and associated properties in our comprehensive cluster study when using surface brightness criteria to assign membership.
A number of questions must be addressed. We need to determine if compact dwarf ellipticals compose a significant fraction of the cluster population, and how they might be identified using other means than spectroscopy. This is addressed in Price et al. (2009). With a total of 7 confirmed members at present, it does not appear that compact dwarf galaxies form a large Coma Cluster population. Similarly, we need to determine whether UCDs contribute significantly to the overall cluster dwarf population, how they might be identified short of all-object spectroscopic surveys, and, most importantly, what type of object these are. We address these questions in detail in Chiboucas et al. (in prep). A 60% success rate with our initial observations indicates a large population. However, we do not yet know whether these objects are the stripped remains of nucleated dwarf ellipticals or simply giant star clusters, perhaps forming the bright tail of the globular cluster luminosity distribution.
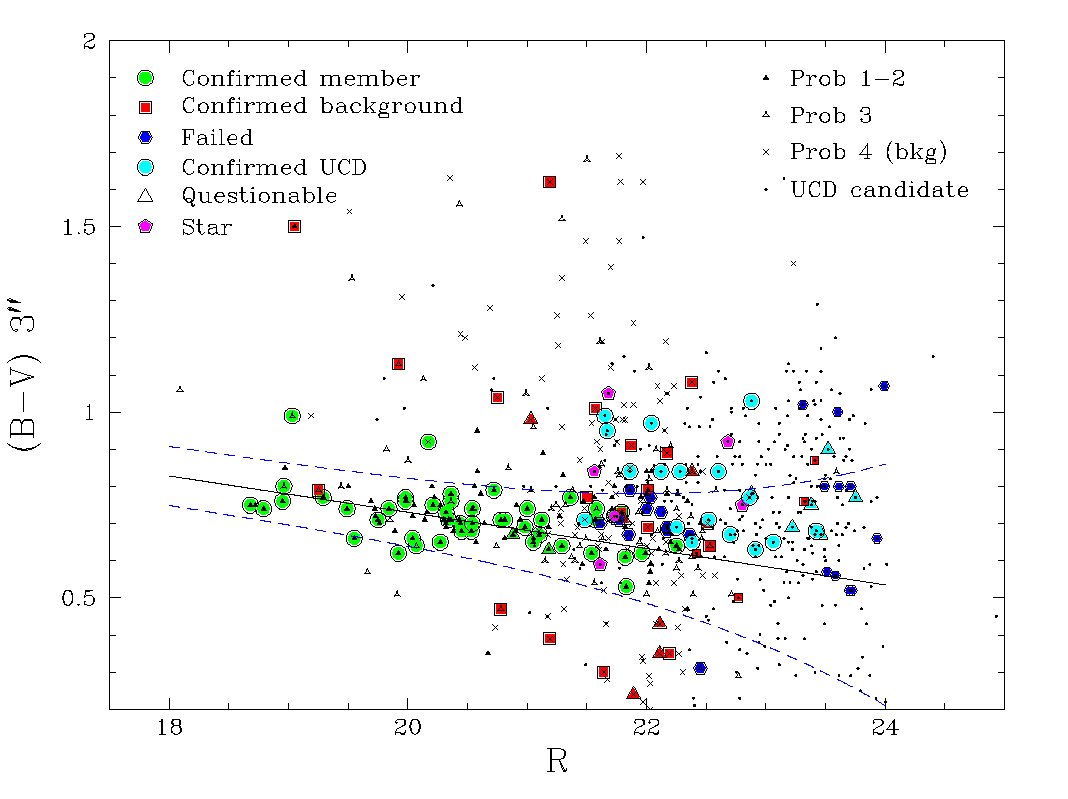
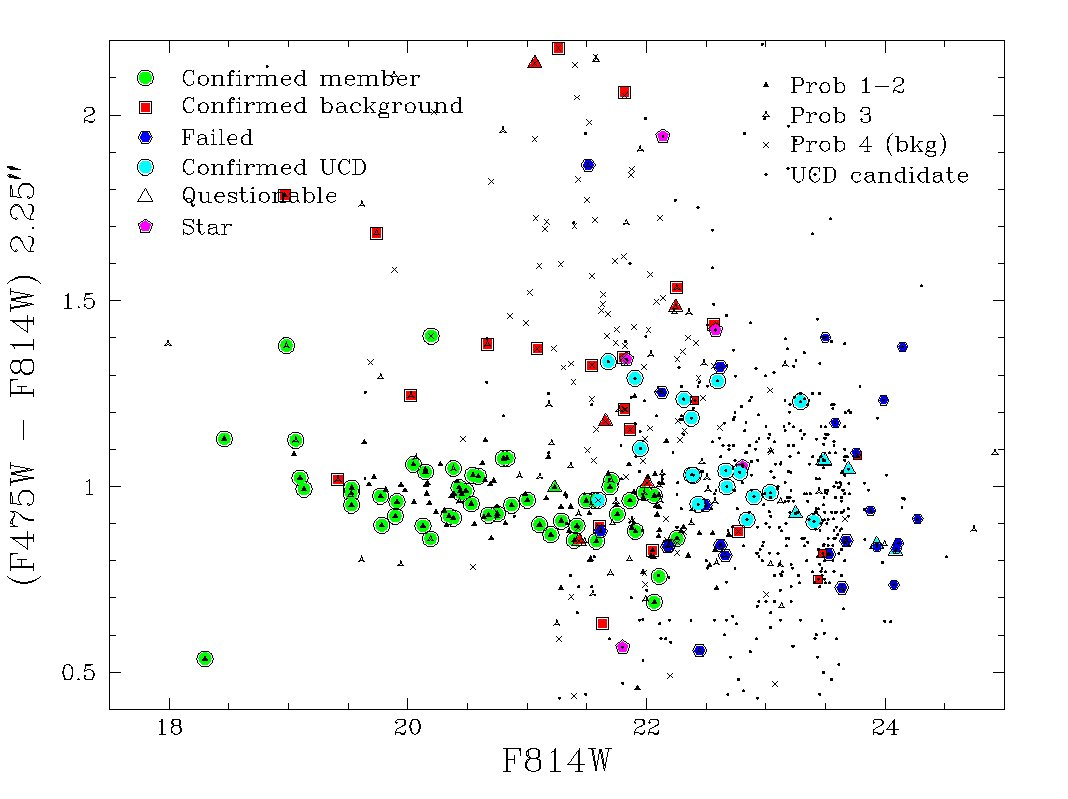
We consider other means of identifying cluster members. In our original classification, color information was not used. We display color-magnitude diagrams in Figure 15. The red sequence of early type cluster members is immediately apparent (highlighted green circles). We include the best fit to the red sequence of 120 galaxies extended to the faint magnitudes here and find that the red sequence is continuous down to at least . Brightward of or , we expect that color can be used to distinguish members from background galaxies with high success. There are only three discrepant points. One background galaxy, originally classified as an uncertain membership probability 3 falls right along the red sequence. Incorporating colors in the membership determination would most likely have led to the mis-identification of this galaxy as a cluster member. Two members lie 0.2 magnitudes redward of the red sequence. These are the already mis-identified cE galaxies. Including color information for these may reinforce the mis-identification as background galaxies. This study suggests that compact ellipticals with colors magnitudes redward of the red sequence warrant spectroscopic attention. We also find that the confirmed UCDs have a large and unexpected color spread. There appears to be a subset that may follow the faint extension of the red sequence while the remainder of UCDs have extraordinarily red colors. Thus, although we would expect that incorporating color information will improve our overall membership assignment success rate, especially for galaxies in the uncertain probability 3 category, and can certainly be used to reliably exclude very red high redshift galaxies, it fails for some of the same objects as morphology and surface brightness criteria. Other means to differentiate between background and cluster members, such as the use of structural parameters, are being investigated.
The observed bimodal distribution of member surface brightnesses therefore complicates membership determinations. We find that our membership assignments are largely successful to . We have not yet uncovered a UCD population brighter than this. Our largest source of uncertainty in this range would appear to be due to the cE class. If these objects do not comprise a large galaxy population, we may expect to have nearly complete and accurate membership information down to . We are, however, continuing to investigate this in future work, including new LRIS and Hectospec observations specifically designed to search for bright UCDs and faint cEs.
Michard & Andreon (2008) establish membership for Coma Cluster galaxies using a very similar method. Based on morphology, surface brightness, and size criteria they identify members in CFHT/CFH12K and imaging. They found good agreement with literature redshift results down to a completeness limit of (), or, assuming , to . At the time, spectroscopic redshifts were nonexistent for most galaxies fainter than this. We compare our results and find 19 objects in common. Of 2 spectroscopically confirmed non-member galaxies, they correctly identified both as background. Of 17 confirmed members, they correctly assign 9 as probable members, while incorrectly classifying 8 as distant spirals. Our membership probabilities for these same objects based on ACS images correctly assigned 16 of the 17 members as definite to likely members although also incorrectly assign one of the two background objects as a likely member. Overall, our membership assignments do a better job at these faint magnitudes and surface brightnesses due to the much higher spatial resolution of the HST/ACS images. Since the success of morphological memberships is directly related to the spatial resolution of the imaging this method can presently only be used for very nearby groups and clusters; at the distance of the Coma Cluster, spaced-based imaging becomes necessary. At greater distances, it becomes difficult to use this method to probe to the same limiting magnitudes () as this study. Galaxies become fainter and smaller, more cluster galaxies with brighter intrinsic magnitudes will not have spectroscopic redshifts, and evolutionary effects may become a factor. We expect this method to be useful using HST/ACS images for clusters and groups within Mpc.
5 Summary and Conclusions
In summary, we have used spectroscopic redshifts to test the success rate for establishing Coma Cluster membership through indirect means such as morphology, surface brightness, size, and color criteria. Using Keck/LRIS multi-object spectroscopy, we targeted 93 galaxies to test membership probability assignments using these indirect means, and another 47 compact objects to search for UCDs.
The results of the membership tests showed that we can use surface brightness, size, and morphology criteria, when based on high resolution ACS images, with good success. We find a high success rate, with 100% of galaxies that were expected to be members proving to be members, and over 90% of galaxies expected to lie in the background proving to be background objects. In practice, we expect this latter percentage to be higher, since the vast majority of expected background galaxies are those which exhibit structural features like spiral arms and these can be confidently associated with the background. Our small sample of expected background galaxies does not reflect the full background population. It is only between these expected member and expected background categories, where galaxy memberships were assigned as ’uncertain’ possible members, do we experience a breakdown with this method. In these cases the failure rate for correctly assigning objects as (possible) members is about 50%, as might be expected. These are primarily cases of galaxies with surface brightness intermediate between low surface brightness dEs and higher surface brightness background galaxies.
In addition to these normal dwarf galaxies, we confirm 19 Coma Cluster UCDs with magnitudes in the range () and having a large spread in color which ranges from the expected color at the faint extension of the red sequence to 0.4 magnitudes redder than the red sequence. We discuss this sample further in Chiboucas et al. (in prep).
The main conclusions from this study are as follows. The dominant cluster population, dwarf elliptical galaxies, follow a magnitude - surface brightness relation (which exhibits some scatter in surface brightness) in which dwarfs decrease in surface brightness at fainter magnitudes with little change in size. This property allows for the use of surface brightness and size as cluster membership indicators for dwarf galaxies. From our spectroscopic results we determine that very low surface brightness galaxies can indeed be confidently associated with the cluster. It is only at the higher surface brightness side of the magnitude - surface brightness relation that some ambiguity enters into the membership determination as members and background galaxies begin to merge and membership assignments become uncertain. For statistical purposes, we find that objects with uncertain membership assignments may be considered members with % probability. It is only near the intermediate surface brightness boundary between members and non-members where this will be a problem; the majority of dwarf galaxies have lower surface brightnesses and can safely be assigned as cluster members.
That said, we find that dwarf cluster members are clearly separated into LSB and the compact cE and UCD families. The Coma Cluster galaxy population consists of the established low surface brightness dwarf galaxies and, on the other side of the surface brightness spectrum falling far off the magnitude - surface brightness relation of dE galaxies, are the very high surface brightness UCDs. In between, largely within the range of the background population, are the cEs. It is possible that UCDs and cEs form a single family of objects; the two-magnitude gap between these two populations at must be explored. Membership criteria which stipulate low surface brightness will fail entirely for these compact galaxy types.
We did not use colors in our initial membership probability assignments, but we investigate the membership results in terms of galaxy color. For the most part, we find colors do at least as well as surface brightness and size criteria in distinguishing member from non-member galaxies. Most cluster dwarfs follow an obvious red sequence. However, color criteria fail for many of the same objects, namely the cE and UCD classes, where other indirect means fail. Thus, colors provide a good discriminant most of the time but must be lenient on the red side to catch the cE and UCD components of the cluster population. Spectroscopy is required to establish membership for these object types.
Overall, we find good success using morphology and structural characteristics based on high resolution ACS imaging to establish membership, with shortfalls at the boundaries between member and non-member population properties, and in the high surface brightness regime. Construction of a luminosity function may be problematic if cEs and UCDs comprise significant cluster populations. However, we do not believe cEs to be a dominant population and it is still unclear as to whether UCDs are, in fact, galaxies at all rather than giant star clusters. We are following up on these two populations in Price et al. (2009) and Chiboucas et al. (in prep).
Our results show that indirect and direct (spectroscopic) means for determining cluster membership have orthogonal biases. Spectroscopy is most successful for high surface brightness objects, the exact region where the indirect means tend to fail. Observations for high surface brightness objects require much shorter exposure times so larger samples of high surface brightness galaxies may be observed in order to establish membership, while indirect means are expected to successfully identify LSB members. This finding is significant as it suggests ways to maximize the efficiency of telescope time for future cluster membership studies. With high spatial resolution imaging, indirect means provide a nearly 100% success rate for identifying low surface brightness members; spectroscopic studies should concentrate on intermediate and high surface brightness galaxies.
References
- Adami et al. (1998) Adami, C., Biviano, A., & Mazure, A. 1998, A&A, 331, 439
- Adami et al. (2009) Adami, C., Le Brun, V., Biviano, A., Durret, F., Lamareille, F., Pelló, R., Ilbert, O., Mazure, A., Trilling, R., & Ulmer, M. P. 2009, A&A, 507, 1225
- Adami et al. (2006) Adami, C., Picat, J. P., Savine, C., Mazure, A., West, M. J., Cuillandre, J. C., Pelló, R., Biviano, A., Conselice, C. J., Durret, F., Gallagher, III, J. S., Gregg, M., Moreau, C., & Ulmer, M. 2006, A&A, 451, 1159
- Baldwin et al. (1981) Baldwin, J. A., Phillips, M. M., & Terlevich, R. 1981, PASP, 93, 5
- Bekki et al. (2003) Bekki, K., Couch, W. J., Drinkwater, M. J., & Shioya, Y. 2003, MNRAS, 344, 399
- Binggeli (1994) Binggeli, B. 1994, in European Southern Observatory Conference and Workshop Proceedings, Vol. 49, European Southern Observatory Conference and Workshop Proceedings, ed. G. Meylan & P. Prugniel, 13–+
- Binggeli & Cameron (1991) Binggeli, B. & Cameron, L. M. 1991, A&A, 252, 27
- Binggeli et al. (1985) Binggeli, B., Sandage, A., & Tammann, G. A. 1985, AJ, 90, 1681
- Blakeslee & Barber DeGraaff (2008) Blakeslee, J. P. & Barber DeGraaff, R. 2008, AJ, 136, 2295
- Boselli et al. (2008) Boselli, A., Boissier, S., Cortese, L., & Gavazzi, G. 2008, A&A, 489, 1015
- Caldwell & Bothun (1987) Caldwell, N. & Bothun, G. D. 1987, AJ, 94, 1126
- Carter et al. (2008) Carter, D., Goudfrooij, P., Mobasher, B., Ferguson, H. C., Puzia, T. H., Aguerri, A. L., Balcells, M., Batcheldor, D., Bridges, T. J., Davies, J. I., Erwin, P., Graham, A. W., Guzmán, R., Hammer, D., Hornschemeier, A., Hoyos, C., Hudson, M. J., Huxor, A., Jogee, S., Komiyama, Y., Lotz, J., Lucey, J. R., Marzke, R. O., Merritt, D., Miller, B. W., Miller, N. A., Mouhcine, M., Okamura, S., Peletier, R. F., Phillipps, S., Poggianti, B. M., Sharples, R. M., Smith, R. J., Trentham, N., Tully, R. B., Valentijn, E., & Verdoes Kleijn, G. 2008, ApJS, 176, 424
- Chilingarian et al. (2008) Chilingarian, I. V., Cayatte, V., & Bergond, G. 2008, MNRAS, 390, 906
- Drinkwater et al. (2004) Drinkwater, M. J., Gregg, M. D., Couch, W. J., Ferguson, H. C., Hilker, M., Jones, J. B., Karick, A., & Phillipps, S. 2004, Publications of the Astronomical Society of Australia, 21, 375
- Drinkwater et al. (2000) Drinkwater, M. J., Jones, J. B., Gregg, M. D., & Phillipps, S. 2000, Publications of the Astronomical Society of Australia, 17, 227
- Edwards et al. (2002) Edwards, S. A., Colless, M., Bridges, T. J., Carter, D., Mobasher, B., & Poggianti, B. M. 2002, ApJ, 567, 178
- Fellhauer & Kroupa (2002) Fellhauer, M. & Kroupa, P. 2002, MNRAS, 330, 642
- Ferguson & Binggeli (1994) Ferguson, H. C. & Binggeli, B. 1994, A&A Rev., 6, 67
- Ferguson & Sandage (1988) Ferguson, H. C. & Sandage, A. 1988, AJ, 96, 1520
- Firth et al. (2008) Firth, P., Drinkwater, M. J., & Karick, A. M. 2008, MNRAS, 389, 1539
- Gurzadyan & Mazure (2001) Gurzadyan, V. G. & Mazure, A. 2001, New Astronomy, 6, 43
- Haşegan et al. (2005) Haşegan, M., Jordán, A., Côté, P., Djorgovski, S. G., McLaughlin, D. E., Blakeslee, J. P., Mei, S., West, M. J., Peng, E. W., Ferrarese, L., Milosavljević, M., Tonry, J. L., & Merritt, D. 2005, ApJ, 627, 203
- Hammer et al. (2010) Hammer, D., Verdoes Kleijn, G., Hoyos, C., den Brok, M., Balcells, M., Ferguson, H. C., Goudfrooij, P., Carter, D., Guzman, R., Peletier, R. F., Smith, R. J., Graham, A. W., Trentham, N., Peng, E., Puzia, T. H., Lucey, J. R., Jogee, S., Aguerri, A. L., Batcheldor, D., Bridges, T. J., Davies, J. I., del Burgo, C., Erwin, P., Hornschemeier, A., Hudson, M. J., Huxor, A., Jenkins, L., Karick, A., Khosroshahi, H., Kourkchi, E., Komiyama, Y., Lotz, J., Marzke, R. O., Marinova, I., Matkovic, A., Merritt, D., Miller, B. W., Miller, N. A., Mobasher, B., Mouhcine, M., Okamura, S., Percival, S., Phillipps, S., Poggianti, B. M., Price, J., Sharples, R. M., Tully, R. B., & Valentijn, E. 2010, ArXiv 1005.3300
- Hilker et al. (1999) Hilker, M., Infante, L., Vieira, G., Kissler-Patig, M., & Richtler, T. 1999, A&AS, 134, 75
- Hradecky et al. (2000) Hradecky, V., Jones, C., Donnelly, R. H., Djorgovski, S. G., Gal, R. R., & Odewahn, S. C. 2000, ApJ, 543, 521
- Impey et al. (1988) Impey, C., Bothun, G., & Malin, D. 1988, ApJ, 330, 634
- Jones et al. (2006) Jones, J. B., Drinkwater, M. J., Jurek, R., Phillipps, S., Gregg, M. D., Bekki, K., Couch, W. J., Karick, A., Parker, Q. A., & Smith, R. M. 2006, AJ, 131, 312
- Lee et al. (2009) Lee, J. C., Kennicutt, R. C., José G. Funes, S. J., Sakai, S., & Akiyama, S. 2009, ApJ, 692, 1305
- Leitherer et al. (1999) Leitherer, C., Schaerer, D., Goldader, J. D., González Delgado, R. M., Robert, C., Kune, D. F., de Mello, D. F., Devost, D., & Heckman, T. M. 1999, ApJS, 123, 3
- Lopez-Cruz (1997) Lopez-Cruz, O. 1997, PhDT
- Mahajan et al. (2010) Mahajan, S., Haines, C. P., & Raychaudhury, S. 2010, MNRAS, 404, 1745
- Mahdavi et al. (2005) Mahdavi, A., Trentham, N., & Tully, R. B. 2005, AJ, 130, 1502
- Michard & Andreon (2008) Michard, R. & Andreon, S. 2008, A&A, 490, 923
- Mieske et al. (2004a) Mieske, S., Hilker, M., & Infante, L. 2004a, A&A, 418, 445
- Mieske et al. (2006) Mieske, S., Hilker, M., Infante, L., & Jordán, A. 2006, AJ, 131, 2442
- Mieske et al. (2007a) Mieske, S., Hilker, M., Jordán, A., Infante, L., & Kissler-Patig, M. 2007a, A&A, 472, 111
- Mieske et al. (2008) Mieske, S., Hilker, M., Jordán, A., Infante, L., Kissler-Patig, M., Rejkuba, M., Richtler, T., Côté, P., Baumgardt, H., West, M. J., Ferrarese, L., & Peng, E. W. 2008, A&A, 487, 921
- Mieske et al. (2009) Mieske, S., Hilker, M., Misgeld, I., Jordán, A., Infante, L., & Kissler-Patig, M. 2009, A&A, 498, 705
- Mieske et al. (2004b) Mieske, S., Infante, L., Benítez, N., Coe, D., Blakeslee, J. P., Zekser, K., Ford, H. C., Broadhurst, T. J., Illingworth, G. D., Hartig, G. F., Clampin, M., Ardila, D. R., Bartko, F., Bouwens, R. J., Brown, R. A., Burrows, C. J., Cheng, E. S., Cross, N. J. G., Feldman, P. D., Franx, M., Golimowski, D. A., Goto, T., Gronwall, C., Holden, B., Homeier, N., Kimble, R. A., Krist, J. E., Lesser, M. P., Martel, A. R., Menanteau, F., Meurer, G. R., Miley, G. K., Postman, M., Rosati, P., Sirianni, M., Sparks, W. B., Tran, H. D., Tsvetanov, Z. I., White, R. L., & Zheng, W. 2004b, AJ, 128, 1529
- Mieske et al. (2007b) Mieske, S., West, M. J., & de Oliveira, C. M. 2007b, in Groups of Galaxies in the Nearby Universe, ed. I. Saviane, V. D. Ivanov, & J. Borissova, 103–+
- Oke et al. (1995) Oke, J. B., Cohen, J. G., Carr, M., Cromer, J., Dingizian, A., Harris, F. H., Labrecque, S., Lucinio, R., Schaal, W., Epps, H., & Miller, J. 1995, PASP, 107, 375
- Peng (2010) Peng, E. W., et al. 2010, ApJ, submitted
- Pettini & Pagel (2004) Pettini, M. & Pagel, B. E. J. 2004, MNRAS, 348, L59
- Phillipps et al. (2001) Phillipps, S., Drinkwater, M. J., Gregg, M. D., & Jones, J. B. 2001, ApJ, 560, 201
- Price et al. (2009) Price, J., Phillipps, S., Huxor, A., Trentham, N., Ferguson, H. C., Marzke, R. O., Hornschemeier, A., Goudfrooij, P., Hammer, D., Tully, R. B., Chiboucas, K., Smith, R. J., Carter, D., Merritt, D., Balcells, M., Erwin, P., & Puzia, T. H. 2009, MNRAS, 397, 1816
- Sandage & Binggeli (1984) Sandage, A. & Binggeli, B. 1984, AJ, 89, 919
- Shao et al. (1994) Shao, Z.-Y., Zhao, J.-L., & Pan, R.-S. 1994, Chinese Astronomy and Astrophysics, 18, 168
- Smith et al. (2010) Smith, R. J., Lucey, J. R., Hammer, D., Hornschemeier, A. E., Carter, D., Hudson, M. J., Marzke, R. O., Mouhcine, M., Eftekharzadeh, S., James, P., Khosroshahi, H., Kourkchi, E., & Karick, A. 2010, MNRAS, 1238
- Smith et al. (2008) Smith, R. J., Marzke, R. O., Hornschemeier, A. E., Bridges, T. J., Hudson, M. J., Miller, N. A., Lucey, J. R., Vázquez, G. A., & Carter, D. 2008, MNRAS, 386, L96
- Trentham & Tully (2002) Trentham, N. & Tully, R. B. 2002, MNRAS, 335, 712
- Trentham et al. (2001) Trentham, N., Tully, R. B., & Verheijen, M. A. W. 2001, MNRAS, 325, 385
- Wegner et al. (1999) Wegner, G., Colless, M., Saglia, R. P., McMahan, R. K., Davies, R. L., Burstein, D., & Baggley, G. 1999, MNRAS, 305, 259
- Wehner & Harris (2007) Wehner, E. M. H. & Harris, W. E. 2007, ApJ, 668, L35
- Yagi et al. (2007) Yagi, M., Komiyama, Y., Yoshida, M., Furusawa, H., Kashikawa, N., Koyama, Y., & Okamura, S. 2007, ApJ, 660, 1209
- Yoshida et al. (2008) Yoshida, M., Yagi, M., Komiyama, Y., Furusawa, H., Kashikawa, N., Koyama, Y., Yamanoi, H., Hattori, T., & Okamura, S. 2008, ApJ, 688, 918
| Mask | Date | (J2000.0) | PA (deg) | Seeing (arcsec) | Nslit | |
|---|---|---|---|---|---|---|
| 1 | 2 Apr 2008 | 13 00 40.69 | 28 01 54.86 | 1.5 | 0.7 | 35 |
| 2 | 3 Apr 2008 | 13 00 17.82 | 28 01 26.81 | 1.5 | 1.0 | 32 |
| 3††Exposure times for both red and blue chips were sec with the exception of Mask 3 for which we obtained only sec on the blue side. | 3 Apr 2008 | 13 00 24.62 | 27 56 26.11 | 80.0 | 1.0 | 38 |
| 4 | 2 Apr 2008 | 12 59 40.10 | 27 59 06.28 | 121.0 | 0.8 | 39 |
| ID | T/FaaMembership probability classes of NT and HF. An x indicates no membership probability was assigned. In most cases these objects were assumed to be background. A 5 denotes that the galaxy was an extra object that landed in the slit. | bb photometry from catalog of Adami et al. (2006) | bb photometry from catalog of Adami et al. (2006) | bb photometry from catalog of Adami et al. (2006) | RA | Dec | cz | errccErrors include contributions from the cross correlation measurement uncertainty and from the uncertainties in the sky line wavelength calibration shift. | Rfx | cz | err | SNRddSignal-to-noise ratio per Angstrom around 5000Å | type | ||||
|---|---|---|---|---|---|---|---|---|---|---|---|---|---|---|---|---|---|
| prob | corr. | (J2000.0) | Ab | km s-1 | Em | km s-1 | |||||||||||
| Members | |||||||||||||||||
| 132151 | 4 3 | 21.58 | 21.43 | 21.70 | 0.74 | 1.02 | 23.39 | 23.62 | 12 59 26.04 | 28 01 04.00 | 5486 | 130 | 2.9 | 6.3 | ImV | ||
| 133494 | 2 1 | 18.24 | 18.46 | 1.13 | 21.84 | 12 59 30.83 | 28 02 30.73 | 6549 | 77 | 8.5 | 44.6 | E | |||||
| 190797 | 3 2 | 21.79 | 21.20 | 21.58 | 0.73 | 0.85 | 23.42 | 23.82 | 12 59 31.73 | 27 57 48.17 | 8860 | 74 | 4.0 | 5.0 | dE | ||
| 191169 | 2 1 | 19.98 | 19.82 | 20.13 | 0.76 | 0.89 | 22.56 | 23.24 | 12 59 34.35 | 27 59 43.41 | 5225 | 61 | 9.0 | 15.3 | dE | ||
| 192254 | 3 1 | 22.25 | 21.80 | 22.25 | 0.64 | 0.86 | 23.64 | 23.91 | 12 59 35.23 | 27 58 50.28 | 7355 | 110 | 3.1 | 4.5 | dE | ||
| 194749 | 3 1 | 21.73 | 21.54 | 21.86 | 0.72 | 0.96 | 23.25 | 23.28 | 12 59 38.08 | 27 56 56.45 | 6128 | 79 | 3.8 | 7.1 | dE | ||
| 1038885hhObject was observed in a separate run in 2009 | 2 1 | 21.36 | 21.86 | 22.10 | 0.77 | 0.76 | 22.80 | 22.87 | 12 59 38.62 | 27 56 58.64 | 6718 | 47 | 4.0 | 5.1 | dE | ||
| 122743 | 4 4 | 20.17 | 20.07 | 20.19 | 0.92 | 1.40 | 20.59 | 19.54 | 12 59 42.27 | 28 00 54.53 | 7934 | 77 | 15.0 | 40.7 | E | ||
| 195506 | 2 1 | 19.55 | 19.77 | 0.97 | 23.13 | 12 59 42.93 | 27 59 54.23 | 8497 | 83 | 7.9 | 11.3 | dE | |||||
| 196718 | 2 1 | 21.05 | 20.82 | 21.10 | 0.65 | 0.90 | 23.09 | 23.56 | 12 59 43.94 | 27 58 01.95 | 7926 | 94 | 5.4 | 6.2 | dE | ||
| 250641 | 2 1 | 21.54 | 21.86 | 22.06 | 0.62 | 0.97 | 23.54 | 23.79 | 12 59 44.01 | 27 56 15.32 | 7316 | 85 | 3.2 | 5.4 | dE | ||
| 180052 | 2 x | 19.92 | 19.75 | 20.04 | 0.62 | 1.06 | 22.68 | 23.40 | 12 59 44.72 | 27 58 06.77 | 9870 | 74 | 4.2 | 10.4 | dE | ||
| 182103 | 3 2 | 20.54 | 20.56 | 20.80 | 0.74 | 1.08 | 22.18 | 22.99 | 12 59 51.83 | 27 57 26.25 | 5960 | 74 | 7.6 | 12.4 | dE | ||
| 4042826hhObject was observed in a separate run in 2009 | 2 1 | 20.54 | 20.38 | 20.68 | 0.70 | 0.92 | 22.98 | 23.55 | 12 59 52.18 | 27 59 46.48 | 8641 | 116 | 2.2 | 5.0 | dE | ||
| 183846 | 4 3 | 20.07 | 20.02 | 20.19 | 0.64 | 0.86 | 21.86 | 22.41 | 12 59 59.97 | 27 59 17.88 | 9031 | 79 | 5.3 | 22.4 | S0 | ||
| 242439 | x 3 | 20.36 | 20.20 | 20.38 | 0.76 | 1.05 | 21.73 | 21.64 | 13 00 10.38 | 27 56 17.08 | 7485 | 60 | 8.7 | 26.4 | E | ||
| 31001 | 3 1 | 21.83 | 21.80 | 22.06 | 0.53 | 0.69 | 23.36 | 23.57 | 13 00 11.96 | 28 04 03.01 | 7104 | 80 | 4.3 | 7.7 | dE | ||
| 101463 | 2 2 | 20.53 | 20.83 | 1.08 | 23.60 | 13 00 13.52 | 28 02 14.60 | 5327 | 65 | 7.4 | 8.1 | dE | |||||
| 101935 | 3 2 | 21.57 | 21.59 | 21.91 | 0.71 | 0.88 | 23.30 | 23.77 | 13 00 14.21 | 28 00 26.38 | 8149 | 85 | 5.7 | 5.4 | dE | ||
| 101962 | 2 1 | 20.36 | 20.28 | 20.59 | 0.78 | 1.03 | 23.14 | 23.87 | 13 00 15.70 | 28 01 46.24 | 6985 | 92 | 3.8 | 5.2 | dE | ||
| 230614 | 1 1 | 19.55 | 19.54 | 19.78 | 0.66 | 0.90 | 22.61 | 23.22 | 13 00 16.36 | 27 55 22.11 | 4665 | 66 | 7.9 | 9.5 | dE | ||
| 230665 | 2 1 | 18.95 | 19.31 | 19.52 | 0.76 | 0.92 | 22.54 | 23.32 | 13 00 16.68 | 27 56 38.81 | 5366 | 78 | 6.5 | 9.9 | dE | ||
| 160495 | 3 2 | 21.10 | 21.17 | 21.42 | 0.67 | 0.89 | 23.27 | 23.73 | 13 00 18.26 | 27 58 17.51 | 4950 | 79 | 4.5 | 5.3 | dE | ||
| 230945 | 3 1 | 20.04 | 20.20 | 20.38 | 0.66 | 0.92 | 22.71 | 23.36 | 13 00 18.41 | 27 55 16.85 | 8155 | 74 | 5.1 | 11.0 | dS0 | ||
| 32410 | 2 1 | 21.82 | 21.39 | 21.69 | 0.61 | 1.00 | 23.34 | 23.58 | 13 00 19.32 | 28 04 22.27 | 7349 | 99 | 4.2 | 6.5 | dE | ||
| 160703 | 2 1 | 21.29 | 20.90 | 21.39 | 0.64 | 0.86 | 23.66 | 24.18 | 13 00 19.74 | 27 59 04.88 | 7035 | 135 | 2.9 | 5.7 | dE | ||
| 32493 | 2 1 | 20.44 | 20.31 | 20.53 | 0.70 | 0.95 | 22.62 | 23.13 | 13 00 20.28 | 28 04 53.15 | 8128 | 69 | 6.2 | 12.5 | dE | ||
| 90186 | 2 1 | 20.21 | 20.12 | 20.49 | 0.75 | 0.99 | 22.93 | 23.65 | 13 00 21.97 | 28 02 18.39 | 8051 | 63 | 6.7 | 4.7 | dE | ||
| 231908 | 2 1 | 19.49 | 19.28 | 19.53 | 0.74 | 1.00 | 22.56 | 23.14 | 13 00 22.95 | 27 55 15.30 | 5270 | 69 | 7.0 | 14.8 | dE | ||
| 161594 | 2 1 | 21.12 | 21.16 | 21.56 | 0.71 | 0.96 | 23.57 | 24.13 | 13 00 23.22 | 27 59 48.92 | 6321 | 75 | 3.4 | 4.6 | dE | ||
| 90335 | 2 1 | 19.29 | 19.34 | 19.53 | 0.77 | 0.95 | 21.58 | 22.88 | 13 00 23.47 | 28 03 02.00 | 7076 | 59 | 9.5 | 28.5 | dE | ||
| 162112 | 3 1 | 19.75 | 20.82 | 19.89 | 0.71 | 0.92 | 21.97 | 23.08 | 13 00 24.85 | 27 59 21.90 | 9217 | 65 | 7.9 | 19.6 | dE | ||
| 232063 | 3 1 | 19.98 | 19.93 | 20.15 | 0.77 | 1.04 | 20.15 | 22.98 | 13 00 25.05 | 27 56 38.00 | 6946 | 87 | 7.0 | 13.0 | dE | ||
| 162484 | 3 1 | 20.34 | 20.28 | 20.54 | 0.71 | 1.03 | 22.76 | 23.16 | 13 00 26.76 | 27 59 53.57 | 7195 | 67 | 5.9 | 8.6 | dE | ||
| 91543 | 4 3 | 19.03 | 18.83 | 18.98 | 0.99 | 1.38 | 20.07 | 20.05 | 13 00 27.34 | 28 00 33.26 | 6428 | 51 | 26.3 | 43.4 | E | ||
| 163240 | 3 1 | 20.81 | 21.00 | 0.96 | 23.43 | 13 00 29.71 | 27 58 06.79 | 5220 | 71 | 5.9 | 8.6 | dE | |||||
| 91844 | 3 1 | 20.81 | 20.60 | 20.87 | 0.71 | 0.95 | 23.00 | 23.48 | 13 00 30.02 | 28 01 35.08 | 6588 | 75 | 5.3 | 10.1 | dE | ||
| 91752 | 2 x | 20.53 | 19.90 | 20.34 | 0.68 | 0.92 | 22.71 | 23.81 | 13 00 30.93 | 28 03 12.76 | 7395 | 65 | 7.3 | 10.5 | dE | ||
| 92156 | 2 1 | 20.72 | 20.79 | 21.20 | 0.79 | 0.87 | 23.52 | 24.09 | 13 00 31.76 | 28 01 21.84 | 8123 | 86 | 3.7 | 7.0 | dE | ||
| 150137 | 1 1 | 18.79 | 18.83 | 19.13 | 0.74 | 0.99 | 22.59 | 23.31 | 13 00 32.48 | 27 58 32.87 | 8435 | 106 | 3.5 | 10.4 | dE | ||
| 150530 | 4 1 | 20.32 | 20.21 | 20.43 | 0.73 | 1.00 | 22.52 | 23.10 | 13 00 34.29 | 27 58 17.63 | 7817 | 73 | 7.0 | 15.2 | dE | ||
| 221227 | 3 1 | 19.84 | 19.73 | 19.91 | 0.74 | 0.96 | 22.21 | 23.08 | 13 00 35.99 | 27 55 05.59 | 6946 | 59 | 9.9 | 15.7 | dE | ||
| 92663 | x x | 21.02eePhotometry is for two blended components including the UCD target and another source centered 0.9 arcsec west of it. | 23.00 | 23.13 | 0.46eePhotometry is for two blended components including the UCD target and another source centered 0.9 arcsec west of it. | -0.92 | 21.81 | 20.38 | 13 00 36.54 | 28 02 55.53 | 7557 | 70 | |||||
| 7506ffRedshift measurement from red-side data | 30 | ||||||||||||||||
| 151072ggObject was observed in two masks. | 4 3 | 21.48 | 21.47 | 21.60 | 0.71 | 0.96 | 21.65 | 20.14 | 13 00 37.84 | 27 58 40.94 | 4906 | 74 | 6.7 | 18.9 | E | ||
| 4845 | 59 | 10.0 | 21.3 | ||||||||||||||
| 80651 | 2 2 | 18.12 | 18.30 | 0.54 | 21.84 | 13 00 39.08 | 28 00 35.51 | 5932 | 76 | 5.4 | 59.1 | Sa | |||||
| 151316 | 2 1 | 20.27 | 20.08 | 20.45 | 0.65 | 0.98 | 22.95 | 23.82 | 13 00 39.28 | 27 57 48.01 | 6599 | 73 | 3.4 | 5.7 | dE | ||
| 10162 | 1 1 | 20.45 | 20.45 | 20.75 | 0.68 | 0.93 | 23.15 | 23.81 | 13 00 39.37 | 28 04 11.37 | 6652 | 55 | 6.4 | 9.8 | dE | ||
| 10640 | 3 2 | 18.96 | 18.88 | 19.06 | 0.80 | 1.12 | 21.10 | 21.82 | 13 00 42.52 | 28 03 25.33 | 5817 | 64 | 13.8 | 32.6 | E | ||
| 151773 | 3 1 | 21.00 | 20.96 | 21.29 | 0.74 | 0.91 | 23.14 | 23.69 | 13 00 43.73 | 27 59 20.84 | 4840 | 80 | 7.2 | 7.8 | dE | ||
| 81390 | 2 1 | 18.68 | 18.86 | 19.10 | 0.75 | 1.02 | 22.19 | 23.13 | 13 00 44.10 | 28 02 15.43 | 8889 | 75 | 10.0 | 27.6 | dE | ||
| 11874 | 3 1 | 20.98 | 21.35 | 21.75 | 0.69 | 0.93 | 23.39 | 24.01 | 13 00 45.92 | 28 03 35.46 | 7919 | 79 | 4.2 | 5.7 | dE | ||
| 150005 | 3 1 | 20.78 | 21.37 | 21.50 | 0.71 | 0.96 | 22.70 | 22.81 | 13 00 47.55 | 27 58 29.91 | 5820 | 61 | 8.2 | 12.7 | dE | ||
| 12045 | 3 3 | 21.96 | 21.78 | 21.98 | 0.62 | 0.98 | 23.58 | 23.85 | 13 00 51.03 | 28 03 47.62 | 6678 | 72 | 5.6 | 7.4 | dS0 | ||
| Bckgrd | |||||||||||||||||
| 132716 | 3 2 | 19.05 | 18.83 | 18.97 | 1.50 | 1.78 | 19.94 | 19.79 | 12 59 29.19 | 28 01 31.76 | 55023 | 101 | 14.1 | 54866 | 99 | 61.1 | E |
| 120551 | 3 2 | 22.01 | 21.68 | 22.05 | 0.79 | 0.83 | 23.40 | 23.68 | 12 59 34.78 | 28 02 01.36 | 49868 | 179 | 1.1 | 49484 | 72 | 7.3 | dE |
| 192871 | 4 3 | 19.92 | 19.59 | 19.74 | 1.13 | 1.68 | 20.49 | 19.63 | 12 59 37.13 | 27 58 46.93 | 115172 | 87 | 4.5 | 115228 | 74 | 34.8 | Sp |
| 182393 | 3 x | 21.19 | 20.81 | 21.08 | 0.39 | 1.37 | 23.02 | 23.04 | 12 59 52.59 | 27 56 57.90 | 208287 | 41 | |||||
| 100600 | 4 4 | 22.17 | 21.63 | 21.82 | 0.89 | 2.06 | 23.40 | 22.80 | 13 00 09.01 | 28 02 44.84 | 246765 | 70 | Sp | ||||
| 101905 | x x | 21.79 | 21.61 | 21.90 | 0.73 | 1.21 | 22.42 | 22.02 | 13 00 13.85 | 28 00 15.14 | 138648 | 36 | |||||
| 230804 | 4 3 | 21.39 | 20.60 | 20.73 | 2.03 | 3.07 | 21.93 | 20.48 | 13 00 14.14 | 27 53 58.08 | 204700 | 63 | 10.1 | S0 | |||
| 230475 | 3 3 | 19.25 | 19.21 | 19.41 | 0.79 | 1.02 | 21.58 | 22.57 | 13 00 16.28 | 27 56 30.48 | 49616 | 104 | 3.3 | 49669 | 135 | 15.1 | Sp |
| 161002 | 4 3 | 19.90 | 20.03 | 1.25 | 19.55 | 13 00 17.60 | 27 58 07.62 | 63908 | 87 | 6.2 | 63817 | 90 | 44.0 | E | |||
| 63973 | 90 | 5.2 | 63953 | 76 | 40.6 | ||||||||||||
| 160796 | 5 x | 23.41 | 22.91 | 23.20 | 1.33 | 24.12 | 23.19 | 13 00 18.66 | 27 58 17.10 | 245259 | 49 | ||||||
| 32265 | x x | 21.57 | 21.30 | 21.54 | 1.01 | 1.22 | 22.71 | 22.61 | 13 00 17.67 | 28 03 34.53 | 82392 | 88 | 4.4 | 82282 | 71 | 8.9 | |
| 160607 | x x | 22.51 | 22.54 | 22.77 | 0.70 | 0.88 | 23.59 | 22.77 | 13 00 18.63 | 27 58 22.73 | 111330 | 41 | |||||
| 32751 | 4 4 | 20.75 | 20.20 | 20.37 | 1.04 | 2.63 | 22.03 | 21.62 | 13 00 20.62 | 28 04 15.69 | 192640 | 71 | 3.7 | 192765 | 43 | Sp | |
| 230000 | 5 x | 13 00 22.84 | 27 55 15.52 | 210243 | 39 | ||||||||||||
| 232587 | 4 3 | 22.19 | 21.67 | 21.86 | 0.35 | 1.15 | 22.87 | 22.37 | 13 00 27.17 | 27 54 53.29 | 227441 | 41 | Irr | ||||
| 220952 | x x | 21.87 | 21.14 | 21.26 | 0.91 | 2.18 | 22.12 | 20.28 | 13 00 34.25 | 27 54 47.15 | 259047 | 83 | 2.8 | 259248 | 87 | ||
| 22382 | 4 3 | 21.19 | 20.41 | 20.54 | 1.62 | 3.00 | 21.82 | 20.69 | 13 00 35.74 | 28 03 19.44 | 192345 | 91 | 3.0 | E | |||
| 221307 | 4 3 | 20.78 | 20.51 | 20.67 | 0.47 | 1.38 | 21.17 | 20.48 | 13 00 36.22 | 27 55 34.60 | 192243 | 34 | Irr | ||||
| 80801 | x x | 21.78 | 21.96 | 2.48 | 21.53 | 13 00 39.68 | 28 00 41.69 | 138122 | 56 | 4.7 | |||||||
| 80686 | x x | 22.53 | 21.10 | 22.25 | 0.64 | 1.54 | 22.33 | 20.62 | 13 00 39.74 | 28 01 11.89 | 176421 | 32 | |||||
| 80928 | x x | 22.01 | 21.62 | 21.81 | 0.69 | 1.35 | 22.72 | 21.87 | 13 00 42.36 | 28 02 41.35 | 228058 | 38 | |||||
| 10863 | x x | 21.64 | 21.45 | 21.60 | 0.30 | 0.89 | 22.13 | 21.57 | 13 00 45.15 | 28 05 20.63 | 192212 | 31 | |||||
| Uncertain | |||||||||||||||||
| 133528 | x x | 21.81 | 21.44 | 21.60 | 0.71 | 2.25 | 22.18 | 20.85 | 12 59 31.82 | 28 00 32.81 | 154006 | 91 | 3.1 | ||||
| 181737 | x x | 22.11 | 21.91 | 22.01 | 0.35 | 1.01 | 22.24 | 20.43 | 12 59 53.19 | 28 00 10.57 | 295925 | 32 | |||||
| 100940 | 4 3 | 21.03 | 20.94 | 21.06 | 0.98 | 2.14 | 21.63 | 20.47 | 13 00 09.79 | 28 01 37.19 | 125875 | 63 | 5.1 | E | |||
| 32910 | 1 1 | 20.88 | 20.85 | 21.23 | 0.67 | 1.00 | 23.63 | 24.02 | 13 00 21.35 | 28 03 26.87 | 7870 | 91 | 3.3 | 3.7 | dE | ||
| 90680 | 2 2 | 21.18 | 21.27 | 21.58 | 0.63 | 0.96 | 23.35 | 23.90 | 13 00 22.85 | 28 00 56.61 | 9272 | 90 | 2.9 | 5.8 | dE | ||
| 22069 | 3 3 | 22.38 | 22.02 | 22.25 | 0.84 | 1.48 | 23.24 | 23.03 | 13 00 34.77 | 28 04 32.88 | 117282 | 76 | Sp | ||||
| 80942 | x x | 21.89 | 21.26 | 21.43 | 0.24 | 0.85 | 22.49 | 22.13 | 13 00 39.94 | 28 00 24.08 | 276525 | 31 | |||||
| 10217 | x x | 22.11 | 21.49 | 21.66 | 0.43 | 1.18 | 22.51 | 21.48 | 13 00 40.36 | 28 04 54.48 | 310392 | 31 | |||||
| Failed | |||||||||||||||||
| (Poss. mem) | |||||||||||||||||
| 190565 | 2 1 | 22.00 | 23.44 | 23.64 | 0.73 | 0.69 | 23.77 | 23.09 | 12 59 32.75 | 27 59 26.34 | dE | ||||||
| 182496 | 3 3 | 22.35 | 22.66 | 0.81 | 23.51 | 12 59 53.74 | 27 58 21.64 | Sp | |||||||||
| 100420 | 1 1 | 22.20 | 22.84 | 23.53 | 0.82 | 24.09 | 24.17 | 13 00 06.89 | 28 01 55.89 | dE | |||||||
| 242067 | 2 x | 21.77 | 21.64 | 22.17 | 0.71 | 0.54 | 23.86 | 24.28 | 13 00 07.95 | 27 56 35.60 | dE | ||||||
| 30000 | 1 x | 22.12 | 21.35 | 21.61 | 0.73 | 0.88 | 23.40 | 23.92 | 13 00 11.78 | 28 05 05.00 | dE | ||||||
| 230751 | 2 1 | 21.61 | 23.51 | 23.67 | 0.70 | 0.85 | 23.76 | 22.68 | 13 00 16.24 | 27 54 44.07 | dE | ||||||
| 160792 | 3 2 | 22.17 | 22.19 | 22.62 | 0.69 | 0.84 | 23.83 | 24.12 | 13 00 18.93 | 27 58 00.55 | dE | ||||||
| 102885 | 1 1 | 21.86 | 21.94 | 22.49 | 0.79 | 0.95 | 23.89 | 24.44 | 13 00 20.27 | 28 02 02.15 | dE | ||||||
| 32799 | 3 3 | 22.03 | 22.37 | 22.62 | 0.77 | 1.32 | 23.09 | 22.73 | 13 00 21.79 | 28 04 41.48 | cE | ||||||
| 20411 | 3 x | 22.45 | 21.91 | 22.13 | 0.31 | 1.25 | 23.70 | 23.43 | 13 00 24.62 | 28 03 42.86 | |||||||
| 160003 | 2 x | 21.85 | 21.62 | 22.19 | 0.67 | 0.84 | 23.93 | 24.37 | 13 00 33.01 | 27 59 44.05 | |||||||
| Failed | |||||||||||||||||
| (Poss. bkg) | |||||||||||||||||
| 195768 | 4 3 | 22.47 | 21.68 | 21.82 | 3.43 | 23.34 | 21.50 | 12 59 40.73 | 27 57 02.92 | E | |||||||
| 161665 | 4 3 | 22.17 | 21.29 | 21.51 | 0.68 | 1.87 | 23.22 | 22.78 | 13 00 20.50 | 27 57 00.08 | Sp | ||||||
| 162881 | 4 3 | 22.13 | 21.76 | 21.93 | 3.47 | 23.48 | 22.41 | 13 00 28.55 | 27 58 59.20 | E | |||||||
| 151841 | 3 x | 22.36 | 22.33 | 22.44 | 0.67 | 0.56 | 23.46 | 23.89 | 13 00 43.79 | 27 59 00.02 |
Note. — Reddening is not taken into account here, but typical E.