Global 3D Simulations of Disc Accretion onto the classical T Tauri Star BP Tauri
Abstract
Recent spectropolarimetric observations of the classical T Tauri star BP Tau and analysis of its surface magnetic field have shown that the magnetic field can be approximated as a superposition of slightly tilted dipole and octupole moments with respective strengths of the polar magnetic fields of 1.2 kG and 1.6 kG (Donati et al. 2008, hereafter D08). We adopt the measured properties of BP Tau and model the disc accretion onto the star by performing global three-dimensional magnetohydrodynamic simulations. We observed in simulations that the disc is disrupted by the dipole component and matter flows towards the star in two funnel streams which form two accretion spots below the dipole magnetic poles. The octupolar component becomes dynamically important very close to the star and it redirects the matter flow to higher latitudes and changes the distribution and shape of the accretion spots. The spots are meridionally elongated and are located at higher latitudes, compared with the pure dipole case, where crescent-shaped, latitudinally elongated spots form at lower latitudes. The position and shape of the spots are in good agreement with observations.
The disk-magnetosphere interaction leads to the inflation of the field lines and to the formation of magnetic towers above and below the disk. The magnetic field of BP Tau is close to the potential inside the magnetospheric surface, where magnetic stress dominates over the matter stress. However, it strongly deviates from the potential at larger distances from the star.
A series of simulation runs were performed at different accretion rates. In one of them, the disk is truncated at which is close to the corotation radius, . However, the accretion rate, , is lower than that obtained from most of the observations. In a sample model with a higher accretion rate , the disk is truncated at , but such a state can not be a typical state for the slowly rotating BP Tau if it is in the rotational equilibrium. However, torque acting on the star is also small: it is about an order of magnitude lower than that which is required for the rotational equilibrium. We suggest that a star could lose most of its angular momentum at earlier stages of its evolution.
keywords:
accretion, accretion discs - magnetic fields - MHD - stars: magnetic fields.1 Introduction
Accretion-powered Classical T Tauri stars (CTTSs) are young low-mass stars which often show signs of a strong magnetic field (e.g., Basri, Marcy & Valenti 1992; Johns-Krull, Valenti & Koresko 1999) which is expected to have a complex structure (e.g., Johns-Krull 2007). The Zeeman-Doppler imaging technique has proven very successful in obtaining surface magnetic maps for many stars, and the external magnetic fields of the stars have been reconstructed from these maps under the potential approximation (Donati & Collier Cameron, 1997; Donati et al., 1999; Jardine et al., 2002, 2006; Gregory et al., 2010). The magnetic field plays a crucial role in disc accretion by disrupting the inner regions of the disc and channeling the matter onto the star, and hence it is important to know the magnetic field configurations in magnetized stars.
D08 recently observed the CTTS BP Tau with the ESPaDOnS and NARVAL spectropolarimeters and reconstructed the surface magnetic field from the observations. They have shown that the magnetic field of BP Tau can be approximated by a combination of dipole and octupole components of 1.2 kG and 1.6 kG, which are slightly (but differently) tilted about the rotational axis.
D07 analyzed the distribution of the accretion spots on the stellar surface and found spots at high latitudes, which cover about 8 per cent of the stellar surface (D08).
Further, D08 extrapolated the surface magnetic field to larger distances using the potential approximation, (i.e., assuming that there are no currents outside the star and hence the external matter does not influence the initial configuration of the field) and estimated the distance at which the disk should be disrupted by the magnetosphere so that the matter flowing towards the star in funnel streams produces the high-latitude spots. They concluded that this distance should be quite large, . However, this problem requires more complete analysis based on the MHD approach, where external currents can be taken into account, and the matter flow around the magnetosphere can be investigated self-consistently, taking into account interaction of the external plasma with the magnetic field.
In this paper, we investigate this problem using global three-dimensional MHD simulations. We solve the 3D MHD equations numerically in our simulation model to investigate the structure of the external magnetic field, accretion flows and location of accretion spots.
In our previous work, we have performed global 3D simulations of accretion onto stars with misaligned dipole fields (Romanova et al., 2003, 2004a; Kulkarni & Romanova, 2005), and aligned or misaligned dipole plus quadrupole fields (Long, Romanova & Lovelace, 2007, 2008). Recently, we were able to extend our method and to build a numerical model for stars with an octupolar component. The general properties of the model have been described in detail in Long, Romanova & Lamb (2010) and the model was applied to another CTTS, V2129 Oph, with a strong octupole field in Romanova et al. (2010) which has been compared with observations of V2129 (Donati et al. 2007, Donati et al. 2010).
In this paper, we apply our 3D MHD model of stars with complex magnetic fields (Long, Romanova & Lamb, 2010) to the CTTS BP Tau. We investigate disc accretion onto the star by adopting the measured surface magnetic fields (D08) and other suggested properties of this star. The surface magnetic field is modeled as a superposition of a 1.2 kG dipole and 1.6 kG octupole field, tilted by and with respect to the rotational axis and located at opposite phases (the phase difference is ). We also take into account other parameters of BP Tau: its mass (Siess, Dufour & Forestini, 2000), and radius (Gullbring et al., 1998). Its age is about 1.5 Myr (D08), and its rotation period is days (Vrba et al., 1986), which corresponds to a corotation radius of . The mass accretion rate derived from different observations varies between M⊙yr-1 (e.g. Gullbring et al. 1998) and M⊙yr-1 (Schmitt et al., 2005). We performed a series of simulation runs at different mass accretion rates in order to investigate the cases where the disk stops at different distances from the star. We also calculated the torque on the star and compared it with star’s age.
To understand the role of the octupole field in channeling the accreting matter, we compared our dipole plus octupole model of BP Tau with a similar model but with only the dipole component.
Thus, we focus on: (1) 3D MHD modeling of accretion flows around CTTS BP Tau modeled with dipole plus octupole moments; (2) comparisons of accretion properties observed in simulations with observations of BP Tau, such as the shape and distribution of hot spots, mass accretion rates and more; (3) deviation of the simulated magnetic field from the potential field.
Section §2 briefly describes the numerical model used in this work. The simulation results are shown in §3. We end in §4 with our conclusions and some discussion.
2 Model
The global 3D MHD model originally developed by Koldoba et al. (2002) and used for modeling stars with dipole fields (Romanova et al., 2003, 2004a) was modified to include higher order components (Long, Romanova & Lovelace, 2007, 2008; Long, Romanova & Lamb, 2010; Romanova et al., 2010) to simulate disc accretion onto stars with complex fields. The MHD equations are solved in a reference frame co-rotating with the star. A viscous term is incorporated into the MHD equations (only in the disc) to control the rate of matter flow through the disk. We use the prescription for viscosity with .
-
1.
Initial conditions. The simulation domain consists of a cold, dense disc and a hot, low-density corona, which are initially in rotational hydrodynamical equilibrium. The initial angular velocity in the disc is close to Keplerian. The angular velocity in the corona at any given cylindrical radius is set to be equal to that of the disk at that radius.
-
2.
Boundary conditions. At the inner boundary (the surface of the star), most of the variables are set to have free boundary conditions, . The initial magnetic field on the surface of the star is taken to be a superposition of misaligned dipole and octupole fields. As the simulation proceeds, we assume that the normal component of the field remains unchanged, i.e., the magnetic field is frozen into the surface of the star. At the outer boundary, free conditions are taken for all variables. In addition, matter is not permitted to flow into the region from the outer boundary.
Table 1: The reference values for CTTS BP Tau. The dimensional values can be obtained by multiplying the dimensionless values from simulations by these reference values. and the subsequent values below depend on . Reference Units – – – – (G) – – (cm) – – (cm s-1) – – (days) – – (G) (g cm-3) (yr-1) (erg cm-2s-1) (g cm2s-2) -
3.
Simulation region and grid. We use the “cubed sphere” grid introduced by Koldoba et al. (2002) (see also Fig. 1 in Long, Romanova & Lamb 2010). The resolution of the grid is to simulate the accretion onto BP Tau in a simulation domain of . We use a very high resolution near the star in order to resolve the complex structure of the octupolar component of the field.
-
4.
Magnetic field configuration. In our code we can model the magnetic field of the star by a superposition of three multipole moments ( for dipole, quadrupole and octupole respectively) which are tilted relative to the axis (which is aligned with the rotational axis ) at different angles , and have different angles between the plane and planes. For simplicity, is set to be 0, which means that the dipole moment is in plane. The general magnetic field configuration is discussed in greater detail in Long, Romanova & Lamb (2010). The details of the magnetic field configuration in our BP Tau model are discussed in §3.1.
-
5.
Reference units. The simulations are performed in dimensionless variables where are reference values. We choose the stellar mass , radius and the surface dipole field strength to build a set of reference values. The reference values are: length scale: ; velocity: ; time-scale: . The reference magnetic moments for dipole and octupole components are and respectively, where is the reference magnetic field. Hence, the dimensionless magnetic moments are: , , where the dipole and octupole moments and of the star are fixed. We take one of the above relationships; for example, the one for the dipole; to obtain
(1) Hence, at fixed , the reference magnetic field depends on the dimensionless parameter . The reference density and the mass accretion rate also depend on this parameter:
(2) (3) The dimensional accretion rate then is , where is the dimensionless accretion rate. One can see that the dimensional accretion rate depends on which we find from simulations, and the dimensionless parameter , which we use to vary the accretion rate. We change the dimensionless octupolar moment in same proportion so as to keep the ratio fixed. To find the ratio between the dimensionless moments, we use approximate formulae for aligned moments: and (see Long, Romanova & Lamb 2010) and obtain for BP Tau the ratio (where ).
Other reference values are: angular momentum flux (a torque) ; energy flux ; temperature , where is the gas constant; and the effective blackbody temperature , where is the Stefan-Boltzmann constant. Tab. 1 shows the reference values for CTTS V2129 Oph. In the subsequent sections, we show dimensionless values for most of the variables and drop the tildes(). However, we keep them in , , and because these are important parameters of the model.
-
6.
The magnetospheric radius. The truncation radius, , where the disc is truncated by the magnetosphere, could be estimated as (e.g., Elsner & Lamb 1977):
(4) where is the accretion rate and is the dipole magnetic moment; is a coefficient of order unity. For example, Long, Romanova & Lovelace (2005) obtained in numerical modeling of disc-accreting stars. For stars with known , , and dipole magnetic moment , such as BP Tau, the accretion rate determines where the disc stops and how the matter flows onto the star.
3 Modeling of accretion onto BP Tau
We performed a number of simulation runs at different accretion rates and observed that the disk is truncated at different radii. We choose as our main case the one in which the disk stops sufficiently far away, but at the same time the accretion rate is not very low. Below, we describe this case in detail. We also show the results at higher accretion rates for comparisons (see §3.7).
3.1 The modeled magnetic field
D08 decomposed the observed surface magnetic field of BP Tau into spherical harmonics and found that the field is mainly poloidal with only of the total magnetic energy in the toroidal field. The poloidal component can be approximated by dipole () and octupole () moments with and of the magnetic energy respectively. Other multipoles (up to ) have only of the total magnetic energy. D08 concluded that the magnetic field of BP Tau is dominated by a 1.2 kG dipole and 1.6 kG octupole tilted by and . The meridional angle between the and planes is approximately . In our model, we only consider the poloidal component.
We convert the above parameters into dimensionless values using our reference units and solve 3D MHD equations (see, e.g., Koldoba et al. 2002), in dimensionless form. One of the important parameters of the model is which is used to vary the truncation radius in the dimensionless model (and the accretion rate in the dimensional model, see eq. 1). We find the second dimensionless parameter from the relationship: (where ). This ratio is fixed for fixed values of the dipole and octupole components, kG and kG. From a number of simulation runs at different , we choose , to obtain a large enough magnetosphere as suggested by D08 and investigate this case in detail. Other parameters of the magnetic field configuration of BP Tau are , and .
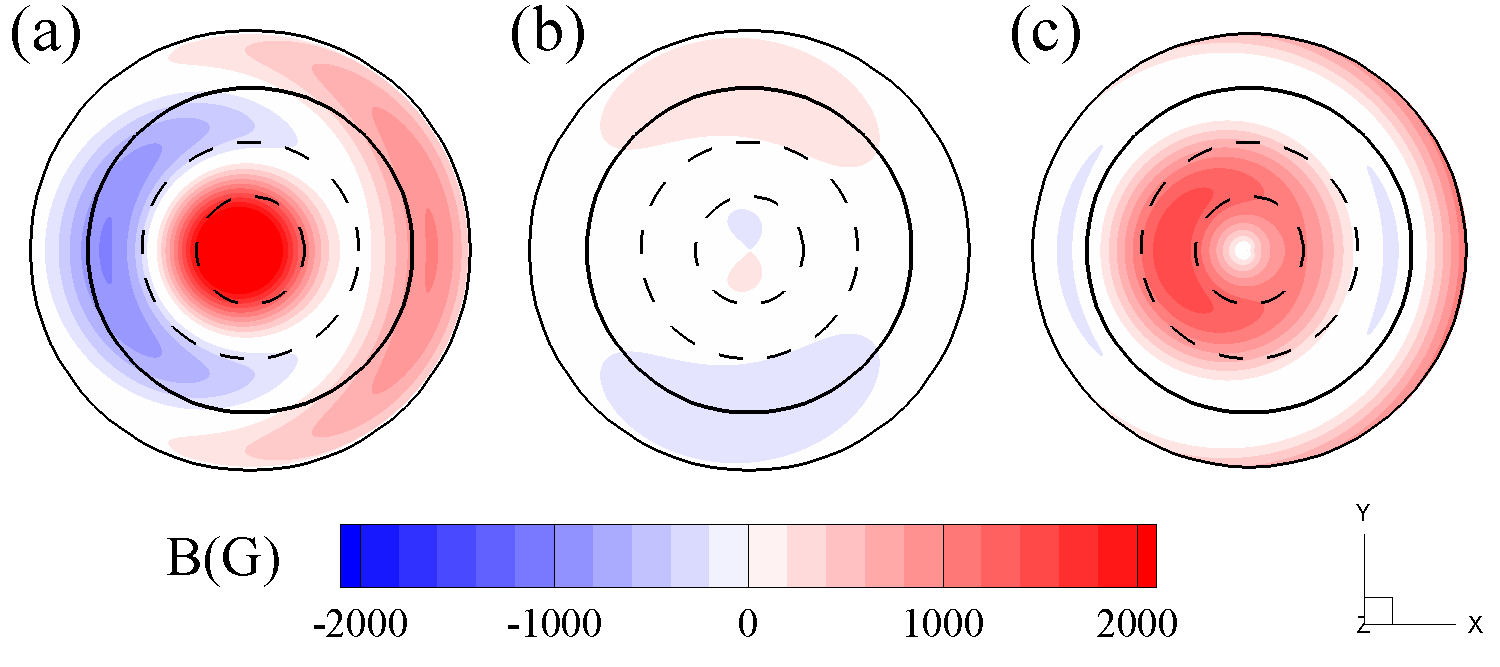
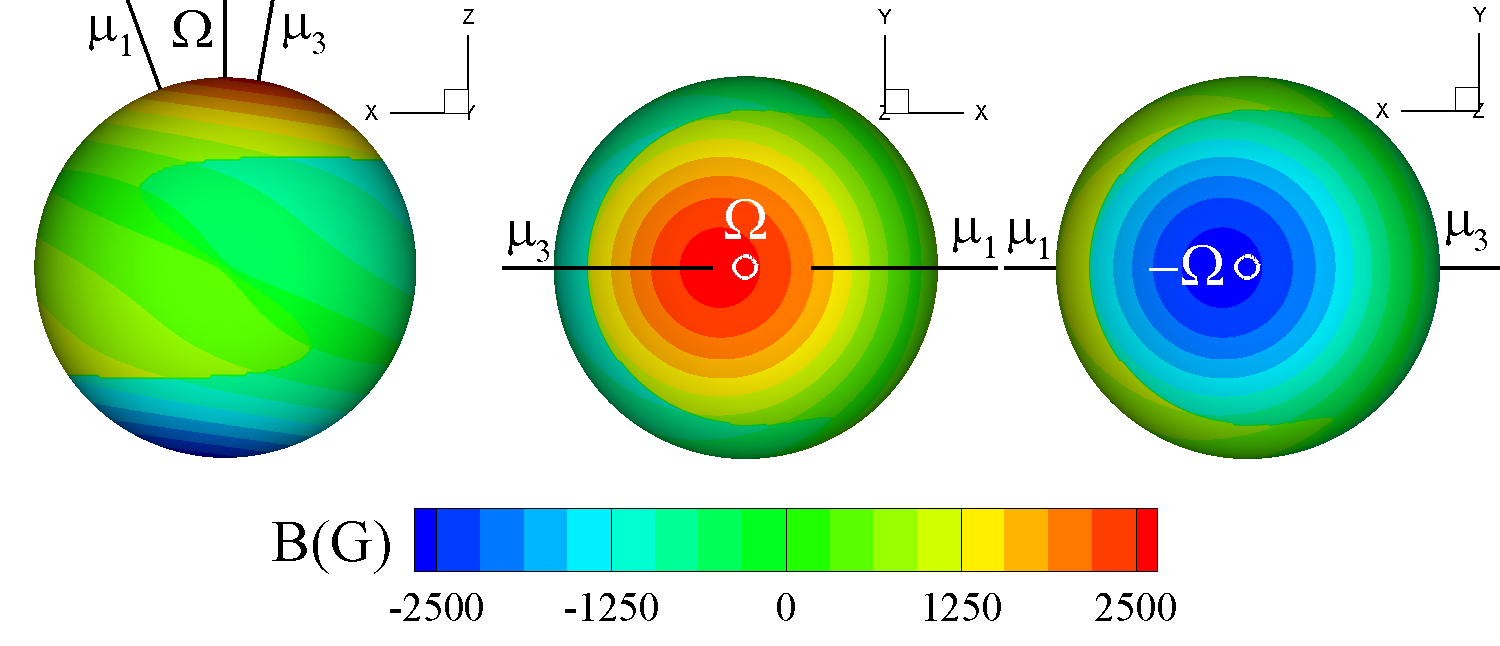
Fig. 1 shows the components of the simulated magnetic field (, and ) in the polar projection down to the latitude . One can see that the distribution of the radial component (left panel) is very similar to that obtained by D08 in two observational epochs of Dec06 and Feb06 (see Fig. 14, left panels of D08). In both cases, there is a strong positive pole at colatitudes of , a part of the negative octupolar belt at colatitudes of and a part of the positive octupolar belt at colatitudes of . The distribution of the meridional component, , (right panel of Fig. 1) is qualitatively similar to that of D08, though in the D08 plot the inner positive ring (red color in the plot) is weaker, while the negative ring (blue) is stronger compared with our model. The azimuthal component of the field is weak and shows a butterfly pattern of the negative and positive polarities in both the modeled and reconstructed fields.
Fig. 2 shows three-dimensional views of the magnetic field distribution at the surface of the star. It can be seen that there are two antipodal polar regions of opposite polarity where the field is strongest. They approximately coincide with the octupolar high-latitude poles and their centers are located close to the octupolar axis . Next to these regions, there are negative (blue) and positive (red) octupolar belts. Their shapes are more complex than those of the belts in pure octupole cases, where the belts are parallel to the magnetic equator (see Long, Romanova & Lamb 2010). This is because the dipole component strongly distorts the “background” octupolar field.
Although the octupole field is strongest at the surface of the star, it decreases more rapidly than the dipole field with distance from the star. To investigate the role of the dipole and octupole components in channeling the accretion flow, we find the radius at which the dipole and octupole fields are equal. For this, we assume that both magnetic moments are aligned with the rotational axis and take the magnetic field in the magnetic equatorial planes: and (see Eqn. 1 in Long, Romanova & Lamb 2010). Noting that the strengths of the field at the magnetic poles are and , and equating to , we find this radius:
| (5) |
Substituting kG and kG, we obtain . Note that both dipole and octupole moments are tilted about the rotational axis, and hence the above formula gives only an approximate value for this radius. We suggest that this radius should be located slightly above the surface of the star to explain the dominance of the octupolar field seen in Fig. 1 and Fig. 2.
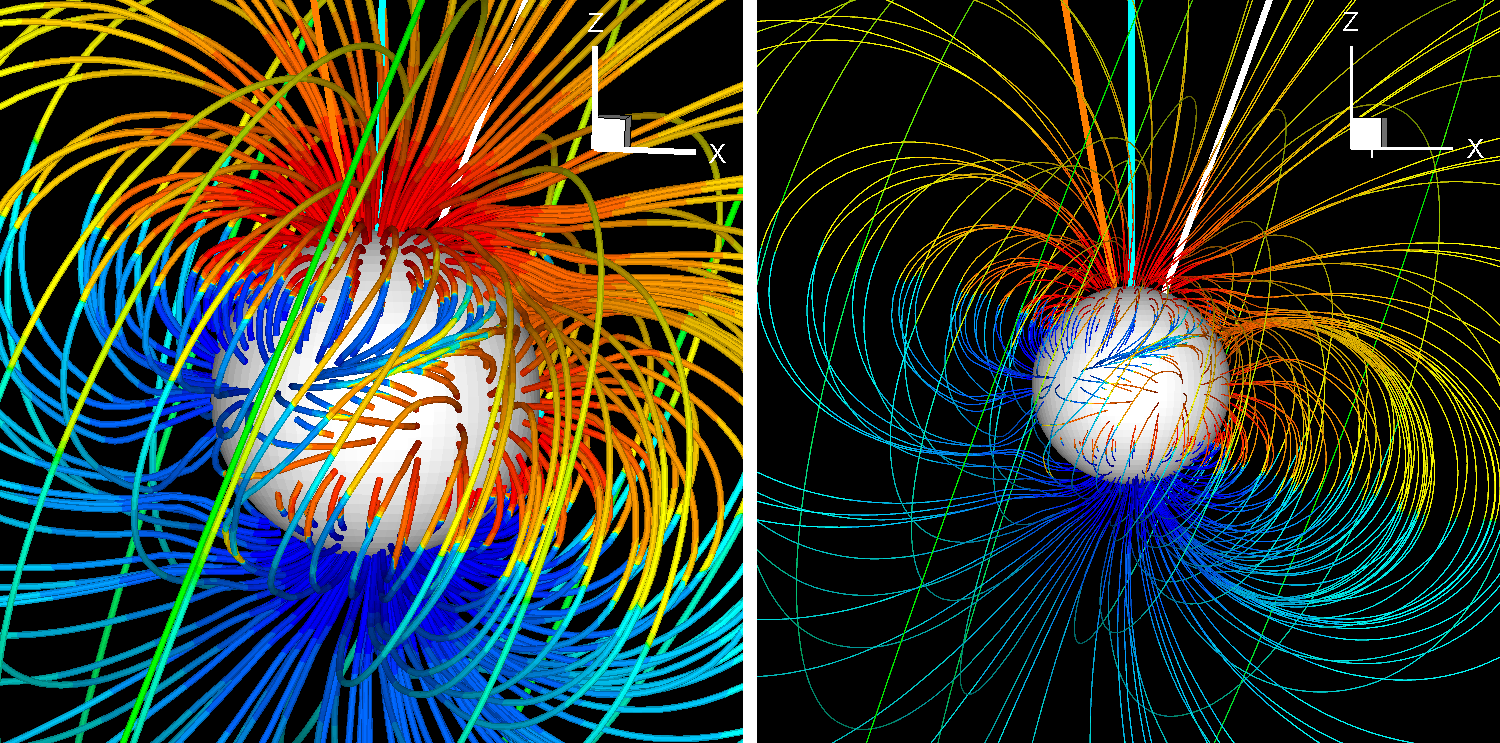
Fig. 3 shows the initial magnetic field distribution near the star in our model. One can see the octupolar field component in the vicinity of the star. It also modifies the dipole field up to distances of (above the surface of the star). The dipole field dominates in the rest of the simulation region. We should note that the dipole and octupole fields are equal at , but the octupole component disturbs the dipole field up to larger distances.
3.2 Matter flow and the magnetic field structure
Here, we show results of 3D MHD simulations of matter flow onto the dipole plus octupole model of BP Tau with parameters corresponding to the main case (, ) at time when the system is in a quasi-stationary state. Fig. 4 (middle panel) shows that the disk is truncated by the dipole component of the field, and matter flows towards the star in two ordered funnel streams. The right panel shows the density distribution in the equatorial plane. The left panel shows that the magnetosphere is disturbed by the disk-magnetosphere interaction.
Fig. 5 shows slices of the density distribution and projected field lines. Panel (b) shows the slice in the (or ) plane. One can see more clearly that the dipole component of the field is responsible for disk truncation and matter is channeled in the plane. Panel (c) shows that the disk is stopped by the magnetosphere in the plane. It is stopped at . Panel (d) shows that matter flow is complex in the equatorial plane, and that matter comes closer to the star in the plane.
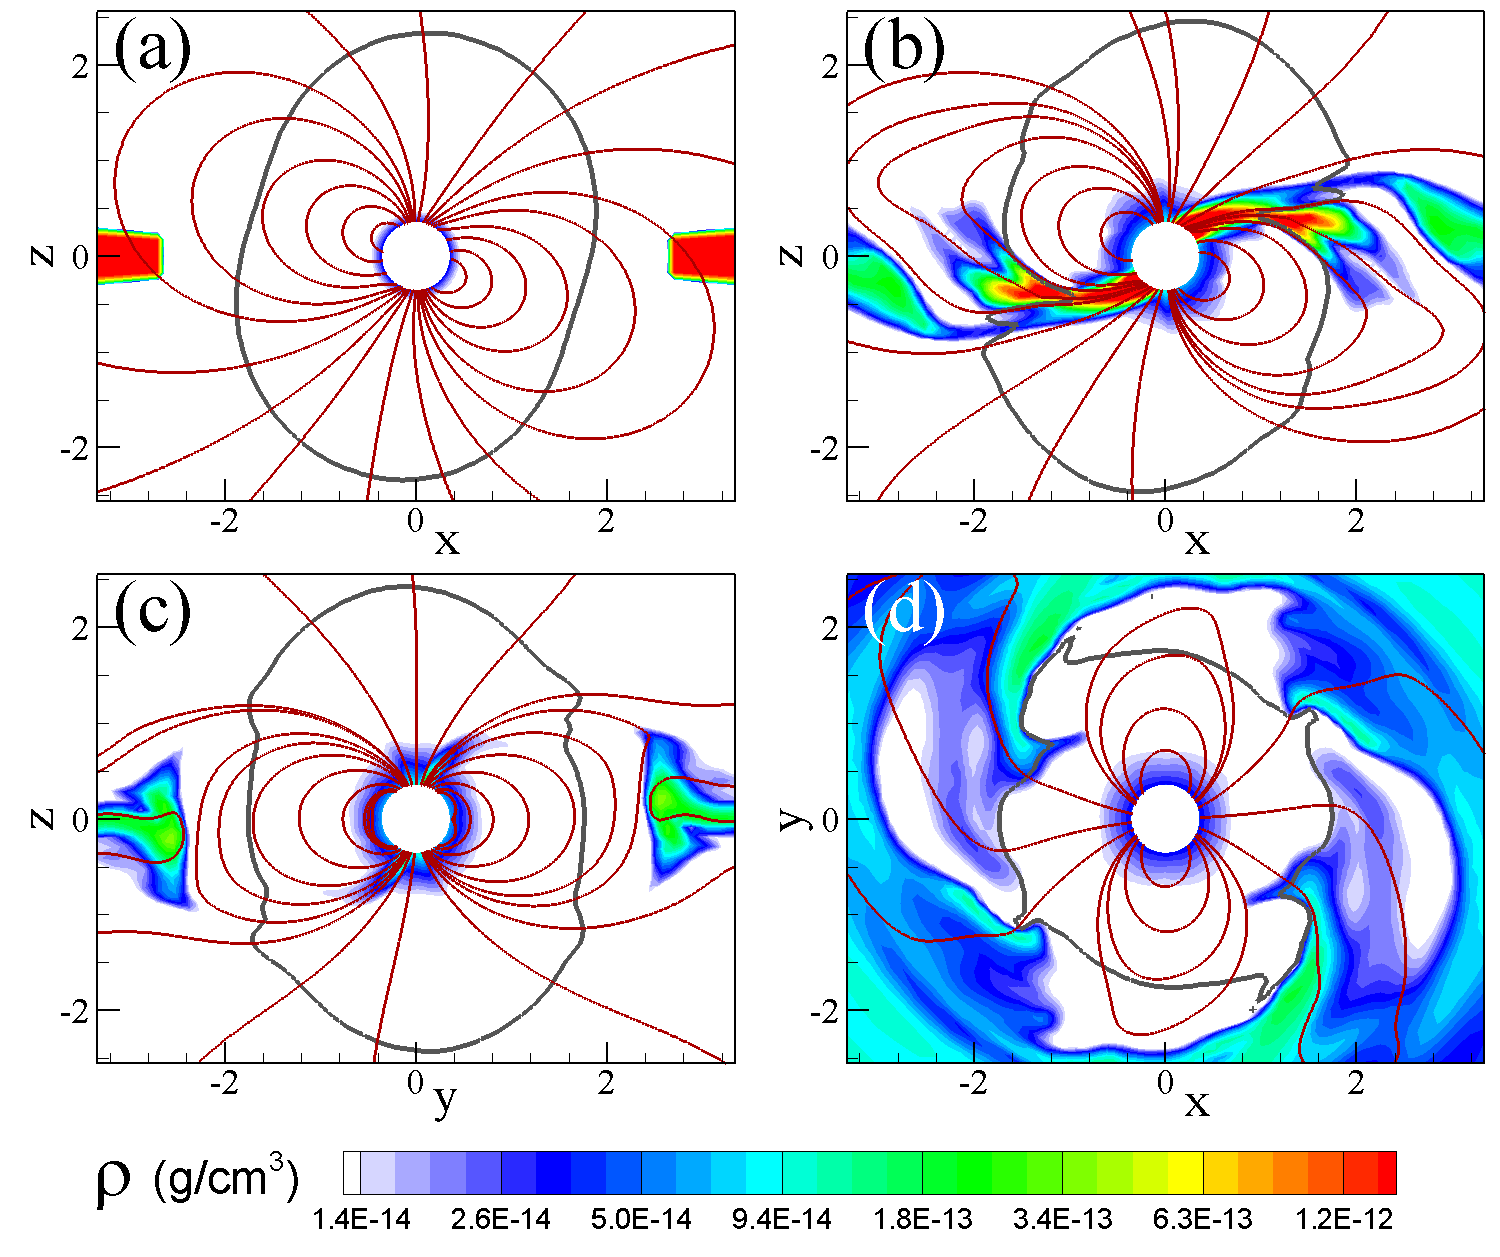
The gray line in Fig. 5 shows the magnetospheric radius, , the distance where the matter and magnetic stresses are equal: . The magnetic stress dominates at (Ghosh & Lamb 1978, 1979; Long, Romanova & Lamb 2010). Fig. 5 shows that which is smaller than the actual truncation radius . We should note that there are different criteria for the truncation radius and the above criterion usually gives the smallest truncation radius (see Bessolaz et al. 2008 for details).
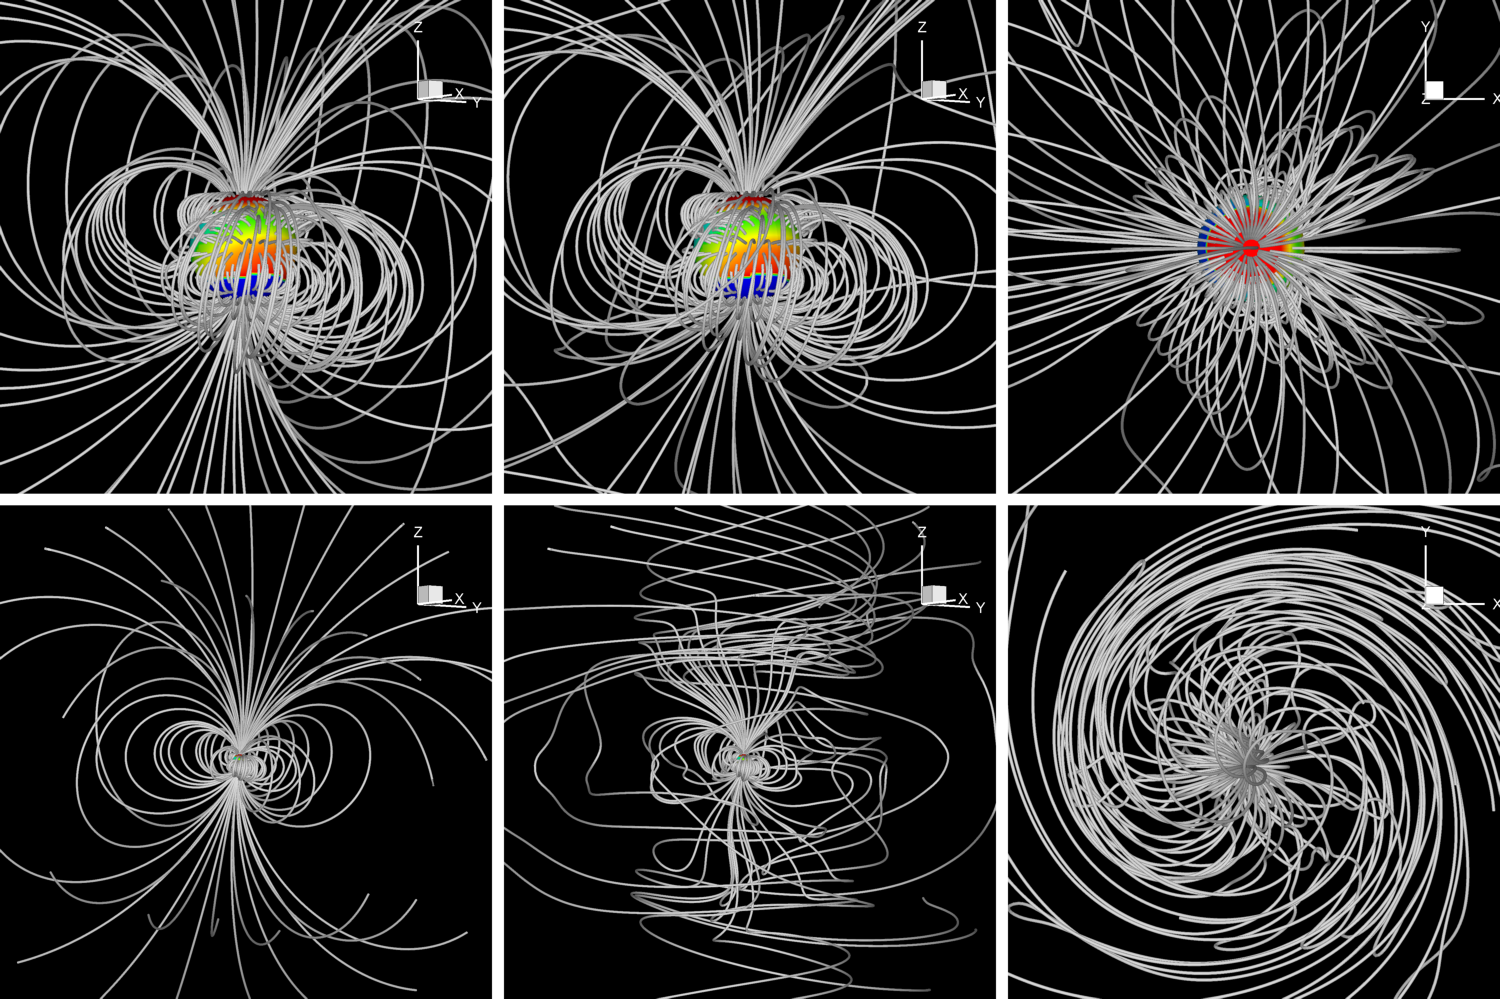
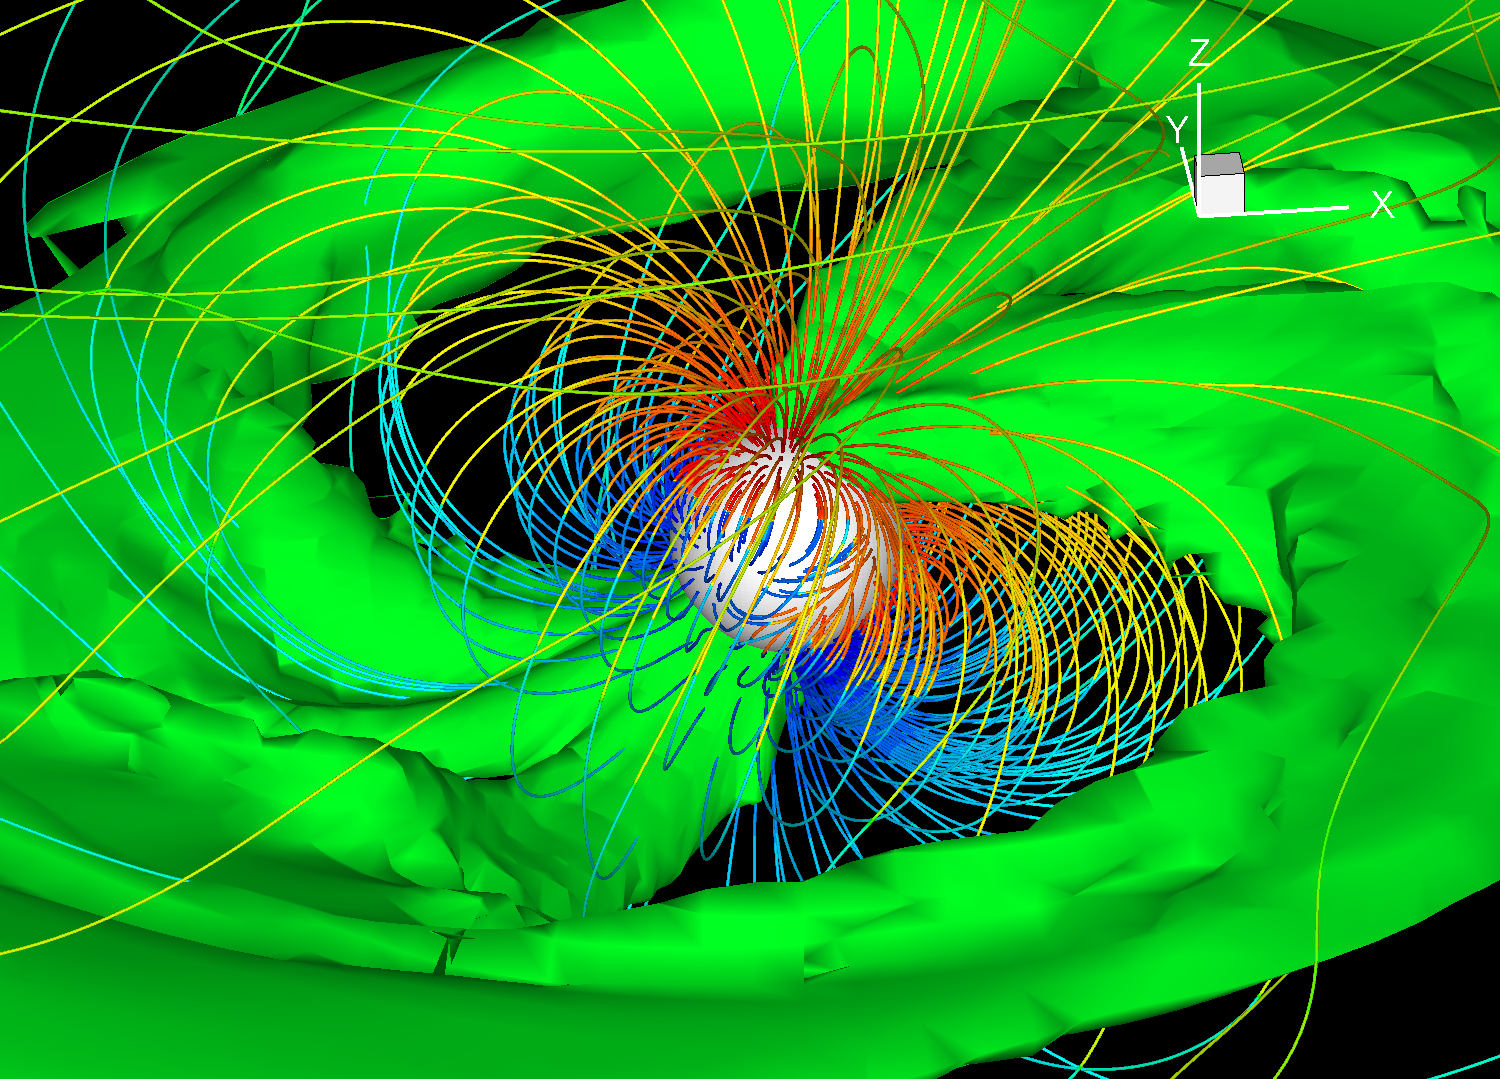
The external magnetic field evolves and deviates from the initial configuration due to disk-magnetosphere interaction. The left panels of Fig. 6 show the initial field distribution at which corresponds to the potential field produced by the star’s internal currents. As the magnetic field evolves, the currents produced by the motion of plasma outside the star become important and they change the potential magnetic field significantly. The middle and right panels show the evolved field from different directions at . It can be seen that on a large scale the magnetic field lines wrap around the rotational axis of the star and form a magnetic tower (e.g. Lynden-Bell 1996; Kato, Hayashi & Matsumoto 2004; Romanova et al. 2004b). This is a natural result of the magnetic coupling between the disk and star. The foot-points of the field lines on the star rotate faster than the foot-points threading the disk, which leads to differential rotation along the lines, and their stretching and inflation into the corona. The rotational energy is converted into the magnetic energy associated with these field lines. The evolved field structure on the large scale significantly differs from the potential field shown in the left panels.
In the vicinity of the star the situation is different. The middle top panel of Fig. 6 shows that the magnetic field distribution at is almost identical to the initial field distribution. We conclude that the potential approximation is valid only within the parts of the magnetosphere where the magnetic stress dominates, that is, at in our case. The field distribution strongly departs from potential at larger distances from the star.
3.3 Accretion spots in BP Tau and in the Model
D08 analyzed accretion spots from the observed brightness enhancements in chromospheric lines, such as Caii IRT and Hei which presumably form in (or near) the shock front close to the stellar surface. The random flaring component, as well as the time-variable veiling component which reflects variation of the intrinsic accretion rate were removed from the modeling. It was also suggested that matter flows in the vicinity of the strong magnetic field and hence Zeeman-splitting features were used for analysis.
The corresponding maps of the local surface brightness are shown in Fig. 9 of D08 for two epochs of observations (Feb06 and Dec06). It can be seen that in both plots there is one bright spot located at colatitudes of and centered at , while a lower-brightness area spreads up to a colatitude of . In both cases the spots are elongated in the meridional direction. The Feb06 spot also has an antipodal spot of weaker brightness and of similar shape. The accretion filling-factor is shown in Fig. 13 of D08. It shows a spot located at colatitudes of and centered at .
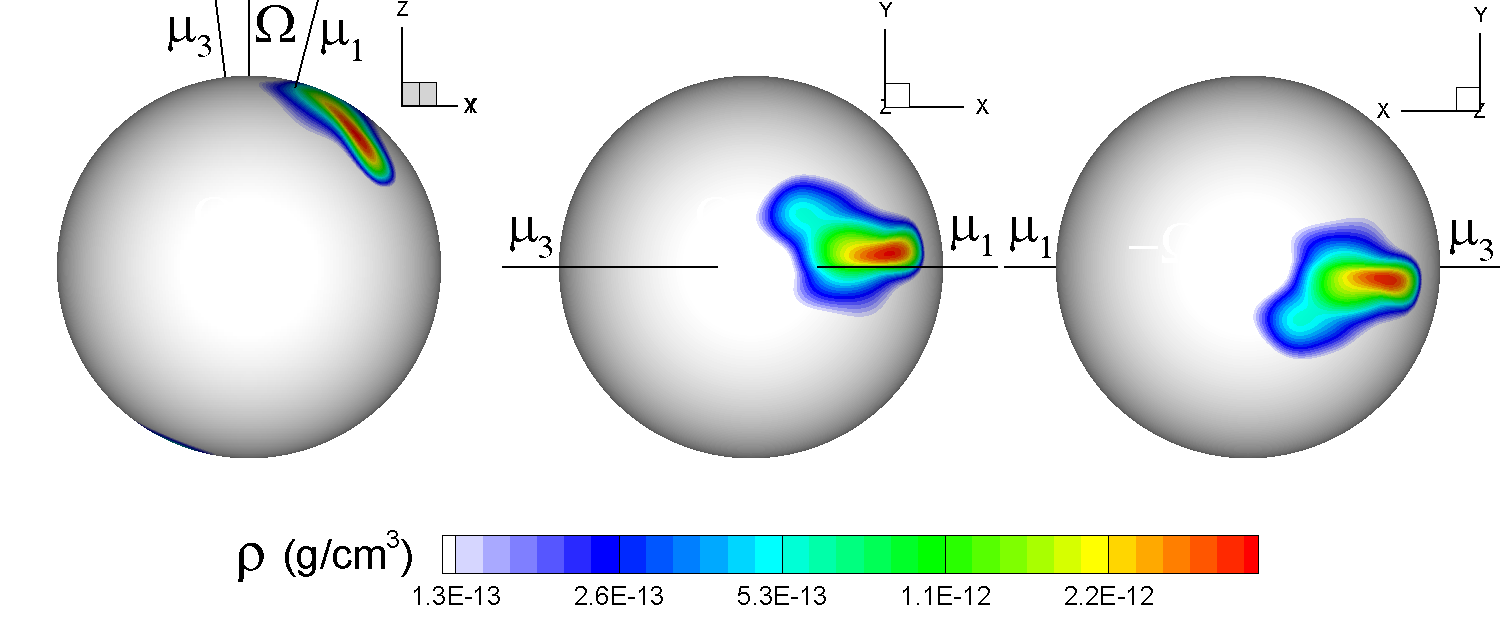
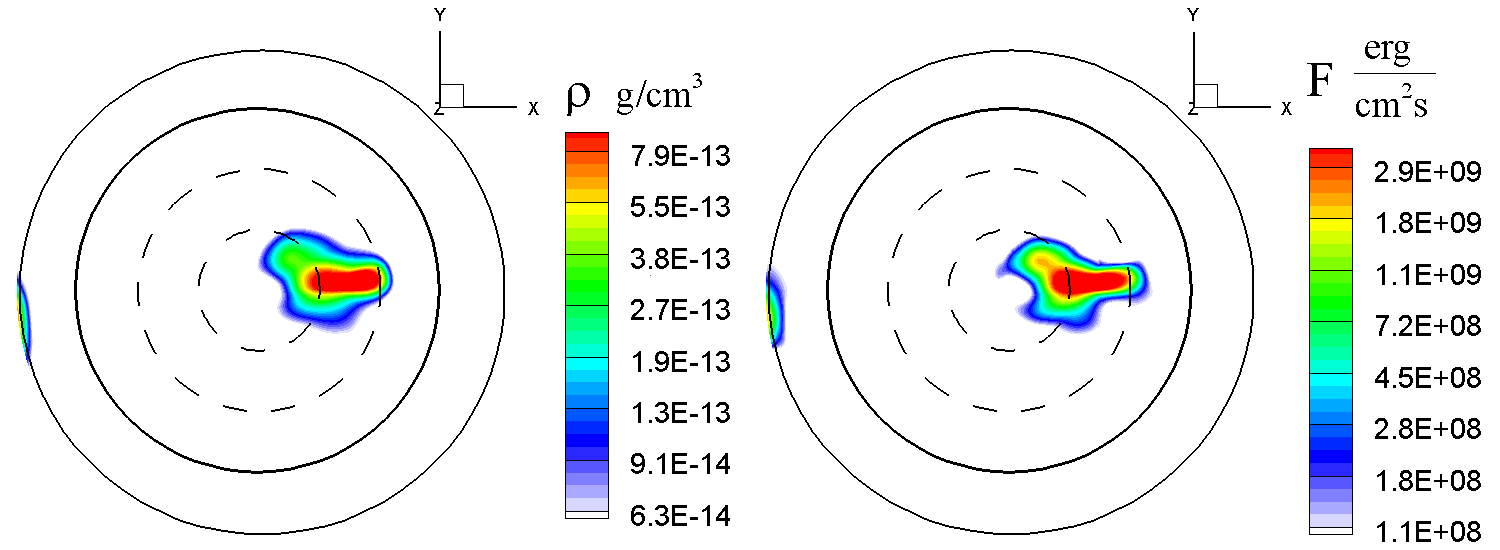
In our simulations the spots represent a slice of density/energy taken across the funnel stream at the surface of the star. Hence, the spots show the distribution of these values across the stream (Romanova et al., 2004a). The physics of disk-magnetosphere interaction is expected to be more complex (e.g., Koldoba et al. 2008; Cranmer 2008, 2009; Brickhouse et al. 2010). However, this more complex physics strongly depends on the properties of funnel streams. Hence we call these spots “accretion spots” and show the density distribution in spots and also the energy flux: distribution (right panel) at , where is the velocity of the star.
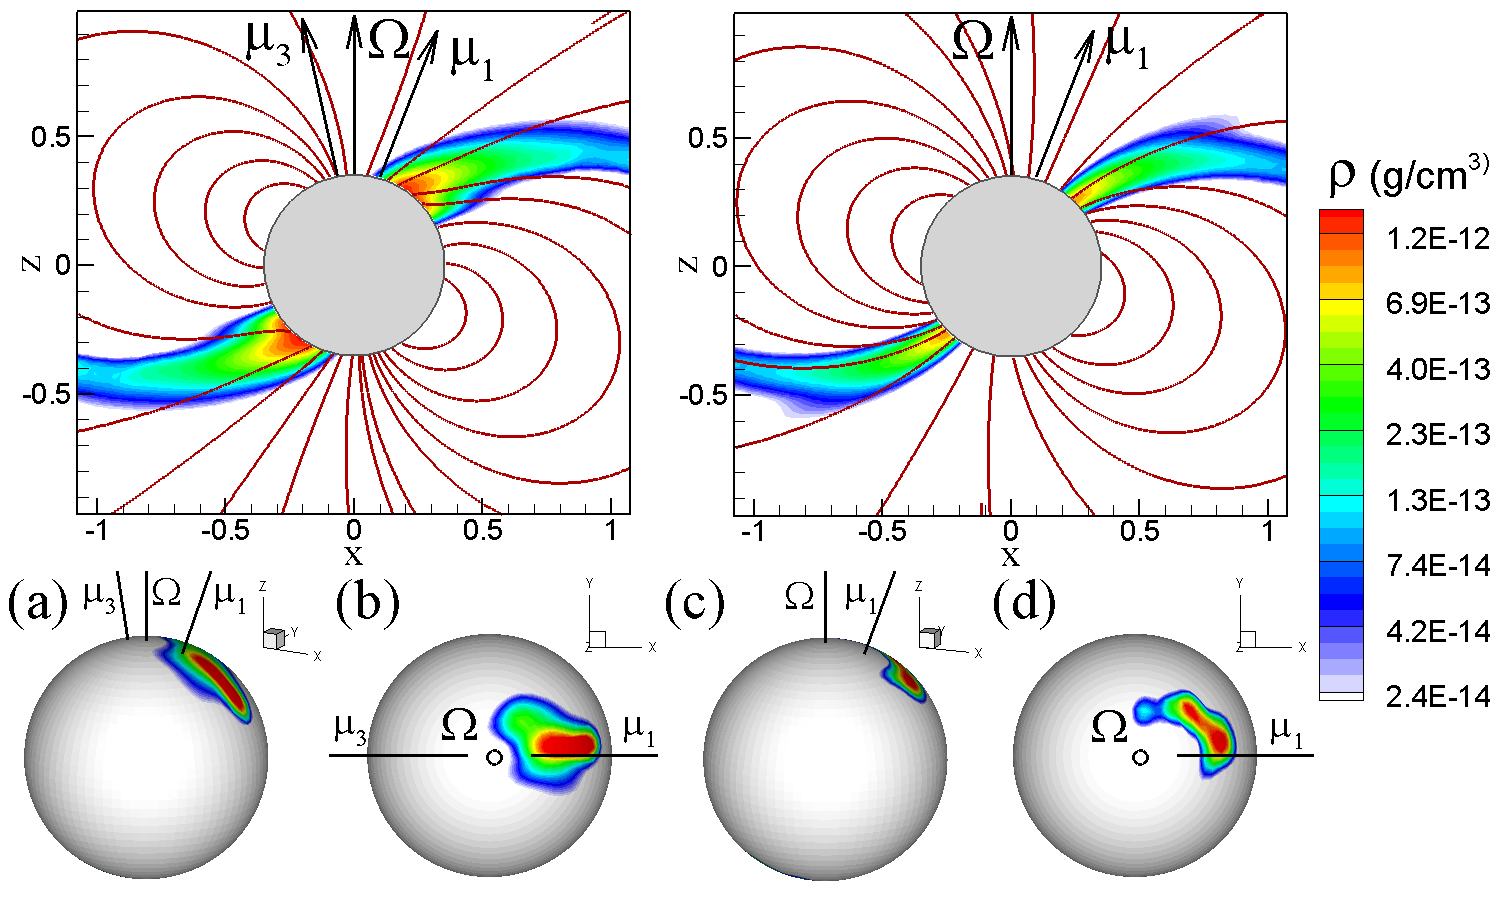
Fig. 7 shows the density distribution at the surface of the star at . It can be seen that there are two antipodal spots which are centered in the plane slightly below the dipole magnetic pole. The spots are elongated in the meridional direction (unlike the spots in a pure dipole configuration, see also §3.4).
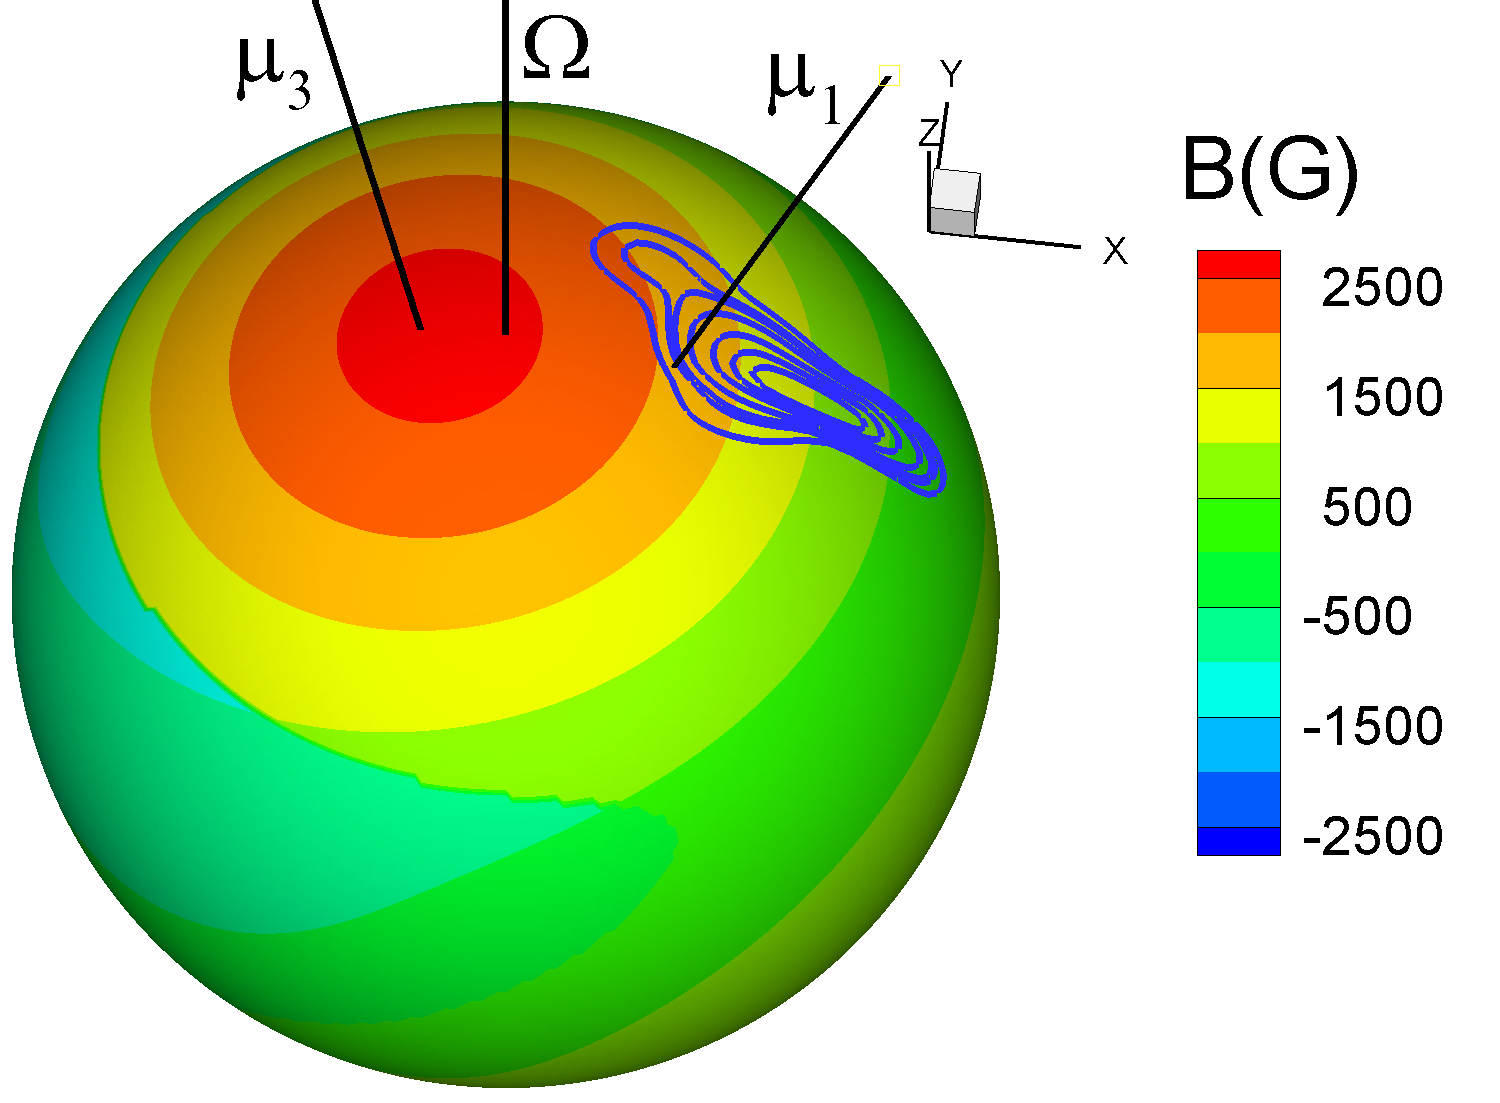
Fig. 8 shows the density distribution in the spot (contour lines) overlaid on top of the magnetic field distribution. It can be seen that the spot is located near and below the dipole magnetic pole and hence its position is strongly influenced by the dipole component. The spot is located far away from the main, high-latitude magnetic pole, dominated by the octupolar component. We conclude that this low-latitude position of the spot results from the fact that the dipole field governs the matter flow, and only near the star, the octupolar component “comes to play” and the octupolar field redirects the spot’s position towards slightly higher latitudes, and changes the spot’s shape.
Fig. 9 shows a polar projection of the density distribution (left panel) and energy flux. It can be seen that the accretion spot is centered near the latitude of and spreads between latitudes of and . These spots have a close resemblance to the spots observed by D08. In both cases, the spots are stretched in the meridional direction and are located between latitudes of and . Analysis of our spots at different moments of time has shown that the positions of the spots vary only slightly with time (within 0.1 in phase). However, the spots observed by D08 (their Fig. 9) are located at different phases. Feb06 observations show the main spot located at a higher phase compared with our spot, with a phase difference of 0.15-0.2. This is quite good agreement, considering the fact the D08 method of the dipole moment phase reconstruction has an error in phase of 0.1-0.2 or larger. The phase difference is higher in the Dec06 observations where the simulated and observed spots are almost in anti-phase.
To investigate the role of the dipole and octupole phases in the spot’s position, we considered a few “extreme” cases, where the phase difference between the dipole and octupole moments is , and (we have a phase difference of in the main case). We observed that the accretion spot is similar in shape in all these cases, but is located at the phase corresponding to the phase of the dipole (in the plane). We conclude that the phase of the accretion spots on the surface of the star gives a strong indication of the dipole component’s position.
3.4 Comparison with a pure dipole model
To understand the role of the octupolar field component in our dipole plus octupole model of BP Tau, we investigate a similar model but with zero octupolar field, that is kG, and .
Fig. 10 shows slices of the accretion flow in the dipole plus octupole model (left panel) and pure dipole model (right panel). One can see that the flow is wider in the dipole plus octupole model, because near the star the octupole field influences the matter flow and redirects it in such a way that some matter flows towards the direction of the octupolar magnetic pole located at anti-phase with the dipole pole. The streams are narrower in the case of the pure dipole field.
The bottom panels show that the accretion spots in the dipole plus octupole model are meridionally elongated, while in the dipole model they have their typical crescent shape and are elongated in the azimuthal direction (as usually seen in the pure dipole cases, e.g. Romanova et al. 2003, 2004a).
We conclude that in BP Tau, the relatively weak octupolar magnetic field which dominates only very close to the surface of the star, strongly influences the shape and position of the accretion spots. This influence is not as dramatic as in another T Tauri star, V2129 Oph, which has a much weaker dipole component, and where the octupolar field splits the funnel stream into polar and octupolar belt flows (Romanova et al., 2010).
3.5 Area covered with spots

.
D08 calculated the fraction of the star covered with visible chromospheric spots on BP Tau and concluded that they are spread over up to about of the stellar surface, and cover about of the surface, assuming one-fourth of each surface pixel is subject to accretion (see Figs. 9 & 13 in D08). In this paper we are interested only in the area of the spots spreading that is in the area covered by the funnel stream, and hence we take the larger value (8%). Figs. 9 and 13 of D08 show that the actual size of the spots depends on the brightness. Sometimes we take the brightest parts of spots (4-5)% and neglect the dimmer parts for comparison. In observations, the spot’s coverage is calculated for one (visible) spot versus the whole area of the star, while in the simulations we take into account both spots, and hence the area in simulations is twice as large compared with observations.
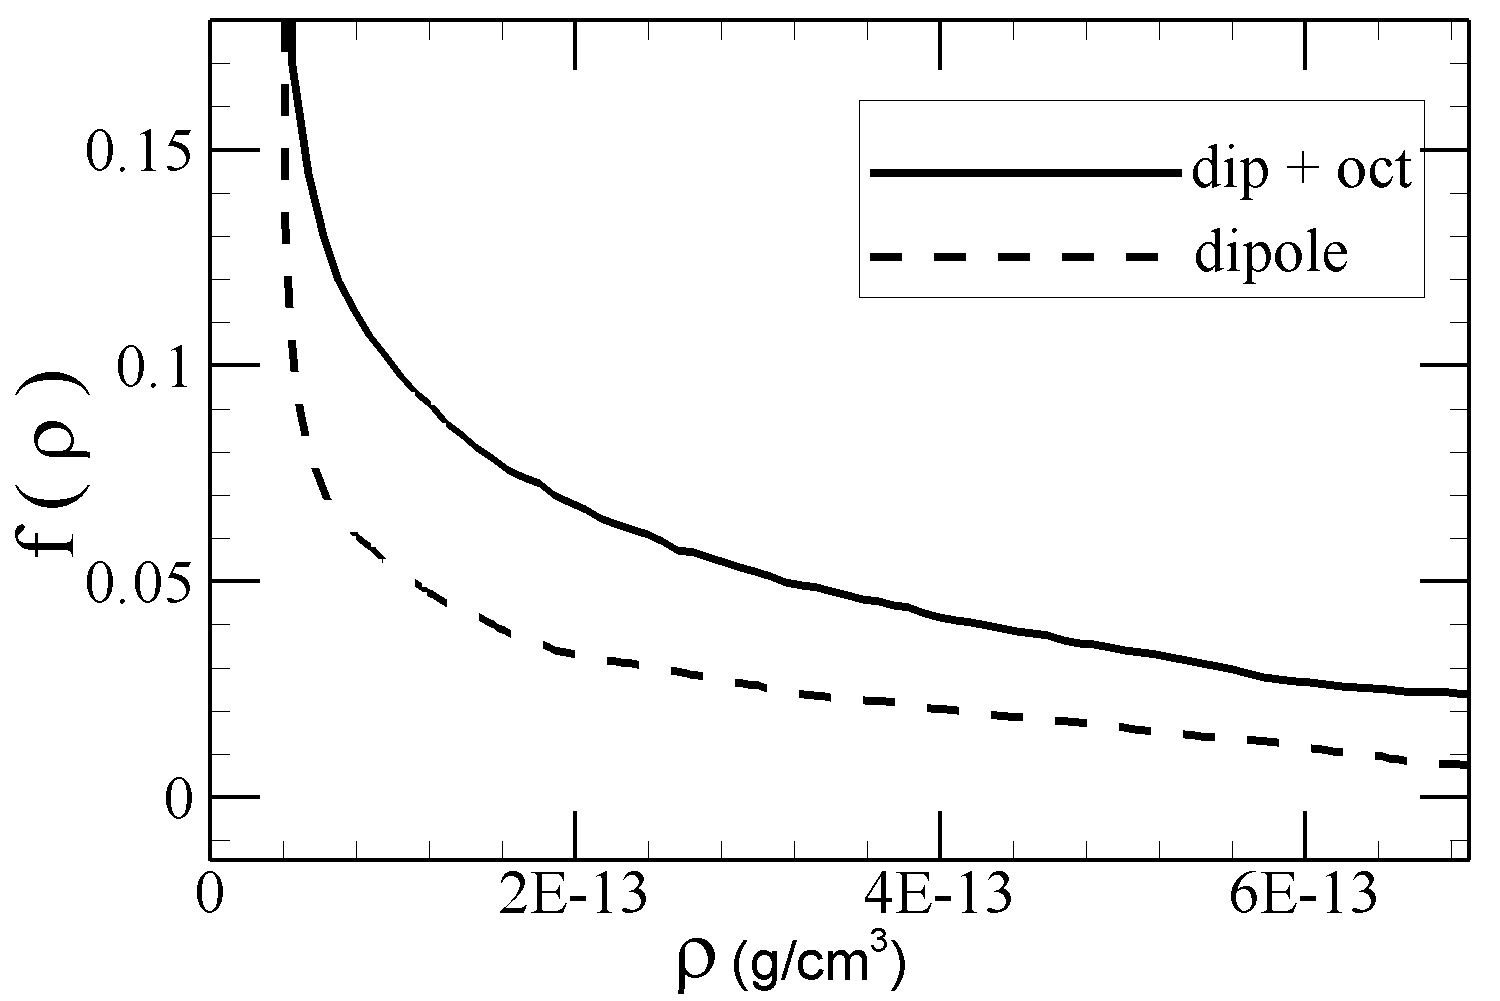
We observed from the simulations that the size of the accretion spot depends on the density (or energy) cutoff. We calculate the fraction of the star covered with the spots as , where is the area covered with (all) spots of density or higher. Fig. 11 shows the distribution of versus for the dipole plus octupole model and dipole model of BP Tau. It can be seen that for almost all chosen density levels, the accretion spots occupy a larger surface area in the dipole plus octupole model than in the dipole model. This result is in good agreement with that obtained from Fig. 10.
We choose several cutoff densities and show the spots in Fig. 12. One can see that in both simulations and observations, spots cover different areas depending on the brightness/energy flux levels ranging from up to in simulations (for two spots). In both observations (see Fig. 9 of D08) and simulations (see our Fig. 10), the brightest parts of spots are located at .
It was predicted that the area covered by spots in the case of complex magnetic fields should be smaller than in the pure dipole case (e.g., Mohanty & Shu 2008; Gregory et al. 2008, see also Calvet & Gullbring 1998). This paper and our previous work (Long, Romanova & Lovelace, 2008) show that the area could show a complex trend for mixed dipole and multipole configurations, depending on how the multipole field redirects the accretion flow.
3.6 Accretion rate in BP Tau and in our model
The mass accretion rate of BP Tau obtained from observations is not uniquely determined, and different authors give different results. For example, Gullbring et al. (1998) estimated the mass accretion rate to be using the luminosity of , where is the inner radius of the disk. Other estimates of the mass accretion rate include (Valenti & Johns-Krull, 2004), (Schmitt et al., 2005). Calvet et al. (2004) compared the mass accretion rates of intermediate-mass, , and low-mass, , T Tauri stars and concluded that the average mass accretion rate for intermediate-mass T Tauri stars is about , while for low-mass CTTSs (like BP Tau) it is about 5 times smaller, that is, .
We obtained from simulations the dimensionless accretion rate of . Using the reference value for from Tab. 1, (calculated for ), we obtain the dimensional accretion rate: . This value is higher than the accretion rate suggested by Schmitt et al. (2005) but lower than the other estimates. Given that BP Tau has the low mass of (D08) (or Gullbring et al. 1998), the mass accretion rate from our simulation models may still be in the reasonable range according to the Calvet et al. (2004) analysis and discussion.
Here, we should note that the “main model” considered above is one of the suggested models, where the disk is truncated at large distances. Below, we discuss additional models, where the disk is truncated at smaller distances and the accretion rate is higher.
3.7 Modeling of BP Tau at higher accretion rates
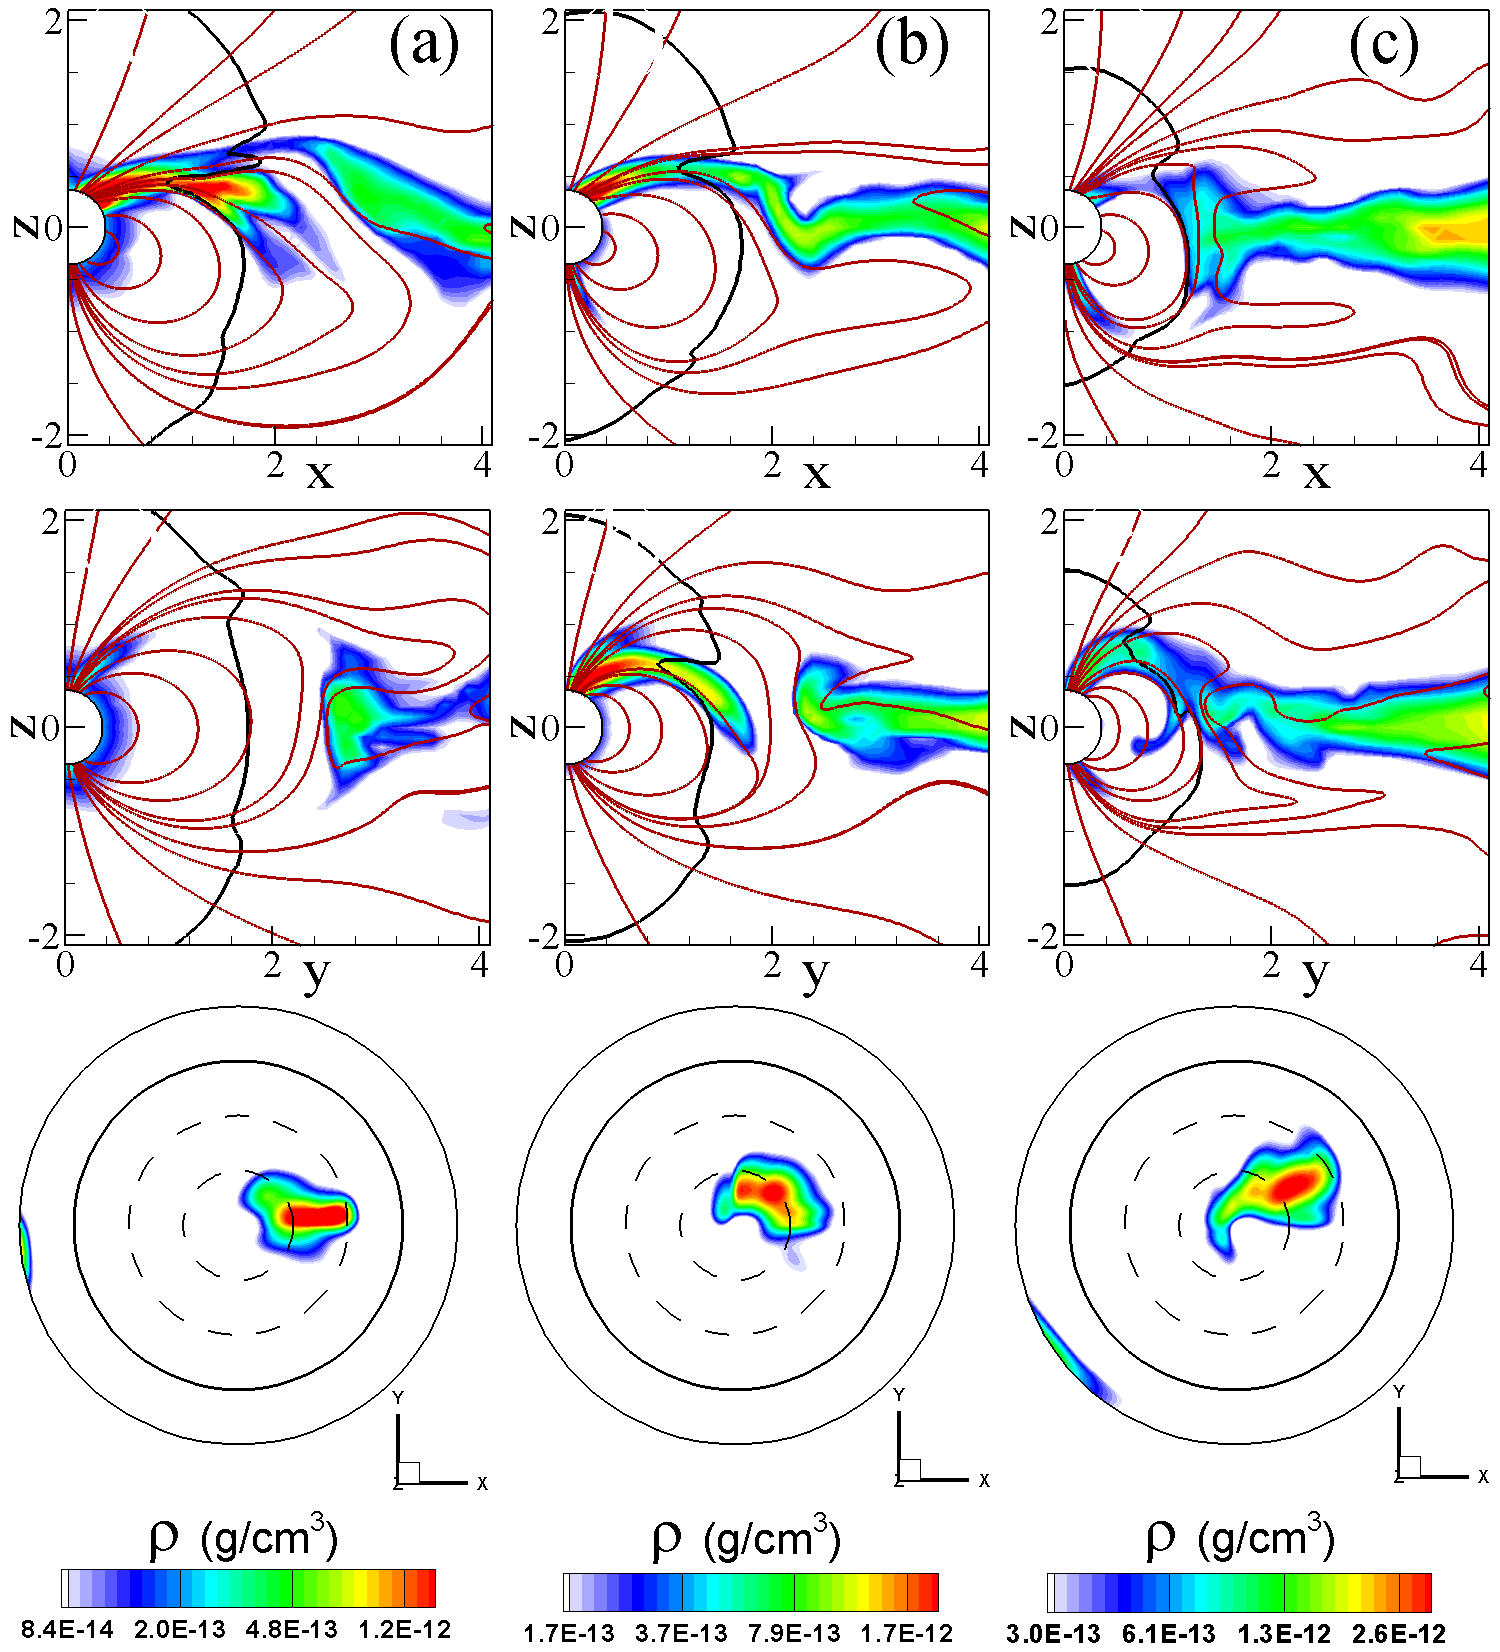
We performed two additional simulation runs at higher accretion rates (at smaller values of parameter ) keeping the ratio between the dipole and octupole moments fixed, . The parameters of these new models are the following: and .
Fig. 13 (middle and right panels) shows the matter flow and accretion spots for these two cases, while the left panel shows results for the main model () for comparison. One can see that in the new models, the disk is truncated at smaller distances from the star: (for ) and (for ). The bottom panels of Fig. 13 show that when the disk comes closer to the star, the spots are still at high latitudes, though they become longer in the meridional direction. This is probably because the octupolar component has a stronger influence on the spots: the spots move closer to the octupolar magnetic pole. Note that no octupolar ring spots appear (like in V2129 Oph, see R10). This is probably because the disk truncation radius is still far away from the area where octupole has a strong influence on the flow, which is closer to the star. It is interesting to note that in the pure dipole case, the spots move towards lower latitudes when the disk comes closer to the star. Here, we see the opposite: parts of the spots move to higher latitudes, because the octupolar component becomes more significant at smaller truncation radii.
The dimensionless mass accretion rate which we obtain from our simulations is (for ) and (for ). We take reference values for different from Tab. 1 and obtain corresponding dimensional accretion rates (see Tab. 2) which are yr-1 and yr-1 respectively. We see that the accretion rate for is high and close to many of the observed values. However, the disk comes too close to the star and the truncation radius is much smaller than the corotation radius (), which would mean that the star is not in the rotational equilibrium state, which is unlikely. The model with is similar to the main model: the disk is truncated far away and the accretion rate is twice as high, but still it is lower than many values given by observations. This model is slightly better than the “main” model.
In the case of a pure dipole, we obtain from simulations and yr-1. 2 summarizes the results obtained in our simulation models and some observational properties of BP Tau for comparison.
| Models | (yr-1) | (g cm2s-2) | (yr) | |||
|---|---|---|---|---|---|---|
| D08 & other measurements | – | – | ||||
| Model () | (spin-down) | |||||
| Model () | (spin-down) | |||||
| Model () | + | (spin-up) | ||||
| Model () | (spin-down) |
3.8 Angular momentum transport
We calculated torque on the surface of the star for the above three models. The torque associated with the magnetic field is about 10-30 times larger than the torque associated with matter and thus dominates (see also Romanova et al. 2002, 2004a; Long, Romanova & Lovelace 2007, 2008). The dimensionless torque obtained from simulations, , varies in time around some average value. Tab. 2 shows these values and values corresponding to these variations. We observed in simulations that the torque is negative in most of the models because the disk is truncated at the distances comparable with the corotation radius and therefore the star spins-down. In a model with , the disk is truncated at the distance of and it spins the star up. To estimate the dimensional torque, , we take the largest absolute value of from Tab. 2 and take into account the reference values of from Tab. 1. Tab. 2 shows the dimensional torque.
We estimate the time-scale of spinning-down of BP Tau. The star’s angular velocity is (at period days) , its angular momentum is , where (we take for estimations). The spin-down time-scale, , was estimated for different models and is shown in Tab. 2. One can see that the spin-up/down time-scale is about an order magnitude larger than the age of BP Tau ( years, see references in D08). Hence, the torque obtained in simulations is not sufficient to regulate the spin of the star at the considered epoch. It is possible that a star lost most of its angular momentum at the earlier stages of its evolution. Note that similar low-torque situation has been observed in modeling of another CTTS, V2129 Oph.
4 Conclusions and Discussions
We performed global 3D MHD simulations of accretion onto a model star with parameters close to those of the classical T Tauri star BP Tau, and with the magnetic field approximated with a superposition of slightly tilted dipole and octupole moments with polar magnetic fields of 1.2kG and 1.6kG which are in anti-phase (D08). In this star the dipole field dominates almost up to the surface of the star and determines the majority of the observational properties.
We performed a number of simulation runs for different truncation radii of the disk, and chose one of them where the disk is truncated at which is sufficiently close to the corotation radius and investigated this case in greater detail. We observed that the dipole component of the field truncates the disk, and matter flows in two funnel streams towards the dipolar magnetic poles. However, near the star the flow is slightly redirected by the octupolar component towards higher latitudes, and this affects the shape and position of the accretion spots: the spots are stretched in the meridional direction and are centered at higher latitudes compared with spots in the pure dipole case, which are latitudinally-elongated (crescent-shaped) and are centered at lower latitudes.
The spots are located near the plane, where both the dipole and octupole moments are situated, and are in anti-phase. Experiments with different relative phases between the dipole and octupole moments have shown that the spots are always located in the meridional plane of the dipole moment.
The spot’s position slightly varies in phase with the accretion rate, but the variation is small, about at the most. Note that in the pure dipole case, the spot may rotate about the magnetic pole (and hence may strongly change the phase) if the dipole is only slightly tilted about the rotational axis, (Romanova et al. 2003, 2004a; Bachetti et al. 2010). However, in BP Tau, the tilt is larger, and an octupolar component is present and is significant near the star. Both factors lead to the restriction of such a motion.
The meridional position and shape of spots observed in simulations is similar to those observed by Donati et al. (2008) (see their Fig. 9 for brightness distribution in spots reconstructed for the Dec06 or Feb06 epochs). However, they are at different phases compared with our spots. This may be connected with the relatively low accuracy of the phase reconstruction of the dipole component from the surface magnetic field, or some other reason.
The accretion rates obtained in different models are in the range of yr-1. It is lower than most of the values derived from observations which vary in the range of and solar mass per year and depend on the approaches used for the derivation. The smallest accretion rate obtained in simulations corresponds to the case where the disk is truncated at , and a star slightly spins down, while the largest to the case where and a star spins up. We should note that at larger accretion rates, say at solar mass per year, the disk will come very close to the star, and the torque would be much stronger. Such a state seems unlikely. Hence, if the accretion rate is very high, then we should suggest that the dipole component should be larger than that derived by D08.
The torque obtained in simulations is small and the time-scale of the spinning-up/down is an order of magnitude smaller compared with the age of BP Tau. This torque is not sufficient to support a star in the rotational equilibrium state, where a star spins up or spins down depending on the accretion rate but has a zero torque on average (e.g., Ghosh & Lamb 1979, Königl 1991, Cameron & Campbell 1993, Long, Romanova & Lovelace 2005). We assume that this small torque matches a small accretion rate obtained in simulations because the torque generally correlates with the accretion rate (e.g., Romanova et al. 2002).
We suggest that a star may lose the majority of its angular momentum at earlier stages of its evolution due to the “propeller” effect (e.g., Romanova et al. 2005; Ustyugova et al. 2006), stellar winds (Matt & Pudritz 2005, 2008), or by some other mechanism.
Earlier, we performed global 3D MHD simulations of accretion onto V2129 Oph (Romanova et al., 2010) which have shown that in the case of a strong octupolar component, parts of the octupolar belt spots can be visible and can dominate at sufficiently high accretion rates. This is not the case in BP Tau, where the octupolar component dominates only in the close vicinity of the star.
Disk-magnetosphere interaction leads to inflation of the external field lines and formation of a magnetic tower. Simulations show that the potential approximation used in extrapolation of the magnetic field from the surface of the star to larger distances (e.g. Jardine et al. 2006, D08, Gregory et al. 2010) is valid only inside the magnetospheric (Alfvén) surface, where the magnetic stress dominates. At larger distances, the magnetic field distribution strongly departs from potential.
Acknowledgments
Resources supporting this work were provided by the NASA High-End Computing (HEC) Program through the NASA Advanced Supercomputing (NAS) Division at Ames Research Center and the NASA Center for Computational Sciences (NCCS) at Goddard Space Flight Center. The authors thank A.V. Koldoba and G.V. Ustyugova for the earlier development of the codes. The research was supported by NSF grant AST0709015. The research of MMR was supported by NASA grant NNX08AH25G and NSF grant AST-0807129.
References
- Bachetti et al. (2010) Bachetti, M., Romanova, M. M., Kulkarni, A. K., Burderi, L., di Salvo, T., 2010, MNRAS, 403, 1193
- Basri, Marcy & Valenti (1992) Basri G., Marcy G.W., Valenti J.A., 1992, ApJ, 390, 622
- Bessolaz et al. (2008) Bessolaz N., Zanni C., Ferreira J., Keppens R., Bouvier J., 2008, A&A, 478, 155
- Brickhouse et al. (2010) Brickhouse N.S., Cranmer S.R., Dupree A.K., Luna G.J.M., Wolk S., 2010, ApJ, 710, 1835
- Calvet et al. (2004) Calvet N., Muzerolle J., Briceño C., Hernóndez J., Hartmann L., Saucedo J.S., Gordon K. D., 2004, AJ, 128, 1294
- Calvet & Gullbring (1998) Calvet N., Gullbring E., 1998, ApJ, 509, 802
- Cameron & Campbell (1993) Cameron, A., Campbell, C, 1993, A&A, 274, 309
- Cranmer (2008) Cranmer S. R., 2008, ApJ, 689, 316
- Cranmer (2009) Cranmer S. R., 2009, ApJ, 706, 824
- Donati & Collier Cameron (1997) Donati J.-F., Collier Cameron A. C., 1997, MNRAS, 291,1
- Donati et al. (1999) Donati J.-F., Collier Cameron A., Hussain G.A.J., Semel M., 1999, MNRAS, 302, 437
- Donati et al. (2007) Donati J.-F., Jardine M. M., Gregory S. G. et al., 2007, MNRAS, 380, 1297
- Donati et al. (2008) Donati J.-F., Jardine M. M., Gregory S. G. et al., 2008, MNRAS, 386, 1234
- Donati et al. (2010) Donati J.-F., Bouvier J., Walter F.M. et al., 2010, MNRAS, in preparation
- Elsner & Lamb (1977) Elsner R. F., Lamb F. K., 1977, ApJ, 215, 897
- Ghosh & Lamb (1978) Ghosh P., Lamb F. K., 1978, ApJ, 223, L83
- Ghosh & Lamb (1979) Ghosh P., Lamb F. K., 1979, ApJ, 232, 259
- Gregory et al. (2008) Gregory S. G., Matt S. P., Donati J.-F., Jardine M., 2008, MNRAS, 389, 1839
- Gregory et al. (2010) Gregory S. G., Jardine M., Gray, C.G., Donati J.-F., 2010, Rep. Prog. Phys., in press
- Gullbring et al. (1998) Gullbring E., Hartmann L., Briceno C., Calvet N., 1998, ApJ, 492, 323
- Jardine et al. (2002) Jardine M. M., Wood K., Collier Cameron A., Donati J.-F., Mackay D.H., 2002, MNRAS, 336, 1364
- Jardine et al. (2006) Jardine M. M., Collier Cameron A., Donati J.-F., Gregory S.G., Wood K., 2006, 367, 917
- Jardine, Gregory & Donati (2008) Jardine M. M., Gregory S.G., Donati J. -F., 2008, MNRAS, 386, 688
- Johns-Krull, Valenti & Koresko (1999) Johns-Krull C., Valenti J.A., Koresko C., 1999, ApJ, 516, 900
- Johns-Krull (2007) Johns-Krull C. M., 2007, ApJ, 664, 975
- Kato, Hayashi & Matsumoto (2004) Kato Y., Hayashi M.R., Matsumoto R., 2004, ApJ, 600, 338
- Koldoba et al. (2002) Koldoba A. V., Romanova M. M., Ustyugova G. V., Lovelace R. V. E. 2002, ApJ, 576, L53
- Koldoba et al. (2008) Koldoba A. V., Ustyugova G. V., Romanova M. M., Lovelace R. V. E. 2008, MNRAS, 388, 357
- Königl (1991) Königl, A. 1991, ApJ, 370, L39
- Kulkarni & Romanova (2005) Kulkarni A. K., Romanova M. M. 2005, ApJ, 633, 349
- Lamzin (1995) Lamzin S. A., 1995, A&A, 295, L20
- Long, Romanova & Lovelace (2005) Long M., Romanova M. M., Lovelace R. V. E., 2005, ApJ, 634, 1214
- Long, Romanova & Lovelace (2007) ———. 2007, MNRAS, 374, 436
- Long, Romanova & Lovelace (2008) ———. 2008, MNRAS, 386, 1274
- Long, Romanova & Lamb (2010) Long M., Romanova M.M., Lamb F.K., 2010, MNRAS, in press, (arxiv:0911:5455)
- Lynden-Bell (1996) Lynden-Bell D. 1996, MNRAS, 279, 389
- Matt & Pudritz (2005) Matt, S., Pudritz, R.E. 2005, ApJ, 632, L135
- Matt & Pudritz (2008) Matt, S., Pudritz, R.E. 2008, ApJ, 678, 1109
- Mohanty & Shu (2008) Mohanty S., Shu F.H. 2008, ApJ, 687, 1323
- Romanova, Kulkarni & Lovelace (2008) Romanova M. M., Kulkarni A. K., Lovelace R. V. E., 2008, ApJ, 673, L171
- Romanova et al. (2010) Romanova M.M., Long M., Lamb F.K., Kulkarni A.K., Donati J.-F. 2010, MNRAS, in press (arXiv:0912.1681)
- Romanova & Lovelace (2006) Romanova M. M., Lovelace R. V. E., 2006, ApJ, 645, L73
- Romanova et al. (2002) Romanova M. M., Ustyugova G. V., Koldoba A. V., Lovelace R. V. E., 2002, ApJ, 578, 420
- Romanova et al. (2004a) ———. 2004a, ApJ, 610, 920
- Romanova et al. (2004b) ———. 2004b, ApJ, 616, L151
- Romanova et al. (2009) ———. 2009, MNRAS, 399, 1802
- Romanova et al. (2003) Romanova M. M., Ustyugova G. V., Koldoba A. V., Wick J. V., Lovelace R. V. E., 2003, ApJ, 595, 1009
- Schmitt et al. (2005) Schmitt J. H. M. M., Robrade J., Ness J.-U., Favata F., Stelzer B., 2005, A&A, 432, L35
- Siess, Dufour & Forestini (2000) Siess L., Dufour E., Forestini M., 2000, A&A, 358, 593
- Ustyugova et al. (2006) Ustyugova, G. V., Koldoba, A. V., Romanova, M. M., Lovelace, R. V. E., 2006, ApJ, 646, 304
- Vrba et al. (1986) Vrba F. J., Rydgren A. E., Chugainov P. F., Shakovskaia N. I., Zak D.S., 1986, ApJ, 306, 199
- Valenti & Johns-Krull (2004) Valenti J. A., Johns-Krull C.M., 2004, ApSS, 292, 619