Structure and Dynamics of the Milky Way: The Evolving Picture
Abstract
From the inception of radio astronomy, the study of the Interstellar Medium has been both aided and frustrated by one fact: we are right within it! Our embedded perspective is favourable to observing kinematic and structural details that are likely to remain inaccessible in external galaxies for some time, but not so to gaining a birds-eye view of our Galaxy’s structure and motions on the largest scales. The Canadian Galactic Plane Survey (CGPS) is the original survey with the ability to image both details and the “big picture”. We will broadly review what is known of the Milky Way, and focus on large-scale ISM structure and dynamics that the CGPS and immediate family of surveys depicts particularly well (e.g. spiral structure, the rotation curve, density waves, rolling motions, the warp & scalloping). We also highlight areas where puzzles still exist (e.g. outer spiral structure, the question of shocks and rolling motions in the Milky Way), and offer some new insights (e.g. multiple shocks in the 2 quadrant; a radially varying spiral pattern speed in the disc) that demonstrate what is possible with current and future high-resolution 21 cm surveys.
1 Introduction and a Brief History
Although the meeting that generated these proceedings coincides with the end of observing for the Canadian Galactic Plane Survey (Taylor et al. 2003) and celebrates the completion of radio astronomy’s original ”small-structure: big-picture” survey, it is more properly viewed as a rest-stop along the journey that all ISM astronomers share in. Discoveries made at the survey’s end will undoubtedly be as profound as the ones we have made along the way and will continue to make. The journey for those who have been involved with the CGPS has also been marked with images of an extraordinary beauty only a well-sampled plane could provide. This review will take stock of discoveries we have accumulated up to this point and synthesize a contemporary picture of the Milky Way’s large-scale structure and dynamics. It follows a talk on the same, online at www.novell.brandonu.ca/fostert/foster.ppt. As the author is a progeny of the CGPS, the review is naturally focussed on aspects of the Milky Way (hereafter MW) that are depicted well in it and its siblings VLA-GPS and Southern-GPS, which came together in 2001 to form the International Galactic Plane Survey, or IGPS.
One theme that the reader may expect to encounter in pursuing or reviewing Galactic ISM structure and dynamics studies is an often frustrating interdependency between them. The cause is in the brightness temperature unit (K), which descends from both line-of-sight (hereafter LOS) density variations and inflections in the velocity field . This “degeneracy” frustrated the 1970’s pioneers of the field; for example, Burton (1971) attempted to say something about the distribution of Galactic hydrogen by first assuming its motion (rotation only), whereas Rohlfs’ 1974 investigation of the velocity field could only proceed by assuming some density structure for the disk. Along with the confusion from the overwhelming amount of emission, the nearly indistinguishable observational signatures of different density wave theories, and the lack of computing power at the time, this led to early efforts to model spiral structure with H i being largely abandoned by the late 1970’s. The demise was foreshadowed by Frank Kerr’s comments on Galactic H i spiral structure at the 1970 “Spiral Workshop” (an account of which is by Simonson 1970), where he introduced 21 cm emission as ”the way to study the whole Galaxy”, only to concede later that ”there is so much 21 cm emission that we’re confused by it” (see Lockman 2002). As you will see, the picture remains elusive, and to this day there are doubters that H i is at all a reliable tracer of spiral structure.
2 Fundamental Constants
The fundamental equation of Galactic structure relates the observed Doppler velocity along the line-of-sight to the Galactic orbital motion of an ISM element:
| (1) |
where the fundamental structural constant is the Solar Galactocentric radius and the fundamental dynamical constant is the angular velocity of the Sun (with respect to the LSR). Mapping out 21 cm Galactic structure and dynamics requires each of and to be measured independently for the element. Since is measured, is an observable quantity independent of , provided both and are known. Only if perturbations in and are negligible is then a direct observation of the true rotational frequency of the element with respect to the Sun and Eqn. 1 is independent of . Unfortunately, these ideal conditions do not often happen in the plane.
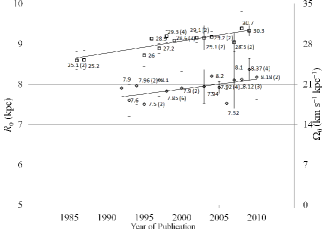
The angular velocity in the Solar neighborhood is most often measured by observing kinematics of stellar tracers such as OB stars, Cepheids, open star clusters, or old red giants. All methods either rely on observables like the Oort constants, () or require the distance to each tracer (and hence rely on the constant ). It appears that differences in measured values for both constants are subject to the observer’s bias more so than to random differences from the techniques used to measure them. Hence neither or have converged towards single values with time. A gradual increase in both is shown in Figure 1, which plots 32 published measurements of and 23 for . The data (Table 1, available online at www.novell.brandonu.ca/fostert/table1.pdf) are grouped together into one-year bins by calculating the uncertainty-weighted mean for each year (labelled in figure). The uncertainty for each bin is the mean published uncertainty that year divided by the square root of the number of measurements that year (in brackets on figure). The trend in (Pearson coefficient r=0.87) is significant and likely attributable in part to the “bandwagon” effect where new values will tend to agree with previously published ones regardless of the method used to obtain them. A correlation of with publication year is also observed (r=0.59; 95% level). This suggests that the same effect in (previously noted by Reid 1993) has carried forward beyond 1993, although all data bins in Fig. 1 are within error of one another. An error-weighted mean for each constant 8.00.4 kpc and 28.71.1 km s-1 kpc-1 is calculated, though it is likely that neither sample is complete. For this review we adopt the modern constants of Reid et al. (2009b) based on trigonometric parallax observations of star formation regions: 8.40.6 kpc and 30.30.9 km s-1 kpc-1 (or a Solar linear velocity of 254 km s-1).
3 Galactic Dynamics
3.1 Milky Way Circular Rotation
The largest scale dynamics in the Milky Way are those that reflect the response of the matter to the overall gravitational potential created by the mass distribution (stars plus ISM). For circular rotation the potential is related to observables and by . Circular orbits in galaxies are found with or a constant circular speed, and never at the extremes (Keplerian) and (solid-body rotation). The actual shape of MW rotation near the Sun can be assessed with the Oort constants, or equivalently the frequency of radial oscillations about the circular orbit’s guiding centre . The ratio of epicyclic-to-orbital frequency, is for flat circular speed curves. This is in fact what is observed near the Sun: for example using open star clusters Lépine et al. (2008) find 435 km s-1 kpc-1. Then , suggesting MW rotation is quite flat in the vicinity .
3.1.1 Inner Galaxy Rotation
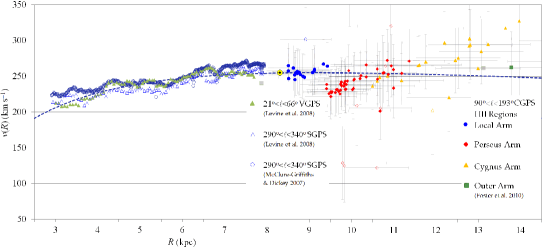
Because of extinction and the relatively low velocity dispersion of the interstellar gas (8 km s-1), ubiquitous radio ISM gases (H i, 12CO) are better tracers of MW rotation in the plane than are stars, which are veritable bullets with 30 km s-1. Inside of the Solar circle, the rotation curve is directly observable by isolating the part of the spectral profile emitted by gas at the tangent point, where the LOS passes closest to the Galactic centre. At this point , and the observable quantity in Eqn. 1 becomes the circular velocity at this radius .Success at isolating emission from gas there depends on 1) the method used to locate within a profile, and 2) the ability to distinguish it from the innumerable clouds, expanding shells, continuum and self-absorption features and other small-scale features that display their own kinematics. The best methods model the profile near with some empirical or physically-motivated function (e.g. Rohlfs & Kreitschmann 1987) rather than simply placing at some repeatable threshold within the profile (the half-maximum; Luna et al. 2006, for example). As for 2), only high-resolution data like those produced by the IGPS can help. The two best H i rotation curves for on the market today are extracted from VGPS (1 quadrant, or QI) and SGPS (QIV) data: Levine et al. (2008); McClure-Griffiths & Dickey (2007). These are compared in Fig. 2 after rescaling to our adopted constants in Sec. 2. The QIV curve of McClure-Griffiths & Dickey (2007) illustrates the benefits of high-resolution data: it is densely sampled and makes good use of the high-resolution SGPS data by avoiding continuum absorption features. However their curve is some 7 km s-1 above that of Levine et al. (2008), a difference that comes from modelling the profile with a complementary error function, which restricts to be down the wing near the half-maximum in the profile. Levine et al. (2008) use a model profile which is more physically consistent with circular motion at the tangent point (that of Celnik et al. 1979), and locates higher up the wing at about 90% of the peak, where it is generally found in synthetic observations of hydrodynamics galaxy simulations. They also measure QI with VGPS data, and their results show the long-known asymmetry between the QIV and QI curves. For their study of the -dependence of they smear VGPS and SGPS data into 05 bins, and their curves at 0 thus suffer from higher scatter than McClure-Griffiths & Dickey (2007). The CGPS has yet to be used to measure QI rotation for 50∘90∘(6.4-8.4 kpc) but should provide an outstandingly clean curve if care is taken to avoid H i continuum- & self-absorption.
3.1.2 Outer Galaxy Rotation
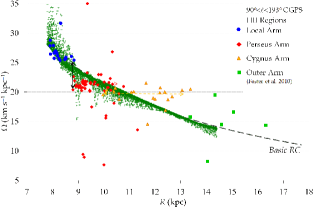
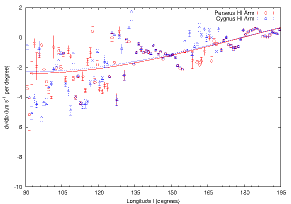
Outside of the Solar neighborhood, MW rotation in the disc is traceable to great distances with the radio ISM, out to the edge of the H i disc (20 kpc). Because the term at these distances, the edge of the H i surface density as measured with Eqn. 1 is very sensitive to the shape of the rotation curve (Lockman 2002). In turn, the slope of the far outer curve measured with Eqn. 1 using discrete kinematic tracers depends strongly on the adopted values of constants and , and on uncertainties in and . In particular, uncertainties in for spiral arm tracers like H ii regions bias part of the curve to appear to rise like solid-body rotation ( Binney & Dehnen 1997); in other words a rising circular speed curve could be observed when it is in fact constant or falling through the outer Galaxy. This effect is plainly visible in Perseus and Cygnus arm H ii regions plotted in Figure 2 appearing in each arm as a rising trend. This bias is undoubtedly responsible for the rise observed in the classic Outer Galaxy rotation curve of Brand & Blitz (1993) traced with bright H ii regions. Indeed it must be altering the measured shape of all rotation curves constructed principally from spiral arm tracers. Generally, contemporary published Outer Galaxy curves (e.g. Russeil et al. 2007; Hou et al. 2009) are mainly compiled from stellar distances and velocities from across the literature, with little new data (one exception is Russeil et al. 2007). These curves generally show constant circular speed (i.e. ) well out to the edge of the Milky Way’s stellar disc (15 kpc). Near-constant circular speed has been confirmed by modelled halo potentials from SDSS observations (Xue 2008) out to an extraordinary 50 kpc where it declines to only 200 km s-1.
A feature common to all Outer Galaxy curves based on discrete kinematical tracers is a large scatter in and (to a lesser extent) in , which overwhelms any detail in the curve of the kind we see in the Inner Galaxy. To see these details, 1-arcminute CGPS H i and 12CO line data can be a great advantage, measuring the systemic velocity from the thin edges of shells that surround the ionized gas and stars. Where both H i and CO shell edges are seen, one gets two measures of which are perpendicular to any motions from the shell’s expansion along the LOS. To demonstrate this advantage we will refer to measurements of velocities and distances of some 100 H ii regions across much of the CGPS (90∘193∘) (from Foster et al. 2010, for this review we will refer to these tracers often). In this sample 33 Perseus spiral arm objects are also found in Brand & Blitz (1993) (excluding those with 170-190∘due to the 1/sin projection effect) and in that paper, these show a mean angular velocity of 24.671.04 km s-1 kpc-1 (1-). Using CGPS data two velocities each (12CO & H i) are determined for 41 Perseus arm H ii regions in the same longitude range, resulting in 24.130.69 km s-1 kpc-1. In the CGPS we not only find velocities for 8 more objects but the scatter about a common has been reduced by 33% 111Additionally in Foster et al. (2010) distances to OB stars within the H i and 12CO shells surrounding each H ii region have been recalculated using a common MK Luminosity class and a common () colour calibration, reducing the scatter in by 20%.
The Outer Galaxy rotation curve obtained with all 100 regions is shown in Fig. 2. Fitted to all data in the figure (except from 2007 and H ii regions between 170-190∘, marked with open symbols) is Eqn. 2 below, which gives a reasonable approximation to observed external galaxy rotation curves (M31 for e.g. Brandt 1960):
| (2) |
The fit is very robust and shows that linear rotation rises steadily from 3-8 kpc (0.95), peaking at the Solar velocity 255 km s-1 at 9.3 kpc. Thereafter it declines very gently to 235 km s-1 at 20 kpc. Obviously Eqn. 2 cannot capture details of non-circular motions in the Inner Galaxy (“wiggles”) and the sharp discontinuity preceding Perseus Arm objects in the Outer Galaxy, almost certainly the signature of a shock (see Sec. 3.2). The slope of Eqn. 2 is undoubtedly altered by it.
As 21 cm surveys of the MW (e.g. GALFAH i, ASKAP) evolve to higher resolutions and sensitivity so too the measured Galactic rotation curve will evolve towards a better sampled, lower scatter version of what we see today. As we advance into the next decade, VLBI parallax distances and proper motions to more kinematic tracers will sharpen the Outer Galaxy curve and its details tremendously (Reid et al. 2009a). It is imperative that we now begin modelling the smooth underlying rotation curve and density wave perturbations separately in a multi-parameter model; not an easy task, but we believe the next avenue of immediate advancement in MW rotation curve studies. This will also help to answer the long-standing question of the asymmetry between the QI and QIV rotation curves. Can this be accounted for purely by spiral structure?
3.2 Spiral Dynamics: Density Wave Motions in the MW Disc
The choreographed movement and organization of the old stellar disc into a set of nested elliptical orbits creates regions of enhanced stellar density, forming a non-axisymmetric gravitational potential an order of magnitude or two smaller than the total potential . The pattern in the stars circulates as a spiral density wave (hereafter DW) through the disc, and the response of the ISM gas is vigorous and complex, with as little as 3-5% producing sharp shocks in the gas and forming many secondary and tertiary spiral armlets downstream of the potential minimum. As shown by Roberts et al. (1975) a galaxy’s Hubble type and degree of development of spiral structure is determined by the strength of shocks in its ISM, which in turn is governed by two key DW parameters: the pattern’s angular speed of rotation and the winding (pitch) angle of the spiral arms . is one of the most poorly constrained parameters in all of Galactic astronomy. Estimates are based on either stellar kinematic tracers giving 20-30 km s-1 kpc-1 (see Gerhard 2008, for review), or on linking periods of terrestrial climate change with the Sun’s passage through spiral arms, giving 12-20 km s-1 kpc-1 (Gies & Helsel 2005; Svensmark 2006), though Overholt et al. (2009) calls this link into question. It is not even clear if a single constant value for can adequately describe the Milky Way spiral. Measurements of are across the entire range of SBa to SBc galaxies (6-20∘ Vallée 2008), probably in part because no distinction is made between what is being measured: the DW potential (stellar) arms, shocks (H i self-absorption & dust), and star-formation arms (H ii gas and OB stars) are all expected to have different (Gittins & Clarke 2004). No conclusive confrontation of observations with the non-linear DW (shock) theory has been presented so far, and where the MW fits into the spectrum of spiral galaxies remains a mystery. Are we more like galaxy M33 (smooth continuous ISM flow; poorly defined spiral structure) or M81 (sharp shocks and arms in ISM and many secondary gaseous arms in the outer disc)?
3.2.1 Density Waves in the Inner Galaxy
We can get an initial idea of the pattern speed in the Inner Galaxy from the recent GLIMPSE results (Figure 14 in Churchwell et al. 2009). Star counts towards the Scutum and Centaurus arms show peaks, whereas none are seen towards the Sagittarius & Norma arm tangencies, suggesting that these two arms are predominantly ISM concentrations. Theory predicts such secondary arms form from the gas’ dynamical response to a principal 2-arm stellar DW. A family of 12 hydrodynamics galaxies are built with combinations of 12,16,20 and 8,10,12,14∘, spanning today’s range of contentious values for these parameters. Surface density images of these simulations are shown in online figures at www.novell.brandonu.ca/fostert/DWModels.pdf. In them, the Sun is the bright dot located at 7.8 kpc; its phase with respect to the pattern is set by the parallax distance to W3OH (134∘, 2 kpc), the location of the Perseus arm shock (Xu et al. 2006). All models form a 4-arm ISM pattern beyond some radius which is relatively insensitive to pitch angle (11 kpc, 8.5 kpc & 6 kpc for 12, 16 & 20 km s-1 kpc-1 respectively). The observation of gaseous arms deep in the Inner Galaxy at 3-5 kpc (beyond the bar) suggests then that 20 km s-1 kpc-1 there.
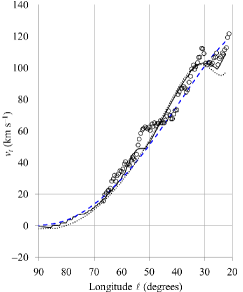
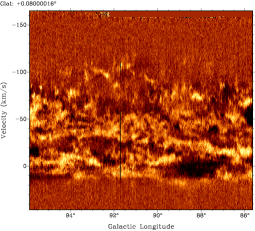
The best evidence for density waves in the Inner Galaxy are the wavy irregularities in H i terminal velocities (10 km s-1) with Galactic longitude (see Fig. 3). Here as well spiral structure, inextricably linked with spiral dynamics, is staring us in the face and crying out to be properly (quantitatively) modelled with theory in a parameter fitting analysis. However, Fig. 3 shows that is too poorly resolved, and that the signatures of linear and shock theories are too similar to conclusively choose between them with the current data. It is not clear whether more careful measurements of will unambiguously resolve the sharp cusps in that shock theory predicts, one of the only features at the tangent point distinguishing it from the linear version. Nonetheless, the use of high-resolution 21 cm data as illustrated by McClure-Griffiths & Dickey (2007) is the correct way to begin to resolve DWs in the Inner Galaxy.
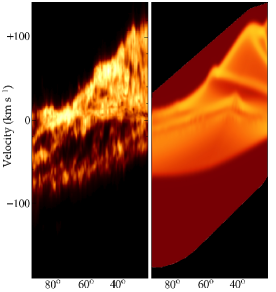
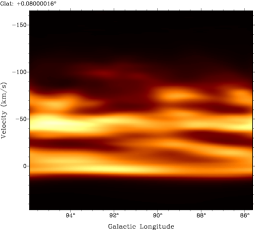
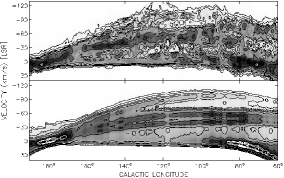
The most natural way to model DWs is by comparing theoretical diagrams to observed ones, as theory predicts both ingredients that shape these diagrams: the (perturbed) density and total velocity (assuming constant spin temperature). Qualitative comparisons of the diagram were made very early by Burton (1971); Roberts (1972); Sawa (1978) and others, and once again, it was found that linear and shock version of DW theory produce very similar diagrams with only subtle differences (Sawa 1978). Fig. 3 (right) shows the observed QI diagram (Leiden H i data) compared to that simulated from the model galaxy with 20 km s-1 kpc-1, 14∘, the model we find that best fits the Leiden observations in a simple minimization.
3.2.2 Density Waves in the Outer Galaxy
In the Outer Galaxy (QII & QIII) the velocity anomaly associated with Perseus spiral arm H ii regions has been long known, and is seen in published rotation curves today between 9-11 kpc as a cluster of objects underneath the smooth (see Fig. 2. The explanation in terms of the shock was proposed early on by Roberts (1972), but the idea was never really explored further from there, probably because the scatter in rotation curves based on H ii regions prevents a positive identification of a sharp feature like a shock. However, the Outer Galaxy rotation curve traced with CGPS H ii regions clearly shows this velocity discontinuity between the local & Perseus arm objects at 8.9 kpc (see Fig. 4, left). To compare this to, is simulated from our family of synthetic galaxies by picking any point a known distance from the Sun’s location and assuming its entire LOS velocity projection is described by Eqn. 1. The results of picking thousands of these points show the type of rotation curve one might measure for such a galaxy. Fig. 4 (left panel) is the simulated rotation curve from model 16 km s-1 kpc-1, 12∘indeed showing that a shock would appear as a discontinuity in extending under the basic rotation curve at 8.9 kpc, just as is seen in the Perseus arm H ii regions. We have found that only simulations with 16 place the shock exactly at their location; 12 models place the shock well ahead of the H ii regions, and 20 models do not form shocks at all beyond the Solar radius.
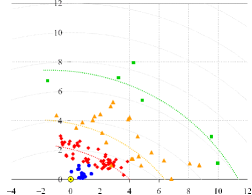
We distinguish a group of more distant H ii regions at a constant 20 km s-1 kpc-1 which trace a second optical arm some 2 kpc beyond Perseus. The presence of second optical arm beyond the Perseus arm was proposed by Kimeswenger & Weinberger (1989), and stars in it traced by Negueruela & Marco (2003) who refer to it as the “Cygnus arm”. In our sample some 20 objects are distinguished from the Perseus arm members by not only their distinctly larger distances (11 kpc), but by 1) their relatively high latitudes (mean 25) compared to the Perseus arm, 2) their correspondence with an H i concentration similarly higher up in the distant warped midplane (see Fig. 6), and 3) their appearance in a larger “kinematic ring” . In our simulated rotation curve Cygnus arm objects appear behind a secondary shock beyond the Perseus arm (Fig. 4). The presence of both star-forming arms at has implications for the pattern speed , if we are to assume that the H ii regions that trace them form from shocks. The right panel shows a birds-eye view of model 12 km s-1 kpc-1, 12∘. This model generates multiple strong secondary shocks behind the primary one in the Perseus arm (at 8.9 kpc) that explains the presence of H ii regions in the Cygnus and Outer arms (yellow and green respectively). The 16 models do not generate shocks beyond the Perseus arm shock, and 20 models show no strong shocks form at all beyond , making the presence of any massive star-formation regions outside the Solar circle not as easily explained.
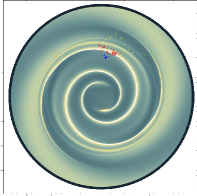
It is likely then that the MW has a radially falling spiral pattern speed of the kind seen in some external spirals (Meidt et al. 2009), with 20 from the bar’s edge to , dropping to 16 at 9 kpc and to 12 km s-1 kpc-1 at 11 kpc. Admittedly this conclusion is drawn from somewhat simple comparisons made for the sake of this review, but we believe demonstrate what is possible to discover in confronting DW theory with kinematics of the Outer Galaxy. Large-scale comparisons of this kind with new observations have today fallen behind the ever-increasing number of theoretical simulations. The power in new high-resolution 21 cm surveys will be their ability to resolve the smooth intercloud medium between the clouds, allowing H i cubes that show a less-confused view of large-scale Galactic motions like rotation, density wave streaming and turbulence to be created. Rohlfs (1974) recognized this and applied a minimum-brightness boxcar type filter to isolate the large-scale H i “stratum” from the “clouds”. Levine et al. (2006a) use an unsharp mask on LAB H i data to enhance the visibility of spiral structure in surface density maps. A similar more advanced filter based on the background separation technique in Kothes & Kerton (2002) is demonstrated with CGPS data in Fig. 5. With any filter it is important to use high angular resolution observations in order to resolve the narrow gaps between clouds. Creating new expressions of the neutral ISM images will ultimately resolve the subtle differences between density wave theories.
3.3 Rolling Motions
Spiral arms in most directions in the MW exhibit strange velocity gradients perpendicular to the plane. These were first observed in the 21 cm line by Oort (1962) and coined “rolling motions”. The term comes from the arms’ tilted appearance in H i latitude-velocity slices ; at positive latitudes the centroid of the arm appears at higher negative velocities, whereas down through the equator and below () the centroid smoothly shifts to more positive velocities. Rolling is also observed in the molecular ISM (12CO, Wouterloot 1981), and in local young stars (Brosche & Schwan 1984). Discrete objects like H ii regions also “roll”, exhibiting the same overall gradient across the plane as the H i arms do (Foster et al. 2010), and are therefore likely tracing the same motions. Typical gradients are 2-4 km s-1 per degree of latitude, or about 20 km s-1 per kpc in the Perseus arm. Rolling motions have not yet been observed in external galaxies.
Yuan & Wallace (1973) first described rolling as apparent “pseudo-motions” created by our top-down view of the arms caused by their tilt towards up (due to the warp of the midplane), and differential circular rotation. For example, in QII the upward warp causes a given contour of an arm at higher latitudes to be observed at a greater distance (and thus at a more negative velocity) than the same contour at lower latitudes. This geometric effect is subtle, and is reproducable in 3D models of the Galactic disk that include the warp (e.g. Foster & MacWilliams 2006), however, a modern flat rotation curve and figure for the warp produces smaller apparent gradients (1 km s-1 per degree) than observed. This was also shown by Feitzinger & Spicker (1985), opening the possibility that rolling motions are partly physically real. They (1986) propose tumbling pockets of H i gas falling from high in Galactic Fountains, themselves caused by active star formation in the arm’s middle.
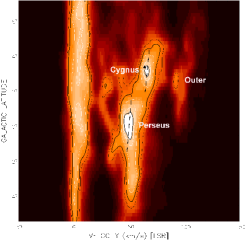
The Yuan & Wallace model seems to be supported by observations in the Outer Galaxy. If rolling is entirely due to observed differences in circular motion (including rotation) with latitude, then gradients in the arms should disappear in the cardinal direction 180∘. This is observed for both the Perseus & Cygnus H i arms (see Fig. 6). However, the latitudes of Perseus arm H ii regions are constant (01) with increasing distance , yet these objects also “roll” with the H i arm. Rolling in Perseus must therefore be entirely physical and not a viewing effect. The magnitude of the rolling gradient in Cygnus arm objects is the same as in Perseus, so rolling in the Cygnus arm could also have essentially nothing to do with its displacement above the midplane. However H ii regions associated with this arm do show a relationship of with latitude , just as one would expect if the warp were involved!
As the reader can see there are more inconclusions than conclusions. How much of the observed gradients in the MW are real, and how much apparent? A good 3D MW model that includes the warp fitted to the observations will be necessary to separate real from apparent rolling motions, after which the fountain theory can be further tested or other explanations sought. Are rolling motions unique to the MW, and therefore likely illusions caused by our viewing point? Future 21 cm observations of external galaxies will tell us. The EVLA is the only instrument with resolution 1 km s-1 and 1′′on the sky sufficient to scrutinize external spiral arms with 50 pc spatial resolution at D=10 Mpc. Nearby galaxies in the THINGS survey (see this volume) would be good starters, and in the future ASKAP will be able to extend our observations.
4 Galactic Structure
An executive summary of the MW might go something like this: the MW is a barred spiral galaxy with a short boxy bulge in its centre, and a stellar bar about twice as long. The old stars form a principally 2-arm DW pattern in the Inner Galaxy, giving rise to at least 4 ISM arms that are active in star formation from 4-14 kpc. The 4-arm pattern winds through most of the Inner and all through the Outer Galaxy with the same pitch angles of 12∘, and the arms are connected by minor branches and spurs throughout, including one that the Sun currently resides in. Inside the Solar circle the H i disc is remarkably flat, while outside the disc is twisted nearly along the Sun-centre line into a gentle warp above the midplane in one hemisphere and below it in the other.
4.1 Milky Way Spiral Structure: Methods and Results
Mapping the spiral structure of the Milky Way historically is still an exciting challenge that continues to this day. The historic 21 cm map by Kerr-Westerhout is based on 1) velocimetric deconvolution of the observed brightness distribution using circular rotation and a constant spin temperature. Levine et al. (2006a) recreate only the Outer Galaxy this way using the LAB H i data, and a minor refinement to the velocity field. Although a bit better than the historic map, the same distorted picture emerges with pitch angles 21-25∘, differing wildly from those more directly measured with kinematic tracers. These maps demonstrate that H i is a poor tracer of Galactic spiral structure when used like this. Deconvolutions based on the Dame et al. (2001) CO survey are clearer (e.g. Nakanishi & Sofue 2006, find a more reasonable 12-15∘). Pohl et al. (2008) use a non-circular velocity field based on a hydrodynamics (HD) galaxy simulation, itself fitted to the observed NIR luminosity distribution. The resulting Inner Galaxy map is more detailed than any previous one, showing a distinct bar in the centre angled to the Sun-centre line by 20∘, and two arms emanating from the bar’s ends at 3.5 kpc and winding outward by 115. Thus far no study has applied such a model to deconvolution of the observed H i distribution, though the approach is promising as shown by Gómez (2006) in reconstruction of observed simulations. The more flexible approach of 2) modelling the observed distribution is demonstrated in Fig. 7 (right). An empirical DW model (Foster & MacWilliams 2006) created the synthetic plot at bottom, and 12 adjustable parameters were varied in a proper least-squares fit to the data (top). Only two DW arms are modelled. Tight winding angles of 6∘are found, primarily because the model treats the Cygnus and Outer arms as one. The computational cost of this multi-parameter model-fitting approach is not prohibitive as it is for more realistic MHD models (Gómez 2006). Empirical models can also include components that have been difficult to incorporate in smoothed particle hydrodynamics models, such as the warp, magnetic fields, and rolling motions.
The paradigmatic 4-arm map of Georgelin & Georgelin (1976) is based on 3) direct spatial mapping using 268 H ii regions with photometric distances and/or kinematic distances based on RRL and H velocities. The Georgelin & Georgelin map has achieved some fame (cited at least 550 times) and some infamy. It is the starting point for the also-famous electron density map by Taylor & Cordes (1993), and the dust emission model by Drimmel & Spergel (2001). Compared to modern maps the pattern in Georgelin & Georgelin is unusually (and worringly) clean, and has prompted many to propose the MW is among the 10% of spirals with a so-called “grand design”. While it is generally accepted that there is indeed a coherent spiral pattern to be mapped, H ii regions and giant molecular clouds in the MW sport a truly messy pattern (c.f. Paladini et al. 2004; Hou et al. 2009), revealed by “photoshopping” out the fitted arms drawn on published H ii region maps. One wonders if H ii regions will ever reveal a “grand design” spiral structure in the MW, if one exists at all. Recent H ii region maps by Russeil et al. (2007); Hou et al. (2009) fit 2-4 logarithmic or variable pitch angle spiral segments, with 4 arms at 10-13∘always fitting better than two with tighter 6-8∘windings. Of course, any model with twice the free parameters should fit better, but 4-arm models also reproduce known arm tangency directions. Within the likely uncertainties of the fits (20-30%; see below), 4-arm models show the same pitch angle arm to arm and negligible variation of with radius (this however is not clear as few papers offer proper uncertainties on any fitted spiral arm parameters!). A least-squares fit to CGPS H ii regions weighted by uncertainties in both coordinates ln & yields 12.02.6∘and 12.64.1∘for the two major star-forming arms in QII (see Fig. 7).
Another method, 4) fitting models to Galactic features observed on the sky (e.g. arm tangency directions) yields information on the number of arms as well as large symmetric structures like the disc scale length, thickness and flaring, and the warp. An example is the model of Drimmel & Spergel (2001) based on COBE observations of NIR (stars) and FIR (warm dust) emission. Drimmel & Spergel intriguingly find that an 2 arm pattern dominates the nonaxisymmetric NIR emission. This is supported by Inner Galaxy star counts from the GLIMPSE survey, which show no enhancement in star numbers towards the expected tangency of the Sagittarius arm 45∘51∘(Fig. 14 in Churchwell et al. 2009). A visualization of the MW constrained with GLIMPSE, H i & CO Galactic plane surveys, and other observations (Fig. 15 Churchwell et al. 2009) shows the Perseus and Scutum-Centaurus arms are the principal stellar arms, while Sagittarius and Norma are two star-poor ISM arms. The Norma arm wraps around from its origin at 4 kpc to become the “Outer arm” in QII & QIII, and then is identified with the distant H i arm of McClure-Griffiths et al. (2004) in QIII & QIV.
Comparison of the GLIMPSE map with the recent synthesis of MW spiral structure by Vallée (2008), and with CGPS H ii regions, shows some fundamental differences. Vallée (2008) draw the Sagittarius and Norma arms attached to the bar’s ends, whereas the Scutum-Crux and Perseus arms first appear outside the zone of the bar. In the Outer Galaxy the winding angle and distance to the Perseus arm agree extremely well in all three maps. Vallée (2008) show the Cygnus arm as the Outer Galaxy extension of the Norma arm, however, it appears much farther from the Sun (6-7 kpc between 130-150∘) than H ii regions and stars (e.g. Negueruela & Marco 2003, and Fig. 7, this work) show it to be (4-5 kpc). It is possible that its distance in Vallée is kinematically estimated and overly large due to the presence of a second shock beyond the Perseus arm in QII. The Cygnus arm is missing altogether from the GLIMPSE map, but would appear halfway between the Perseus and Outer arms on there. Given the pervasive confusion in the literature between it and the Perseus arm, this is not surprising.
MW spiral structure is then far from a closed subject, and as pointed out by Churchwell et al. is deserving of much more attention from the community. In particular the relationship between the Inner and Outer Galaxy patterns needs to be clarified. How do the stellar and ISM arms from GLIMPSE relate to the Outer Galaxy pattern? As computational speeds increase, new attempts at determining MW spiral structure in H i by modelling and comparisons with DW theory, and deconvolution with self-consistent dynamical models may be profitable. As more VLBI parallax distances can be measured towards fainter masers (Reid et al. 2009a), the precise pattern (or lack thereof!) traced out by star-forming regions will become clearer in the decade to come.
4.2 The Warp
The pioneering 21 cm observations of the MW disc in the 1950’s showed the remarkable flatness of the Inner Galaxy disc, and in dramatic contrast, the warp of the Outer H i layer. A warped midplane is a commonality shared by most galaxies whose H i extends past their optical discs. Our neighbors M31 and M33 both exhibit warps (e.g. Chemin et al. 2009). The warp remains the least understood large-scale component of MW structure. It begins at inside the stellar disc. The Sun-centre line also happens to nearly bisect the warped halves of the H i disc, with the half in the Northern sky much more pronounced in amplitude. In QI & QII, H i profiles in directions 120∘and 0 are characteristically shaped by the LOS passing through, above, and then plunging back through the flared outer disc at oblique angles (Foster & Routledge 2003). A good analytic figure for the warp is written as sinusoidal in azimuth and linear in (1), with a small quadratic (2) term:
| (3) |
Binney & Merrifield (1998) give 1/6, 1/120 & 11 kpc, appropriate for a flat rotation curve with 8.5 kpc & 27.5 km s-1 kpc-1. The observed displacement of the midplane is maximum towards 80∘, where the H i layer extends more than 20 degrees (3 kpc in ) from the equator. Levine et al. (2006b) fit 0,1 & 2 harmonic modes with the same equation, finding the 1 mode begins inside the Solar circle and dominates to 16 kpc, where the 2 mode begins to appear, introducing the asymmetry in the North and South halves of the warp. Observations that 3 out of 4 warped galaxies have no visible companions suggest that warps are not tidally excited by satellites. However, when dark matter is included in simulations with small companions (2% total mass), the “wake” left by the orbiting companions in the DM halo induces vibration modes in the disc. In the MW, simulations by Weinberg & Blitz (2006) show a warp with 3 modes (0 1 & 2) can be excited by the Magellanic clouds passing through the DM halo.
The CGPS shows other essentially unstudied modes in the disc’s topography with wavelengths of 5-20 kpc spectacularly well. These are collectively referred to as “scalloping”, and give the Outer disc a crinkly, corrugated appearance.
References
- Binney & Dehnen (1997) Binney, J., & Dehnen, W. 1997, MNRAS, 287, 5
- Binney & Merrifield (1998) Binney, J., & Merrifield, M. 1998, Galactic Astronomy (Princeton, NJ: Princeton Uni. Press)
- Brand & Blitz (1993) Brand, J., & Blitz, L. 1993, A&A, 275, 67
- Brandt (1960) Brandt, J. C. 1960, ApJ, 131, 293
- Brosche & Schwan (1984) Brosche, P., & Schwan, H. 1984, A&A, 141, 25
- Burton (1971) Burton, W. B. 1971, A&A, 10, 76
- Celnik et al. (1979) Celnik, W., Rohlfs, K., & Braunsfurth, E. 1979, A&A, 76, 24
- Chemin et al. (2009) Chemin, L., Carignan, C., & Foster, T. 2009, ApJ, 705, 1395
- Churchwell et al. (2009) Churchwell, E., Babler, B. L., Meade, M. R., Whitney, B. A., Benjamin, R., Indebetouw, R., Cyganowski, C., Robitaille, T. P., Povich, M., Watson, C., & Bracker, S. 2009, PASP, 121, 213
- Dame et al. (2001) Dame, T. M., Hartmann, D., & Thaddeus, P. 2001, ApJ, 547, 792
- Drimmel & Spergel (2001) Drimmel, R., & Spergel, D. 2001, ApJ, 556, 181
- Feitzinger & Spicker (1985) Feitzinger, J. V., & Spicker, J. 1985, MNRAS, 214, 539
- Feitzinger & Spicker (1986) — 1986, PASJ, 38, 485
- Foster & MacWilliams (2006) Foster, T., & MacWilliams, J. 2006, ApJ, 644, 214
- Foster et al. (2010) Foster, T., Richards, C., & Brunt, C. M. 2010, in prep.
- Foster & Routledge (2003) Foster, T., & Routledge, D. 2003, ApJ, 598, 1005
- Georgelin & Georgelin (1976) Georgelin, Y. M., & Georgelin, Y. P. 1976, A&A, 49, 57
- Gerhard (2008) Gerhard, O. 2008, arXiv:1003.2489v1
- Gies & Helsel (2005) Gies, D. R., & Helsel, J. W. 2005, ApJ, 626, 844
- Gittins & Clarke (2004) Gittins, D. M., & Clarke, C. J. 2004, MNRAS, 349, 909
- Gómez (2006) Gómez, G. 2006, AJ, 132, 2376
- Higgs & Tapping (2000) Higgs, L. A., & Tapping, K. F. 2000, AJ, 120, 2471
- Hou et al. (2009) Hou, L. G., Han, J. L., & Shi, W. B. 2009, A&A, 499, 473
- Kimeswenger & Weinberger (1989) Kimeswenger, S., & Weinberger, R. 1989, A&A, 209, 51
- Kothes & Kerton (2002) Kothes, R., & Kerton, C. R. 2002, A&A, 390, 337
- Lépine et al. (2008) Lépine, J. R. D., Dias, W. S., & Mishurov, Y. 2008, MNRAS, 386, 2081
- Levine et al. (2006a) Levine, E. S., Blitz, L., & Heiles, C. 2006a, Science, 312, 1773
- Levine et al. (2006b) — 2006b, ApJ, 643, 881
- Levine et al. (2008) Levine, E. S., Heiles, C., & Blitz, L. 2008, ApJ, 679, 1288
- Lockman (2002) Lockman, F. J. 2002, in Seeing Through the Dust: The Detection of H i and the Exploration of the ISM in Galaxies, edited by A. R. Taylor, T. L. Landecker, & A. G. Willis, vol. 276 of ASP Conf. Ser.), 107
- Luna et al. (2006) Luna, A., Bronfman, L., Carrasco, L., & May, J. 2006, ApJ, 641, 938
- McClure-Griffiths & Dickey (2007) McClure-Griffiths, N. M., & Dickey, J. M. 2007, ApJ, 671, 427
- McClure-Griffiths et al. (2004) McClure-Griffiths, N. M., Dickey, J. M., Gaensler, B. M., & Green, A. J. 2004, ApJ, 607, 127
- Meidt et al. (2009) Meidt, S. E., Rand, R. J., & Merrifield, M. R. 2009, ApJ, 702, 277
- Nakanishi & Sofue (2006) Nakanishi, H., & Sofue, Y. 2006, PASJ, 58, 847
- Negueruela & Marco (2003) Negueruela, I., & Marco, A. 2003, A&A, 406, 119
- Oort (1962) Oort, J. H. 1962, in The Distribution and Motion of Interstellar Matter in Galaxies, edited by L. Woltjer (New York: W. A. Benjamin, Inc), 3
- Overholt et al. (2009) Overholt, A. C., Melott, A. L., & Pohl, M. 2009, ApJ, 705, 101
- Paladini et al. (2004) Paladini, R., Davies, R. D., & De Zotti, G. 2004, MNRAS, 347, 237
- Pohl et al. (2008) Pohl, M., Englmaier, P., & Bissantz, N. 2008, ApJ, 677, 283
- Reid (1993) Reid, M. J. 1993, ARA&A, 31, 345
- Reid et al. (2009a) Reid, M. J., Menten, K. M., Brunthaler, A., & Moellenbrock, G. A. 2009a, arXiv:0902.3928v2
- Reid et al. (2009b) Reid, M. J., Menten, K. M., Zheng, X. W., Brunthaler, A., Moscadelli, L., Xu, Y., Zhang, B., Sato, M., Honma, M., Hirota, T., Hachisuka, K., Choi, Y. K., Moellenbrock, G. A., & Bartkiewicz, A. 2009b, ApJ, 700, 137
- Roberts (1972) Roberts, W. W. 1972, ApJ, 173, 259
- Roberts et al. (1975) Roberts, W. W., Roberts, M. S., & Shu, F. H. 1975, ApJ, 196, 381
- Rohlfs (1974) Rohlfs, K. 1974, A&A, 35, 177
- Rohlfs & Kreitschmann (1987) Rohlfs, K., & Kreitschmann, J. 1987, A&A, 178, 95
- Russeil et al. (2007) Russeil, D., Adami, C., & Georgelin, Y. M. 2007, A&A, 470, 161
- Sawa (1978) Sawa, T. 1978, Ap&SS, 53, 467
- Simonson (1970) Simonson, S. C. 1970, A&A, 9, 163
- Svensmark (2006) Svensmark, H. 2006, Astron. Nachr., 327, 866
- Taylor et al. (2003) Taylor, A. R., Gibson, S. J., Peracaula, M., Martin, P. G., Landecker, T. L., Brunt, C. M., Dewdney, P. E., Dougherty, S. M., Gray, A. D., Higgs, L. A., Kerton, C. R., Knee, L. B. G., Kothes, R., Purton, C. R., Uyaniker, B., Wallace, B. J., Willis, A. G., & Durand, D. 2003, AJ, 125, 3145
- Taylor & Cordes (1993) Taylor, J. H., & Cordes, J. M. 1993, ApJ, 411, 674
- Vallée (2008) Vallée, J. P. 2008, AJ, 135, 1301
- Weinberg & Blitz (2006) Weinberg, M. D., & Blitz, L. 2006, ApJ, 641, 33
- Wouterloot (1981) Wouterloot, J. G. A. 1981, Ph.D. thesis, University of Leiden
- Xu et al. (2006) Xu, Y., Reid, M. J., Zheng, X. W., & Menten, K. M. 2006, Science, 311, 54
- Xue (2008) Xue, X.-X. e. a. 2008, ApJ, 684, 1143
- Yuan & Wallace (1973) Yuan, C., & Wallace, L. 1973, ApJ, 185, 453