Bulgeless Giant Galaxies Challenge our Picture of Galaxy Formation
by Hierarchical Clustering11affiliation: Based on observations obtained with the Hobby-Eberly Telescope,
which is a joint project of
the University of Texas at Austin,
the Pennsylvania State University,
Stanford University,
Ludwig-Maximilians-Universität München, and
Georg-August-Universität Göttingen. 22affiliation: Based on observations made with the NASA/ESA Hubble Space Telescope,
obtained from the Data Archive at STScI, which is operated by AURA, Inc., under
NASA contract NAS 5-26555. These observations are associated with program numbers
7330,
7919,
8591,
8597,
8599,
9293,
9360,
9490,
9788,
and
11080.
Abstract
To better understand the prevalence of bulgeless galaxies in the nearby field, we dissect giant Sc – Scd galaxies with Hubble Space Telescope (HST) photometry and Hobby-Eberly Telescope (HET) spectroscopy. We use the HET High Resolution Spectrograph (resolution ) to measure stellar velocity dispersions in the nuclear star clusters and (pseudo)bulges of the pure-disk galaxies M 33, M 101, NGC 3338, NGC 3810, NGC 6503, and NGC 6946. The dispersions range from km s-1 in the nucleus of M 33 to km s-1 in the pseudobulge of NGC 3338. We use HST archive images to measure the brightness profiles of the nuclei and (pseudo)bulges in M 101, NGC 6503, and NGC 6946 and hence to estimate their masses. The results imply small mass-to-light ratios consistent with young stellar populations. These observations lead to two conclusions:
(1) Upper limits on the masses of any supermassive black holes (BHs) are in M 101 and in NGC 6503.
(2) We show that the above galaxies contain only tiny pseudobulges that make up % of the stellar mass. This provides the strongest constraints to date on the lack of classical bulges in the biggest pure-disk galaxies. We inventory the galaxies in a sphere of radius 8 Mpc centered on our Galaxy to see whether giant, pure-disk galaxies are common or rare. We find that at least 11 of 19 galaxies with km s-1, including M 101, NGC 6946, IC 342, and our Galaxy, show no evidence for a classical bulge. Four may contain small classical bulges that contribute 5 –12 % of the light of the galaxy. Only four of the 19 giant galaxies are ellipticals or have classical bulges that contribute 1/3 of the galaxy light. We conclude that pure-disk galaxies are far from rare. It is hard to understand how bulgeless galaxies could form as the quiescent tail of a distribution of merger histories. Recognition of pseudobulges makes the biggest problem with cold dark matter galaxy formation more acute: How can hierarchical clustering make so many giant, pure-disk galaxies with no evidence for merger-built bulges? Finally, we emphasize that this problem is a strong function of environment: the Virgo cluster is not a puzzle, because more than 2/3 of its stellar mass is in merger remnants.
Subject headings:
galaxies: evolution — galaxies: formation — galaxies: individual (M 33, NGC 3338, NGC 3810, NGC 5457, NGC 6503, NGC 6946) — galaxies: nuclei — galaxies: photometry — galaxies: structure
1. Introduction
This paper has two aims. First, we derive upper limits on the masses of any supermassive BHs in two giant, pure-disk galaxies. This provides data for a study (Kormendy et al. 2010) of the lack of correlation (Kormendy & Gebhardt 2001) between BHs and galaxy disks. Second, we inventory disks, pseudobulges, and classical bulges in the nearby universe and show that giant, pure-disk galaxies are not rare. This highlights the biggest problem with our mostly well supported picture of hierarchical clustering: How can so many pure-disk galaxies form, given so much merger violence? Both studies need the same observations: photometry to measure structure and spectroscopy to measure velocity dispersions and masses.
1.1. A Practical Guide to Readers
In § 2, we measure stellar velocity dispersions in high-mass, Sc – Scd galaxies that contain only nuclei or extremely small pseudobulges. In § 3, we derive HST- and ground-based surface photometry of the most useful subset of our galaxies to see whether they contain small classical bulges, pseudobulges, or nuclei and to measure nuclear masses and limits. Sections 2 and 3 are long. Readers who need and results can find them in Figure 1 and Table 1. Readers who are interested in the smallest pseudobulges can concentrate on § 3. Readers whose interest is the challenge that pure-disk galaxies present for our picture of galaxy formation should skip directly to § 4.
1.2. Introduction to the Velocity Dispersion Measurements
Nuclei are expected to have velocity dispersions that range from those of globular clusters, km s-1, to values similar to those in the smallest classical bulges and ellipticals (e. g., M 32: km s-1; Tonry 1984; 1987; Dressler & Richstone 1988; van der Marel et al. 1994a, b; Bender et al. 1996). But nuclei are faint and embedded in bright disks. The constraint implies that we need high dispersion, and the faintness implies that we need a large telescope. As a result, few measurements of nuclei are available. The best object – now very well measured – is M 33, whose exceptionally well defined nucleus has a velocity dispersion of km s-1 (Kormendy & McClure 1993; Gebhardt et al. 2001). We use it as a test case for our observations. The “gold standard” of nuclear dispersion measurements is Walcher et al. (2005); they used the Ultraviolet and Visual Echelle Spectrograph on the Very Large Telescope to measure 9 nuclei of generally modest-sized galaxies at a resolution of .
This paper reports measurements of in M 33, NGC 3338, NGC 3810, NGC 5457, NGC 6503, and NGC 6946. In choosing targets, we favored the largest pure-disk galaxies that have the smallest possible pseudobulges (Kormendy & Kennicutt 2004) and the smallest possible distances. The most important galaxies for our purposes are NGC 5457 = M 101 and NGC 6946. A closely similar object is IC 342, for which Böker et al. (1999) measured a nuclear dispersion of km s-1 at a spectral resolution of . All three are Scd galaxies with extremely small pseudobulges or nuclear star clusters but essentially the largest possible asymptotic rotation velocities km s-1 consistent with our requirement that they contain no classical bulges.
Late in our data reduction, we were scooped by Ho et al. (2009), who measured and collected published data for 428 galaxies. All of our objects are included in their paper. However, their instrumental velocity dispersion is km s-1, whereas ours is 8 km s-1. Our measurements therefore provide important confirmation. Most of their measurements prove to be remarkably accurate, even when . We disagree on two values. Also, our measurements have estimated errors that are a factor of smaller than theirs. Confidence in our understanding of the smallest central velocity dispersions in the biggest pure-disk galaxies is correspondingly increased.
2. Observations and Data Reduction
2.1. Observations
The spectra were obtained with the High Resolution Spectrograph (HRS: Tull 1988) and the 9 m Hobby-Eberly Telescope (HET: Ramsey et al. 1998). The queue-scheduled observations were made between 2006 October 17 and 2007 April 21. HRS is fed by optical fibers; the image scrambling provided by the 34 m long fibers guarantees that different seeing conditions, source light distributions, and object centering accuracies do not affect the wavelength resolution. We used 3′′ fibers. A central fiber was postitioned on the galaxy nucleus and two bracketing “sky fibers” measured the night sky and galaxy disk at radii of 10′′ immediately outside the nucleus. We confirmed the nominal resolution of by measuring night sky emission lines. The corresponding instrumental dispersion is km s-1 at the Ca infrared triplet lines, 8498 Å, 8542 Å, and 8662 Å. The instrument is an echelle; the above lines were positioned in three orders that were combined into a single spectrum as described in § 2.2.
We obtained 4, 900 s exposures of NGC 6946. Exposure times were 600 s per spectrum for the other galaxies; we obtained two such spectra for M 33, three for NGC 6503, four for NGC 3338, five for NGC 5457, and seven for NGC 3810. In a few cases, seeing or transparency was poor – the latter is judged by signal level and the former is judged by the contrast of the nucleus against the disk, that is, by the ratio of the flux from the galaxy to that from the sky plus disk. Low-quality spectra were not reduced. Each spectrum was taken in 2 – 3 subexposures to allow correction for cosmic ray hits.
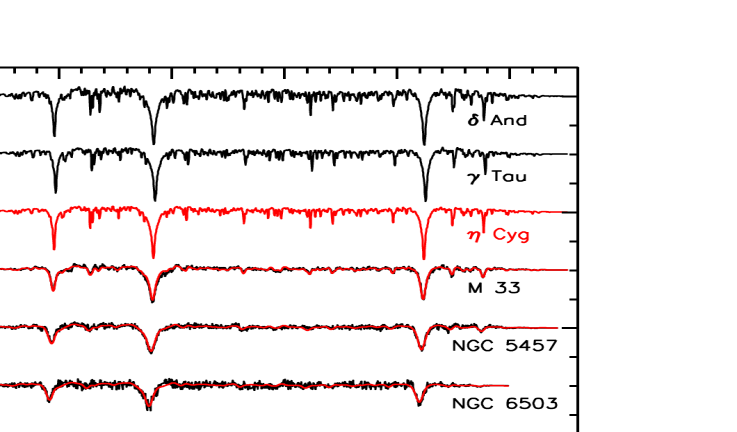
We also obtained 1 s to 50 s exposures of five velocity standard stars, HD 117176 (G4 V), HR 1327 (G4 III), Cyg (K0 III), Tau (K0 III), and And (K3 III). We have used the K0 – K3 stars in many previous papers; they reliably fit the spectra of low- to moderate-dispersion galaxies very well. In any case, (1) the Ca infrared triplet region is relatively insensitive to template mismatch (Dressler 1984), and (2) the FCQ program that provides our final dispersion values is specifically engineered to minimize problems with template mismatch (Bender 1990).
2.2. Preprocessing of Spectra
Spectral reductions were carried out using the interactive image processing system IRAF111IRAF is distributed by the National Optical Astronomy Observatories, which are operated by the Association of Universities for Research in Astronomy, Inc., under cooperative agreement with the National Science Foundation. (Tody 1993). The echelle software package was used to remove instrumental signatures from the data. For each night, we created a bias frame, a continuum flat, and a Thorium-Argon arc-lamp spectrum from calibration data taken before and after the observations. Science frames were first bias and overscan corrected. Bad pixels were flagged. Next, we removed cosmic ray hits using the spectroscopy-optimized version of L.A.COSMIC (van Dokkum 2001), and we coadded the three spectra obtained for each galaxy. We traced and fitted the spectral orders in the continuum flats using 3rd-order Legendre polynomials. We removed the spectral signature of the continuum lamp from the flat fields by fitting the continuum using 7th-order Legendre polynomials along the dispersion direction and divided the flat field frames by the fits. Next, we extracted the science spectra (galaxies and velocity standard stars) using these normalized flat fields to obtain one-dimensional spectra for each order. This provided one, multi-order spectrum of the galaxy nucleus from the object fiber plus two “sky” spectra at galactocentric distances of 10′′ bracketing the nucleus. Finally, all spectra were wavelength calibrated using the Th-Ar lamp spectra to an accuracy of 0.02 pixel 0.003 Å 0.1 km s-1.
The remaining tasks are sky subtraction and the combination of separate orders into a single final spectrum rewritten on a scale. These steps were carried out using a combination of IRAF and VISTA (Lauer 1985, Stover 1988). Two aspects of the reduction are tricky and require special care:
The first is sky subtraction. The good news is that sky spectra are taken simultaneously with the object spectra; this is important because sky lines vary on short time scales. The bad news is that sky subtraction is more difficult than it is with long-slit spectrographs, because we cannot average many spatial elements to get high signal-to-noise ratios . There are only two sky fibers. Sky subtraction contributes significant noise. Moreover, the sky fibers have slightly different throughputs than the object fiber, so the two sky spectra must be scaled (differently) to the object spectrum. Sky subtraction is more difficult for some objects than for others, because the Ca triplet lines are badly positioned with respect to night sky lines for some galaxy redshifts and benignly positioned for others.
The second tricky problem is the polynomial fit to the continuum that must be divided into each spectral order to remove the blaze efficiency function. These functions are approximately -shaped. They are not vertical at the ends of orders, but the signal is low there and hence multiplied upward by the continuum division. When Ca lines fall well away from the ends of orders, then continuum fitting is easy and results are robustly reliable. But when Ca triplet lines fall near the ends of orders, then (1) the fit becomes difficult because there is little continuum to fit, and (2) small fitting errors matter a lot because the line profile is divided by the low blaze efficiency.
Both problems are differently severe for different galaxies. As a result, the spectral lines that produce the most reliable results are different for different galaxies. We therefore discuss the consequences for each galaxy separately.
After continuum division, we kept parts of three orders that contain the Ca triplet lines. Two wavelength regions were used, 8450 – 8750 Å in 1024 pixels for the Fourier quotient program (FQ: Sargent et al. 1977) and 8450 – 8730 Å in 2048 pixels for the Fourier correlation quotient program (FCQ: Bender 1990). The final reduced spectra and the best fit of a standard star spectrum are illustrated in Figure 1. Our velocity dispersion measurements are discussed in § 2.3 and listed in Table 1.
2.3. Velocity Dispersion Measurements
2.3.1 M 33
We included M 33 to check our ability to measure small . We obtained two, 600 s exposures on different nights. They presented no problems. The nucleus is very compact and high in surface brightness and very distinct from the surrounding disk (see Figure 1 in § 3.1 here and Kormendy & McClure 1993). By a factor of 2, it provides the highest flux of any of our galaxies. Sky lines fall in the red wings of the 8498 Å and 8542 Å lines and in both wings of the 8662 Å line. But the galaxy signal is 11 and 9 times larger than the sky signal in the two exposures. We measured the factor by which to scale the sky spectra to the galaxy spectra to 2 % accuracy using 56 and 61 emission lines in the two spectra. This results in excellent sky subtraction. The continuum fit is relatively easy at the heliocentric velocity of km s-1 (NED). It also helps that the absorption lines are so narrow that they clobber few continuum pixels. Combining orders is easy and the dispersion measurements are reliable.
FQ and FCQ give consistent results. The K3 III standard star And gives consistently larger scatter in values than the other stars; we omit it from our averages. Then the average velocity dispersion given by the other 4 standard stars is km s-1 using FQ and km s-1 using FCQ. Quoted errors are for any one standard star. Adding in quadrature the estimated error in the mean from averaging results for 4 stars, we get km s-1 using FCQ. We adopt this result.
We tested it further by reducing six subregions of the spectra. They isolate individual Ca lines or combinations of weaker lines between the Ca lines. FCQ finds that the average intrinsic widths of the template lines in the wavelength regions tested are km s-1 to 38 km s-1. Signal-to-noise ratios are lower and estimated errors are bigger when subregions are used. But results for different subregions are consistent. In particular, we found no significant dependence of the measured on (see also § 2.3.5). There is a hint that may be 1.0 km s-1 smaller in M 33 than we derive. It is not significant, so we retain the result from the whole spectrum. Similar wavelength region tests gave similar results for all galaxies. We always tried at least one wavelength region that contains only a single Ca triplet line. This guarantees that template mismatch cannot be a problem.
Our result agrees very well with km s-1 measured with km s-1 by Kormendy & McClure (1993). Gebhardt et al. (2001) derived an integrated velocity dispersion for the whole nucleus of km s-1 using HST STIS. Merritt et al. (2001), also with STIS, found a central dispersion of km s-1 but a rapid rise in to km s-1 at radius; Ferrarese (2002) quoted an integrated velocity dispersion of km s-1 from these data. Most recently, Ho et al. (2009) got km s-1 in their catalog of 428 measurements; this is remarkably accurate given that km s-1. We adopt our measurement of km s-1; it was obtained with the highest wavelength resolution.
2.3.2 NGC 3338 and NGC 3810
Despite having the largest values in our sample – which means that there are fewer continuum pixels to fit – these are the easiest galaxies to reduce. The reason is that the heliocentric velocities ( and 993 km s-1, respectively) put the Ca triplet lines far from night sky lines and far from the ends of orders. Sky subtraction and continuum fitting are both easy. Wavelength range tests show that all lines give reliable results.
For NGC 3810, we obtained four, 600 s exposures with good seeing and nucleus centering, all taken on different nights. The flux in the nuclear spectra ranged from 3.8 to 4.7 times that of the sky spectra in the four exposures. Sky apertures were located at on each side of the galaxy major axis. They clearly contained galaxy absorption lines. Because of disk rotation, their wavelengths differed from those of the corresponding lines in the nuclear spectrum. It was necessary to be exceptionally careful to subtract disk absorption and sky emission lines correctly from the nuclear spectrum. This was done by cleaning the sky lines out of each sky spectrum to leave only the galaxy lines, smoothing the result slightly, and subtracting this from the sky spectrum to leave only sky lines. The cleaned sky spectrum was clipped to zero at low intensities to reduce noise and leave behind only the significant sky emission. The result was subtracted from the nuclear spectrum. This was done separately for each of the four nucleus spectra.
FCQ gave a velocity dispersion of km s-1 for the nucleus. This is the mean of the values for the four spectra. Each for one spectrum is an average over four standard stars. The quoted error is the sum in quadrature of the estimated error given by FCQ for one spectrum reduced with one star and the error in the mean for four standard stars.
Our measurement can be compared with km s-1 measured with an instrumental km s-1 by Héraudeau et al. (1999) and km s-1 measured with km s-1 by Vega Beltrán et al. (2001). Ho et al. (2009) adopt km s-1 credited to HyperLeda (Paturel et al. 2003) who averaged the above values.
We also reduced the absorption-line spectrum obtained through the “sky” aperture and got km s-1 at along the major axis of the disk of NGC 3810. This is not significantly different from the nuclear dispersion.
For NGC 3338, we also obtained four, 600 s exposures on different nights. The galaxy flux again was times that in the sky spectra, but this time, the sky spectra showed no significant galaxy lines. Because the overall was also a factor of two lower than for NGC 3810 and because all galaxy lines are benignly positioned with respect to night sky lines, we reduced only the sum of the four nuclear spectra. Sky subtraction was easy and FCQ gave km s-1.
For comparison, Héraudeau et al. (1999) got km s-1 at km s-1, and Ho et al. (2009) got km s-1 at km s-1. Our two largest and most easily measured values are the only ones that disagree with the Ho et al. (2009) measurements. For NGC 3810, Ho adopted a smaller from HyperLeda. For NGC 3338, Fig. 1 shows that km s-1, the near-central value in M 32. We are confident in our result. Note: our science conclusions are based on low- galaxies. No conclusions depend on NGC 3338. It is included to anchor our measurements at the high- end in Fig. 1.
2.3.3 NGC 6503
NGC 6503 and NGC 6946 (§ 2.3.4) are more difficult than M 33. At heliocentric velocities of 36 km s-1 and 46 km s-1 (HyperLeda), their Ca triplet 8498 Å and 8542 Å lines are bracketed by sky lines where they merge into the continuum. Most of each line profile is safe, but special care is required in sky subtraction. The 8662 Å line falls in a “picket fence” of night sky lines. They subtract well, but it is necessary to interpret results from this line with caution. Sky scaling factors were again determined from several dozen night sky lines.
These galaxies are also difficult because the nuclei are faint. The was therefore improved by subtracting sky only above a level of about 1.5 times the RMS fluctuations in brightness. That is, significant sky lines were subtracted, but the sky was not subtracted between the lines where it consists mostly of noise. This is consistent with advice in the online HRS manual http://www.as.utexas.edu/mcdonald/het/het.html, links on the HRS and thence on HRS Data Reduction Tips.
The less-than-fortuitous redshifts also put the 8542 Å and 8662 Å lines near the ends of spectral orders. Continuum fitting is more uncertain than normal for these lines. Therefore the most reliable velocity dispersion comes from the 8498 Å line.
For NGC 6503, we took two, 600 s exposures on different nights. The spectra of the nucleus are only 2.5 and 2.1 times brighter than the corresponding sky spectra. Therefore (i) the is relatively low and (ii) the seeing or the centering – more specifically: the degree to which the nuclear spectrum isolates light from the nucleus – is significantly better in one exposure than in the other. We reduce only the better exposure to measure the velocity dispersion of the nucleus. We reduce the sum of the sky exposures to get the velocity dispersion – albeit with still lower – in the disk. The sky apertures were positioned at PA from the major axis; that is, relatively near the minor axis of the , highly inclined disk of NGC 6503.
The nuclear spectrum was sky-subtracted using a median of the associated “sky” exposures. We assume that the inner exponential profile of the galaxy disk – i. e., the outermost part of the profile that is fitted with an exponential in Figure 16 – extends to the center. Then “sky subtraction” removes both the night sky emission lines and the contribution to the nuclear spectrum from the underlying disk. This leaves us with a spectrum (Figure 1) of the combination of the nucleus and pseudobulge (see Figure 16, where is the radius of the spectral aperture). FCQ gives km s-1 for this spectrum. As noted above, the Å line alone is more reliable than the other Ca triplet lines, given the HRS configuration and galaxy redshift. Using only this line, FCQ gives km s-1. We adopt the latter value.
The sky exposures are noisy, but they show absorption lines. We therefore reduced the sum of the sky exposures to give us an estimate of the velocity dispersion in the galaxy disk. Subtracting sky emission lines without affecting the galaxy absorption lines was tricky, because we could not afford sky exposures taken far from the galaxy. Fortunately, we had one spectrum each of NGC 3810 and NGC 5457 taken on the same night as one of the NGC 6503 spectra and one more spectrum of each of these galaxies taken a few nights later. Their redshifts are different enough so that galaxy lines in their “sky” spectra do not overlap. We therefore scaled the above four sky spectra of two galaxies together in intensity and medianed them, rejecting one low value. This very effectively removed absorption lines from the median sky spectrum. The median was scaled to the emission-line strengths in the summed NGC 6503 sky spectrum and subtracted. The result was a noisy but relatively clean spectrum of the disk of NGC 6503 at radius at PA = 53∘ from the major axis. This corresponds to a true radius of 30′′ along the major axis. For this spectrum, FCQ gave km s-1. Using only the 8498 Å line, FCQ gave km s-1. We adopt the latter value.
In § 3.4, we use to constrain . However, a problem is revealed when we compare our central with published results:
NGC 6503 is a well known galaxy; it has an extended flat rotation curve and one of the best rotation curve decompositions into visible and dark matter (Bottema 1997). And it was one of the first galaxies in which a drop in toward the galaxy center was reported. Bottema (1989) measured the dispersion profile shown in Figure 2. He found a maximum km s-1 at and then a drop at larger radii to 15 km s-1. The outward drop in is no surprise. But at , Bottema observed a highly significant drop in to 25 km s-1 in two independent central radial bins. This was unexpected at the time, but it has since become a common observation (e. g., Emsellem et al. 2001; see especially the extensive results on “ drops” from the SAURON group: Ganda et al. 2006; Falcón-Barroso et al. 2006; Peletier et al. 2007a, b). Small central velocity dispersions are now known to be a defining signature of pseudobulges that are believed to be grown by secular evolution of isolated galaxy disks (Kormendy 1993; Emsellem et al. 2001; Márquez et al. 2003; Kormendy & Kennicutt 2004; Chung & Bureau 2004; Peletier et al. 2006, 2007a, b; Kormendy & Fisher 2008). We will conclude in § 3.4 that NGC 6503 contains a small pseudobulge, based on other classification criteria. But we do not confirm the central drop.
Instead, our measurement of km s-1 agrees with km s-1 observed by Barth et al. (2002) using the Ca triplet lines at km s-1. Both values agree with the dispersion peak observed by Bottema (1989). Who is correct? Is there a central drop?
![[Uncaptioned image]](/html/1009.3015/assets/x2.png)
Velocity dispersion versus major-axis radius in NGC 6503 as measured by Bottema (1989; see also Bottema & Gerritsen 1997). Our value of the disk dispersion at a true radius of 30′′ almost along the minor axis agrees well with Bottema’s measurements along the major axis. But we do not confirm the central drop. Rather, our measurement of the central velocity dispersion is consistent with that of Barth et al. (2002; see also Ho et al. 2009).
Some aspects of the observations favor the larger central . The strongest argument is that the two results based on the best instrumental = 25 km s-1 (Barth et al. 2002) and = 8 km s-1 (this paper) agree with each other in disagreeing with Bottema’s result based on = 35 km s-1. A possible danger in Bottema’s measurement is (1) that his slit width controlled his instrumental resolution and (2) that his slit may have been wider than the image of the nucleus. If the nucleus underfills the slit, then it is easy to underestimate its . Another possible problem is the wavelength region used. We and Barth observed at Å, where an admixture of young stars has almost no effect on measurements. Bottema observed at 5020 Å. Cid Fernandes et al. (2005) show that the center is dominated by intermediate-age stars. Their blue spectrum may not be as well matched by standard stars or – for broad absorption lines – as suitable for measurements as are near-infrared spectra. Finally, Bottema measured via cross-correlation; this is less robust than FCQ (this paper) or than fitting broadened star spectra to the galaxy spectrum in pixel space (Barth et al. 2002). Of course, these caveats are not conclusive.
Some aspects of the observations probably did not cause the disagreement. Bottema’s exposure time was a heroic 35,400 s (9 h 50 m) taken in 1200 s chunks with the 2.5 m Isaac Newton telescope at La Palma. Barth’s spectrum was a 3600 s exposure taken with the Palomar 5 m Hale telescope, and ours is a 600 s exposure taken with the 9 m Hobby-Eberly telescope. Barth got high , and we got per resolution element. However, Bottema’s spectrum had good enough to allow him to measure small velocity dispersions at large radii. So it is unlikely that the central was a problem. Also, our measurement of the disk dispersion at a major-axis radius of 30′′ agrees well with Bottema’s results (Figure 2). There is no reason to believe that either set of observations is unable to measure small dispersions. Note that we measure mostly the radial velocity dispersion near the minor axis of the disk, whereas Bottema measured mostly the azimuthal dispersion; we do not expect them to be exactly equal. Finally, spatial resolution is not the issue: Bottema had 10 to 17 seeing; Barth had 15 to 20 seeing, and we had FWHM seeing. Moreover, our aperture was 3′′ in diameter, and Bottema (1989) and Barth et al. (2002) binned their spectra in spatial pixels of 264 and 374, respectively. So all three observations have poor spatial resolution. It is remarkable that Bottema saw a dispersion drop over a radius of pixels of 374 each.
Alternatively, could all results in Figure 2 be correct? This could happen as a consequence of the fact that we and Barth observed near Å whereas Bottema observed near 5020 Å. If the nucleus is colder than the pseudobulge and if it is brighter in the blue than in the infrared, then it could dominate Bottema’s result but not ours. No blue-band HST image is available to check whether the -band photometry derived in § 3.4 (Figure 16) is relevant for understanding Bottema’s data. However, the brightness contrast of the nucleus plus pseudobulge in Bottema’s spectrum (his Figure 2) looks higher than the contrast in our spectrum. Also, recall that Cid Fernandes et al. (2005) found that the center is dominated by intermediate-age stars. It is possible that Bottema measured a different stellar population than we did or than Barth did.
We therefore do not know whether NGC 6503 has a central drop in . In § 3.4, we use both values to derive nuclear mass-to-light ratios. The one based on km s-1 is more plausible. But the conservative choice is to adopt our measurement, km s-1. The Wolf et al. (2010) mass estimator used in § 3.4 is valid for any set of test particles – even ones that contribute no significant mass – provided that and the brightness distribution are measured for the same stars. This means that we must use our measured in band to match the HST surface photometry and to derive the nuclear mass . We also use it to get our limit.
2.3.4 NGC 6946
NGC 6946 has almost the same redshift and therefore almost the same data reduction problems as NGC 6503 (see the first three paragraphs of the previous section). However, we have much higher- spectra of NGC 6946, because we have four, 900 s exposures, obtained, as always, on different nights. The nuclear contrast is better than for NGC 6503 also: the nuclear spectra are 9 – 11 times brighter than the “sky” spectra. Since the latter are taken at 10′′ distance from the nuclear aperture, they are, as usual, well within the galaxy. They were positioned in the transition region between what will turn out to be a tiny pseudobulge and the galaxy’s exponential disk. However, galaxy absorption lines are negligible in the sky spectra, and sky subtraction was straight-forward.
For this galaxy, the best sky subtraction was obtained by scaling the two spectra given by the sky apertures to have the same average emission-line intensities as the nuclear spectrum using a single scaling factor for each aperture (the spectra were taken over a period of only six nights). The scale factors were determined for the two apertures by measuring the strengths of 239 and 297 lines in the four NGC 6946 spectra and in two M 33 spectra obtained during the same nights. (The number of lines used is not the same for the two sky apertures because different pixellation of almost-unresolved lines causes different problems – for example, with blends – for different lines.) The scale factors are determined to 1 %. The sky-subtracted spectra are very clean.
However, the velocity dispersion in NGC 6946 is slightly larger than that in NGC 6503, and the redshift is slightly different, too. The wings of the Ca triplet lines reach closer to the ends of the spectral orders, so continuum-fitting was more of a problem. The best single spectrum yielded an FCQ velocity dispersion of km s-1. All four spectra summed but analyzed only using the safest (8494 Å) line gave km s-1. The signal-to-noise ratios in the best spectrum and in the sum of four spectra were 292 and 416 per resolution element, respectively. The errors in are completely dominated by problems with the continuum removal. They may be underestimated by FCQ, which bases its error estimates on and on the quality of the star-galaxy spectral match.
We adopt km s-1. We therefore confirm the result in Ho et al. (2009), km s-1.
2.3.5 NGC 5457 = M 101
NGC 5457 is the most difficult galaxy in our sample: at a heliocentric radial velocity of 240 km s-1 (NED, HyperLeda), the redshifted Ca triplet lines are almost exactly centered on sky emission lines. Any oversubtraction or undersubtraction of the sky spectrum would result, respectively, in an underestimate or an overestimate of . Therefore, for each of our three, 600 s exposure spectra, we measured the sky spectra scaling factors using 45 – 55 emission lines. These factors produced relatively clean sky-subtracted absorption-line profiles. Each spectrum was reduced individually through both the FQ and FCQ programs. This provides a consistency check for the three separate sky subtractions.
However, sky subtraction proves not to be the biggest problem with the NGC 5457 spectral reductions. Instead, continuum fitting is especially difficult because the galaxy’s redshift puts the two red triplet lines too close to the ends of orders. In fact, both lines have wavelengths that appear at the blue end of one order and the red end of the adjacent order. In combining and averaging continuum-divided orders, we kept these lines only in the order in which they were farther from the end of the wavelength range covered by that order. Nevertheless, NGC 5457 – even more than our other galaxies – is best measured by the Å line, which is fortuitously located in the middle of its spectral order.
Another problem – not well known but correctly emphasized by Barth et al. (2002), by Walcher et al. (2005), and by Ho et al. (2009) – is that the Ca triplet lines are intrinsically broad. Averaged over our standard stars, the intrinsic width of the Å line is km s-1; that of Å is km s-1; and that of Å is km s-1. Once , the intrinsic widths of the absorption lines and not the instrumental resolution of the spectrograph largely control the smallest dispersions that we can measure. High overcomes most of the problem; this is why we had no trouble with M 33. Our for NGC 5457 is good; it ranges from 160 to 165 per resolution element for the three spectra. Nevertheless, the intrinsic narrowness of the Å line is another reason why results from this line alone are more reliable than those from other lines or from the whole spectrum. This remark applies to some extent to all of our galaxies with small velocity dispersions but not (for example) to NGC 3338.
With this background, our results are as follows:
For the complete wavelength range, FCQ gives km s-1 for the best spectrum and km s-1 and km s-1 for the other two spectra. The mean is km s-1. At such small , comparison to FQ is important. It gives a mean value of km s-1, in good agreement with FCQ. However:
In marked contrast, for the Å line alone, FCQ gives km s-1 for the best spectrum and km s-1 and km s-1 for the other two spectra. The mean is km s-1. Omitting only the Å line, FQ gives km s-1. For the best spectrum, FQ gives km s-1.
Recognizing that the error estimates given by FQ and FCQ do not take into account any problems with continuum fits, we conservatively adopt km s-1. This agrees with km s-1 obtained by Ho et al. (2009).
2.3.6 Adopted Velocity Dispersions
Table 1 lists our measurements and the masses derived from them in § 3. For M 33, based on HST spectroscopy was derived by Gebhardt et al. (2001). NGC 3338 and NGC 3810 are too far away to yield useful limits.
Table 1 provides an independent test of the measurements in Ho et al. (2009). Note that our smallest velocity dispersions are smaller than even for the Å line. Therefore we emphasize: Ho et al. (2009) are not much less able to measure small velocity dispersions with km s-1 than we are with km s-1. Moreover, the excellent agreement of our measurement and Ho’s of in M 33 implies that systematic errors in Ho et al. (2009) are small even at the smallest . Ho et al. (2009) actually have important advantages over our measurements: (1) They used a long-slit spectrograph, so they can more accurately subtract sky and galaxy light from near the nucleus. (2) Their spectrograph is not an echelle, so they have no problems with continuum fits and do not need to combine spectral orders. Finally, (3) their 2′′ slit is narrower than our 3′′-diameter aperture, and their seeing at Palomar Observatory likely was better than ours at the HET for most observations. Our results correct one dispersion value in Ho et al. (2009). And we generally have smaller estimated errors. But one of our main contributions is to provide independent, high-resolution verification of the large database in Ho et al. (2009) .
![[Uncaptioned image]](/html/1009.3015/assets/x4.png)
3. Properties of Nuclei and Pseudobulges
In this section, we measure surface brightness profiles of NGC 5457, NGC 6946, and NGC 6503. To do this, we combine archival HST images with ground-based images. The photometry allows us to identify and measure the properties of the central stellar components. We show that all three galaxies have nuclear star clusters embedded in tiny pseudobulges. We combine the photometry with the measurements from the previous section to measure the masses of the nuclei. And we derive BH mass limits for NGC 5457 and NGC 6503. First, as an illustration, we apply this machinery to M 33.
3.1. M 33
The nucleus of M 33 is illustrated in Figure 3. Because it is both very compact and very cold ( km s-1), strong upper limits on have been derived. Kormendy & McClure (1993) found from ground-based photometry and spectroscopy; Lauer et al. (1998) improved this to by adding HST photometry; Merritt et al. (2001) got using spatially resolved HST STIS spectroscopy and improved dynamical modeling, and Gebhardt et al. (2001), also using STIS spectroscopy and three-integral dynamical models, derived the strongest upper limit in any galaxy to date: .
The stellar mass of the nucleus was not measured in any of the above papers. We do so here. We begin by decomposing the
HST plus ground-based profile of M 33 (Gebhardt et al. 2001) into a Sérsic function plus an exponential. The fit RMS is 0.06 mag arcsec-2 and pc for the nucleus. Its total magnitude is or from Kormendy & McClure (1993) and from the above decomposition using colors from Lauer et al. (1998). The Merritt et al. (2001) dynamical models give and . The Gebhardt et al. (2001) dynamical models give and . In the rest of this section, we measure masses using the Wolf et al. (2010) estimator of the nuclear half-mass, (see the next section for a discussion). For M 33, it implies that . Note that this compares well with the mean of the results from the Merritt and Gebhardt dynamical models. We adopt the mean of all three determinations, (Table 1).
In §§3.2 and 3.4, we base limits on the minimum possible mass for a spherical stellar system plus BH. Merritt (1987) shows that this limit is achieved if all of the mass is in the central point; then . The harmonic mean radius of the M 33 nucleus is pc and . This is not competitive with HST-based limits. But even our modest limits based on such virial theorem arguments can be useful for BH demographic studies.
3.2. NGC 5457 = M 101
Giant pure-disk galaxies present the biggest challenge to our picture of galaxy formation, because they require the most hierarchical halo growth without converting any pre-existing stellar disk into a classical bulge. They also provide important constraints on BH correlations with host galaxies. This paper emphasizes such galaxies. However, the biggest galaxies are the rarest galaxies. Few are close enough for measurements. Three giant, unbarred Scd galaxies stand out as being potentially useful. IC 342 has a published limit (Böker et al. 1999). NGC 6946 is the subject of § 3.3. And NGC 5457 – the best galaxy in many ways – is discussed here.
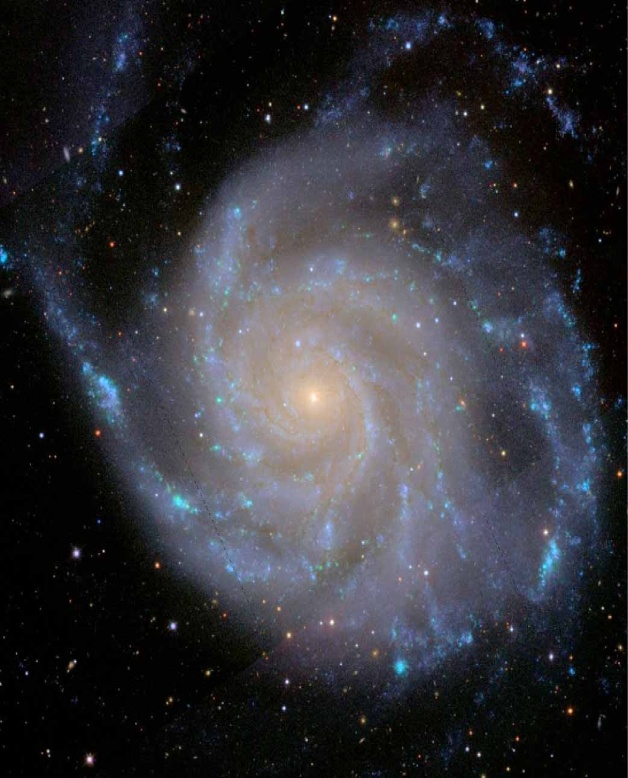
Figure 4 shows that the galaxy is completely disk-dominated. The reddish, high-surface-brightness center would traditionally be identified as a tiny bulge; this defines the Scd Hubble type. We will find that it is a pseudobulge: it has the properties of bulge-like central components that were manufactured by star
formation following secular inward treansport of gas (see Kormendy 1982, 1993; Kormendy & Kennicutt 2004 for reviews). The plausible engine for secular evolution is, in this case, spiral structure that lacks an inner Lindblad resonance. We will find that the pseudobulge makes up 2.7 % of the light of the galaxy. At its center, HST images reveal a distinct nuclear star cluster (a “nucleus”) that makes up only 0.03 % of the light of the galaxy. It is too small to be visible in Figure 4, but it is illustrated in Figure 5. Its properties provide our limit.
To understand our measurements and to estimate , we need surface photometry of all components in the galaxy. That is, we need a composite brightness profile that measures the nucleus at the highest possible spatial resolution but that also reaches large radii. It would be best (1) if this profile were observed in approximately the same wavelength range as the spectroscopy and (2) if it were insensitive to the young stars and dust that are clearly present (Figure 5).
![[Uncaptioned image]](/html/1009.3015/assets/x6.png)
Color image of the central of NGC 5457 made from -, -, and -band, HST ACS images. The nucleus is overexposed at the center. As in M 33, the nucleus is clearly distinct from the lower-surface-brightness center of the star-forming pseudobulge (see also Figure 6). Spiral dust lanes are canonically interpreted as regions where gas is being channeled toward the center (e. g., Athanassoula 1992).
We obtained spectroscopy at the Ca triplet ( Å), so -band photometry sees approximately the same stars. The HST archives contain two -band ACS images that are ideally suited to our purposes. We use these for the central profile.
However, -band images would more securely provide a brightness distribution that is proportional to the stellar mass distribution. Therefore, we constructed a -band composite profile by grafting a central profile measured using an HST archive NICMOS F190N image (brown crosses in Figure 6) to an outer profile from the 2MASS222The 2MASS survey uses a bandpass whose effective wavelength is m (Carpenter 2001; Bessell 2005). Following the above papers, we assume that . Then the -band absolute magnitude of the Sun is 3.29 (Cox 2000). Except in this footnote, we call the 2MASS band “” for convenience. Large Galaxy Atlas (Jarrett et al. 2003) (brown filled circles in Figure 6.) The problem is that the NICMOS PSF and the NIC3 scale of 02 pixel-1 substantially smooth the (as it turns out) tiny nucleus. Therefore we used the ACS -band profile interior to , and we verify that band is an accurate surrogate for band in Figure 6.
Even in HST band, the PSF causes significant smoothing. We therefore applied 40 iterations of Lucy-Richardson deconvolution (Lucy 1974, Richardson 1972), as in Lauer et al. (2005). We used a VISTA program that was written and kindly made available by T. R. Lauer; it was thoroughly tested in Lauer et al. (1992, 1995, 1998). The composite profile constructed from the deconvolved -band profile at radii and from the 2MASS profile at is illustrated in Figure 6.
The next step was to decompose this profile outside the nucleus at into an exponential disk and a Sérsic (1968) function (pseudo)bulge. The Sérsic and exponential fits are shown by black dashed curves in Fig. 6; their sum is the black solid curve. It fits the observed profile to an RMS of 0.069 mag arcsec-2 in the fit range. Since we need to constrain the (pseudo)bulge properties accurately, we did not worsen the disk fit by including the outermost three points.
![[Uncaptioned image]](/html/1009.3015/assets/x7.png)
The brown points show the major-axis, -band brightness profile of NGC 5457. They are a composite of the 2MASS Large Galaxy Atlas profile (Jarrett et al. 2003) at large radii and a deconvolved -band HST ACS profile shifted in to agree with the outer profile where they overlap (25 – 110). Also shown is an HST NICMOS F190N profile (crosses) similarly shifted to the 2MASS outer profile. The black lines show a decomposition of the profile outside the nuclus into an exponential disk and a Sérsic function (pseudo)bulge (dashed black lines). Their sum (solid black line) fits the observed profile in the fit range (vertical dashes) with an RMS of 0.069 mag arcsec-2. The Sérsic index of the inner component is (key). Subtracting the fit from the observed brightness profile provides the brightness profile of the nucleus (open red circles). A Sérsic function fitted to the well defined inner part of the nucleus gives the red curve (). The nuclear profile is determined entirely from the deconvolved ACS -band image. To check that this accurately represents the inner -band light, we convolved the deconvolved ACS image with the NICMOS PSF and resampled the resulting image at NIC3 scale. This gives the profile of the nucleus that is shown by the red plus signs. It agrees well with the profile measured in the NICMOS image. This shows that the -band image is a good high-spatial-resolution surrogate for the -band light.
The Sérsic index of the (pseudo)bulge is 1.91. Many authors have found that classical (we believe: merger-built) bulges almost all have and that observing correlates with other indicators that the “bulge” was built out of the disk by secular evolution (Courteau et al. 1996; Carollo et al. 1997, 1998, 2001, 2007; Carollo 1999; MacArthur et al. 2003; Balcells et al. 2003; Fathi & Peletier 2003; Kormendy & Kennicutt 2004; Kormendy & Cornell 2004; Scarlata et al. 2004; Peletier 2008; Fisher & Drory 2008, 2010; Gadotti 2009; Ganda et al. 2009; Weinzirl et al. 2009; Mosenkov et al. 2010). We conclude that NGC 5457 contains a pseudobulge. Further evidence for a pseudobulge is provided by the fact that the parameters do not fit the fundamental plane correlations for classical bulges and ellipticals (Kormendy et al. 2009; Kormendy 2009). Finally, star formation and spiral structure (Fig. 5) are additional pseudobulge indicators (Kormendy & Kennicutt 2004).
The magnitude of NGC 5457 obtained by integrating the profile in Fig. 6 to its outermost point is . This agrees well with the total magnitude, , given by the 2MASS Large Galaxy Atlas. The total magnitude of the pseudobulge given by our decomposition is 9.42. So the pseudobulge-to-total luminosity ratio is (Table 2).
To use to derive an limit, we need the properties of the nucleus. This is much smaller and denser than the already tiny pseudobulge (Figures 5 and 6). We derive the brightness profile of the nucleus by subtracting the pseudobulge-plus-disk model (black curve in Figure 6) from the observed profile. The result is the profile shown by the red open circles in Figure 6.
The total magnitude of the nucleus obtained by integrating its profile and taking into account its average axial ratio, , is . Because this result is very sensitive to small wiggles in the observed profile caused by azimuthally averaging star formation, dust absorption, and noise, we also fitted a Sérsic function to the well defined, inner parts of the profile (red solid curve in Figure 6). This gives a total nuclear magnitude of . The corresponding ratios of nuclear to total light are and 0.00025, respectively. So the nucleus contains % of the light of the galaxy. This is approximately one-quarter of the typical ratio of supermassive BHs to the mass of their host elliptical galaxies and near the bottom end of the range of observed values (e. g., Merritt & Ferrarese 2001; Laor 2001; McLure & Dunlop 2002; Kormendy & Bender 2009, in which the correlation between and core missing light – their Fig. 2 – adds additional support for small values).
We need to address one more issue before deriving a nuclear mass and limit. This is the appropriate value of to use. Ho et al. (2009) find a nuclear dispersion km s-1. We observe km s-1 in a 3′′-diameter aperture centered on the nucleus. These values are consistent, but we briefly explore the difference. Integrating the total composite profile of the galaxy (brown filled circles in Figure 6) inside gives a -band magnitude of 12.81. Comparing this to the above total magnitude of the nucleus implies that the fraction of the light seen by our spectral aperture that comes from the nucleus is 0.24 from the integration of the nuclear profile or 0.20 from the Sérsic fit. Moreover, the seeing FWHM as measured from the setup exposures was about . This blurs more nuclear light out of our aperture. We conclude that we measured the central velocity dispersion of the pseudobulge. Ho et al. (2009) had better seeing at the Palomar 5 m telescope and better skypseudobulge subtraction via their long-slit spectra. Their central may be a better measurement of the nucleus. In particular, it may be a hint that the velocity dispersion of the nucleus is smaller than that of the pseudobulge. This would be consistent with other observations of drops in nuclei and in pseudobulges (see references in § 2.3.3). It favors the conclusion that BHs are small in bulgeless galaxies. However, given measurement errors, we adopt the weighted mean of the two measurements, km s-1, for the nucleus.
First, we estimate the mass of the nuclear star cluster. Wolf et al. (2010) present a new mass estimator,
where is the mass contained within , the radius of the sphere that contains half of the light of the unprojected light distribution. Also, is the line-of-sight projected velocity dispersion, is the half-light radius of the projected light distribution, and is the gravitational constant. This estimator has two virtues for our case: (1) It uses self-consistent properties , , and of any tracer population – in this case, the stars that contribute most of the light – even when these have a radial distribution that is different from the unknown radial distribution of mass. That is, it does not require the assumption that mass follows light. (2) Wolf et al. (2010) show that is a “sweet spot” radius whose choice ensures that is minimally sensitive to unknowns like the velocity anisotropy of the tracer particles. We then assume that .
The nucleus of NGC 5457 has from an integration of the observed PSF-deconvolved brightness profile. Multiplying by , the mean pc. Then equation (1) gives . The integral of the nuclear profile also gives , , and hence a total nuclear luminosity of . Half of this is and so the nucleus has a global mass-to-light ratio of .
Similarly, the Sérsic fit to the nuclear profile gives corresponding to a mean of 5.8 pc. Equation (1) gives and an integral of the Sérsic fit gives , , and hence a total nuclear luminosity of . Half of this is and so the nucleus has a global mass-to-light ratio of .
In the above, we assumed that the distance to NGC 5457 is Mpc (see Table 2). Also, the absolute magnitude of the Sun is (Cox 2000; footnote 7 here).
A check on the above ratio is provided by estimating the mass and light inside the core radius . An approximate is provided by King (1966) core fitting, , where is the central surface brightness and is the radius at which the surface brightness has fallen by a factor of 2 from the central value. From the Sérsic fit to the nucleus, we derive an upper limit on the core radius, and a lower limit on the central surface brightness, corresponding to 11.41 mag arcsec-2. The product is much less sensitive to resolution than either value is individually (Kormendy & McClure 1993). This gives . Note that this is an estimate of the central volume (not projected) ratio. The core mass-to-light ratio of the nucleus is remarkably similar to the global value. This strengthens the justification that our measurements of ratios and masses are realistic. The uncertainty is that we had to assume that is independent of radius. This has been verified in M 33 (Kormendy & McClure 1993; Gebhardt et al. 2001; contrast Merritt et al. 2001) but not in our present galaxies.
The above mass-to-light ratios are intermediate between values of that are normal for old stellar populations and the smallest values observed for the youngest stellar populations (Böker et al. 1999). We need this in order to understand the stars. Assuming below that therefore gives a strong upper limit on .
A limit on can be derived by making dynamical models of the light distribution and the luminosity-weighted total with and as free parameters. Merritt (1987) shows that the total mass is minimized by putting all of the mass into a point at the center. Independent of velocity anisotropy, this minimum is , where is the mean-square stellar velocity and is the harmonic mean radius of the cluster. We assume isotropy and adopt . Barth et al. (2009) arrive at the same conclusion by using Jeans models to explore the tradeoff between and for the nucleus of the Sd galaxy NGC 3621; for this example, the range of masses obtained for plausible anisotropies is small. For the nucleus of NGC 5457, we measure . Correcting for flattening, pc. Therefore we conclude that . In comparison, the mass of the nucleus is (Table 1).
3.3. NGC 6946
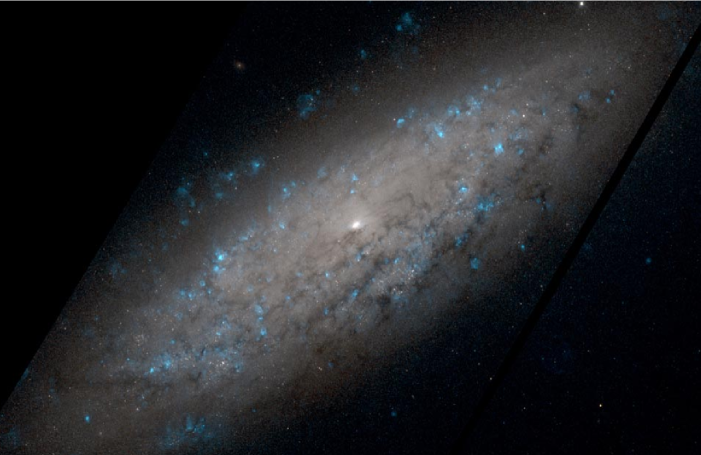
Globally, NGC 6946 is very similar to NGC 5457. It has the same Scd Hubble type. It has almost the same luminosity ( versus for NGC 5457), inclination-corrected maximum rotation velocity ( km s-1 versus km s-1 for NGC 5457), and distance (5.9 Mpc versus 7.0 Mpc for NGC 5457; see Tables 1 and 2). It is less well known than NGC 5457 because it is heavily obscured by our Galactic disk. We adopt absorptions , , and (NED, following Schlegel et al. 1998).
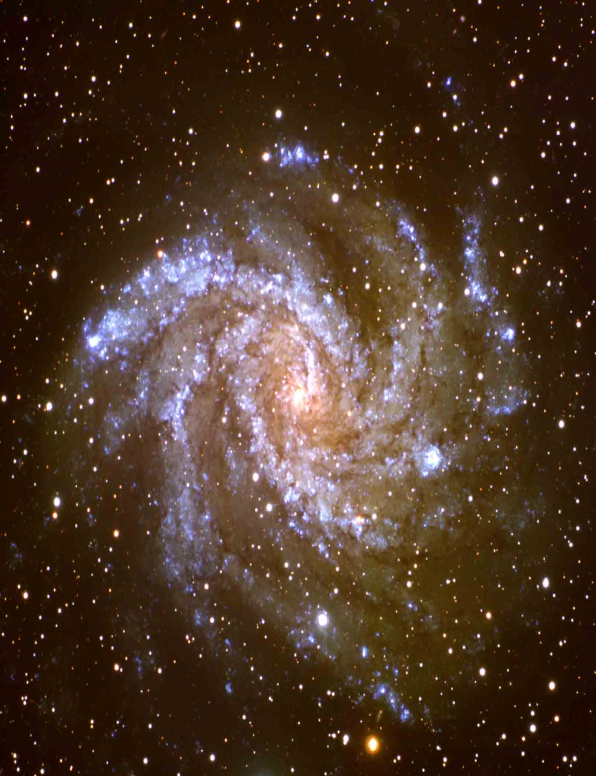
Figure 7 illustrates the similarity to NGC 5457. We tried to match the color scheme of Figure 4 but did not fully succeed: the bandpasses are different, and the correction for foreground reddening is not perfect. In fact, the galaxies have similar dereddened total colors: for NGC 6946 and 0.44 for NGC 5457. Both disks are dominated by ongoing star formation. A difference is that NGC 6946 has a compact central concentration of molecular gas and a nuclear starburst; we will detect this gas dynamically. We will not find a secure limit.
Like NGC 5457, NGC 6946 has no hint of a classical bulge. In photometry discussed below, the overexposed red center shown in Figure 7 proves to be a pseudobulge. As in NGC 5457, it is easy to identify an engine for secular evolution: the spiral structure and associated dust lanes reach the nucleus, so there is no effective inner Lindblad resonance (see Kormendy & Norman 1979) that acts as a barrier to inflowing gas. However, we expect that secular evolution is slow in a barless Scd galaxy (Kormendy & Kennicutt 2004; Kormendy & Cornell 2004). So, as in NGC 5457, it is no surprise that the pseudobulge of NGC 6946 is tiny. It adds up to 2.4 % of the -band light of the galaxy.
At the center of NGC 6946 is an even tinier nucleus (Fig. 8) that is seen in the -band decomposition of Fisher & Drory (2008) but that is still more obvious in band. Large color gradients in NGC 6946 imply (in contrast to NGC 5457) that the nucleus is dominated by young stars. To measure its mass, it is important that we measure its brightness profile at the same wavelength that we used in our spectroscopy to measure . We therefore work in band.
![[Uncaptioned image]](/html/1009.3015/assets/x9.png)
Color image of the central of NGC 6946 made from F547M-, F606W-, and F814W-band, HST WFPC2 images. North is up and east is at left. The nucleus is overexposed at the center. As in M 33 and NGC 5457, the nucleus is clearly distinct from the lower-surface-brightness center of the star-forming pseudobulge (see also Figures 9 – 11). The pseudobulge is irregular due to patchy star formation and differently patchy absorption. Its SE – NW elongation causes the maximum at in Figure 9; this was called a “nuclear bar” by Elmegreen et al. (1998). The galaxy looks less patchy in and bands, but it continues to be brightest at the same nucleus.
3.3.1 -Band Photometry and Nuclear Mass Estimates
Figures 9 – 11 show the brightness profile of NGC 6946. The individual measurements are shown in Fig. 9; their average is in Fig. 10 and 11. Figure 9 also shows ellipticity profiles .
At , we used an -band profile from the McDonald 0.8 m telescope measured and kindly provided by Fisher & Drory (2008). At , we measured the profile in an HST ACS F814W image, and at , we measured it in the WFPC2 F814W image used in Figure 8. Where they overlap, the HST profiles agree almost perfectly (RMS difference 0.030 mag arcsec-2 for 49 overlapping points omitting one deviation of 0.138 mag arcsec-2). We also measured the ACS profile after 40 iterations of Lucy-Richardson deconvolution. However, HST easily resolves the central flat profile, so deconvolution makes no significant difference. We adopt the undeconvolved profile.
We used the -band VEGAmag zeropoint 25.53561 mag (http://www.stsci.edu/hst/acs/analysis/zeropoints) for ACS observations taken before 2006 July 4. To estimate the total magnitude of the galaxy, we extended the observed profile using the exponential fit in Figures 9 – 11. Integrating this extended profile together with the ellipticity profile gives a total apparent magnitude of . This compares very well with found by Makarova (1999). Also, our exponential disk fit in Figures 9 – 11 has an apparent central surface brightness of 19.44 mag arcsec-2 and a scale length of 1159. Makarova got 19.41 mag arcsec-2 and 1131, respectively. Springob et al. (2007) got extrapolated to 8 disk scale lengths. However, we and Springob extrapolate the surface brightness profile to 23.5 mag arcsec-2 at and , respectively. So the agreement in zeropoints, parameters, and total magnitudes is good.
![[Uncaptioned image]](/html/1009.3015/assets/x10.png)
Major-axis, -band brightness profile of NGC 6946. Black lines show a decomposition in the fit range (vertical dashes) into an exponential disk and a Sérsic pseudobulge (dashed black lines). Their sum is the solid black line. The Sérsic index of the pseudobulge is (key). Subtracting the fit from the observed profile gives the profile of the nucleus (open red circles). A Sérsic fit to the nuclear profile (red curve) has .
However, it is unrealistic to think that we know the total magnitude to better than mag. Reasons include the irregularities introduced by patchy star formation and dust absorption, spiral structure, and the overall disk asymmetry. The ellipticity measurements are uncertain at large radii. The brightness and the ellipticity profiles must be extrapolated to get the total magnitude; we do not know whether the disk has an outer cutoff. Even the uncertainties of foreground star removal are not negligible. We adopt from our photometry. With and an adopted distance of 5.9 Mpc (Table 2), the total absolute magnitude of NGC 6946 is (keys to Figures 9 – 11).
To derive , we need the -band total luminosity and the effective radius of the nucleus. Also, we need to know that our spectroscopy measured its velocity dispersion. And we need a reliable classification and total luminosity of the (pseudo)bulge. All of these require decomposition of the observed brightness distribution into nuclear, bulge, and disk contributions, with due regard to uncertainties introduced by the patchy light distribution in Figure 8.
Figures 9 – 11 show three decompositions. The disk fit is identical in all three. The overall fit to the (pseudo)bulge is best in Figure 9: we fit all of the profile outside the nucleus. Figures 10 and 11 provide error bars on the (pseudo)bulge parameters.
![[Uncaptioned image]](/html/1009.3015/assets/x11.png)
Composite brightness profiles of NGC 6946. Black lines show a Sérsic – exponential decomposition of the extra-nuclear profile in two radial ranges (vertical dashes) that omit points between and 2.27. This gives (solid black line) a better fit to the central pseudobulge profile and a more accurate extrapolation into the nucleus. The nuclear profile and Sérsic fit were then calculated as in Figure 9.
The good fit to the central, almost-constant-surface-brightness part of the (pseudo)bulge in Figure 10 provides the best extrapolation into the nucleus and therefore the best brightness profile of the nucleus. The decompositions in Figures 9 and 11 are used to provide error bars on the nuclear parameters. The profile of the nucleus is so steep that these errors are small.
Figure 9 shows a decomposition of all of the profile outside the nucleus. Between the vertical tics (), an outer exponential profile an inner Sérsic (1968) function fit the data with an RMS of 0.19 mag arcsec-2. The RMS is dominated by the poor (pseudo)bulge fit; the fit to the disk is good to a few percent. The measurements of the (pseudo)bulge are accurate – the ACS and WFPC2 profiles agree almost perfectly – but given the asymmetric and patchy star formation and dust, the idea that the brightness distribution in Figure 8 can be described by , , and a position angle profile is more approximate than usual.
Happily, the fit in Figure 9 is easily adequate for our needs. We do not use it to measure the (pseudo)bulge magnitude. We use it only to help classify this component and to estimate how much light it adds to the nucleus. First, the classification: Its Sérsic index is . The range in Figures 10 and 11 is to . Robustly, . Many papers (cited in § 3.2) have shown that this implies that the component is a pseudobulge.
Note: There is no sign of a classical bulge in NGC 6946: i. e., one that has and that satisfies the fundamental plane correlations for elliptical galaxies (see Carollo 1999, Kormendy & Fisher 2008, Fisher & Drory 2008, and Gadotti 2009 for bulge-pseudobulge comparisons).
Next, we need to derive the brightness profile and the structural parameters of the nucleus. Extrapolating the sum of the exponential and Sérsic-function fits in Figures 9 – 11 (solid black curves) to smaller radii provides three estimates of the amount of pseudobulge light that underlies the nucleus.
![[Uncaptioned image]](/html/1009.3015/assets/x12.png)
Composite brightness profile of NGC 6946. Black lines show a Sérsic – exponential decomposition of the extra-nuclear profile in two radial ranges (vertical dashes) that omit points between and 1.80. This gives the largest (pseudo)bulge that is consistent with the data. The extrapolation into the nucleus is fortuitously almost identical to that in Figure 9. The nuclear profile and Sérsic fit were calculated as in Figure 9.
Subtracting these from the observed profile gives the nuclear profile. It is shown by open circles in Fig. 9 – 11. Fortunately, the pseudobulge contributes little light underlying the nucleus in band. So uncertainties in the above extrapolation are small. Sérsic fits to the nuclear profiles are shown by the red curves in Figures 9 – 11. The most accurate inner pseudobulge fit and therefore plausibly the best extrapolation is the one in Figure 10. The resulting Sérsic index of the nucleus is . The nuclear profile at falls off almost as steeply as a Gaussian (). The other two decompositions provide error bars. We conclude that . One consequence is that the effective and harmonic mean radii are well constrained. This improves our mass estimates.
The Sérsic fits in Fig. 9 – 11 give major-axis effective radii of the nucleus, , , and , respectively. Alternatively, integrating the observed profiles implies that , , and . We adopt along the major axis. Since the ellipticity of the nucleus is (Figure 9), the mean effective radius that is relevant for Virial theorem arguments is = = pc.
Averaging all three decompositions, the total magnitude of the nucleus corrected for its flattening is . The corresponding absolute magnitude is . The nucleus-to-total luminosity ratio is .
Getting the pseudobulge-to-total luminosity ratio is trickier, because none of the three decompositions is adequate to provide the pseudobulge magnitude from the Sérsic fit. Instead, we exploit the excellent fit of the exponential to the disk profile. The disk dominates at . We therefore measure the pseudobulge nucleus contribution by integrating the observed brightness and ellipticity profiles out to the above radius and subtracting the exponential disk fit integrated to the same radius with (Figure 9). We then subtract the nucleus. This gives the pseudobulge apparent and absolute magnitudes, and . The pseudobulge-to-total luminosity ratio is . Large color gradients in NGC 6946 imply that and are different in other bandpasses. But in NGC 6946 is similar to in NGC 5457. Both pseudobulges are tiny.
Before estimating masses, we need to check whether our spectra adequately measure in the nucleus of NGC 6946. Comparing with the integral of the total brightness and ellipticity profiles out to the radius of our input fiber implies that 52 % of the light in our spectra came from the nucleus. The real contribution is slightly smaller because of seeing. However, recall that we measured km s-1, whereas Ho et al. (2009) got km s-1. We expect that the Ho et al. (2009) spectra have better spatial resolution than our own. One possible concern is that nuclear velocity dispersions may be slightly smaller than pseudobulge dispersions in NGC 5457 (§ 2.3.5) and NGC 6503 (§ 2.3.3). But our excellent fits of broadened standard star spectra to the line-of-sight velocity distributions exclude roughly equal contributions to our NGC 6946 spectra from two components that have very different velocity dispersions. We therefore feel safe in adopting km s-1 for the nucleus.
We now derive the dynamical mass of the nucleus using the Wolf et al. (2010) estimator. As in NGC 5457, the nucleus has a steep enough profile – steeper than deprojected – so that we can treat it as an independent dynamical system (Tremaine & Ostriker 1982). Then = pc and km s-1 imply that the nuclear half-mass is . From , half of the -band luminosity is . So the mass-to-light ratio inside a sphere that contains half of the mass of the nucleus is .
A check on this result is provided by the core ratio. It is better determined in NGC 6946 than in NGC 5457 because a flat profile is well resolved at the center. Its physical origin is unlikely to be the same as those of the cores in globular clusters or in elliptical galaxies. However, estimates of how much gravity is required to bind the near-central stars do not depend on this physics. Also, pc is small; if the three-dimensional velocity dispersion is , then a typical star travels a distance of in 140,000 yr. This is much less than the lifetimes of even the most massive stars. It seems safe to assume that the core and, indeed, all of the nucleus is well mixed and in dynamical equilibrium. The central surface brightness is mag arcsec-2, and the mean core radius is = pc. Then the core mass-to-light ratio is = . This is in excellent agreement with the global mass-to-light ratio estimated above. Note that , so this is a check on our machinery rather than a check on whether depends on radius. The core mass is . All estimated errors here are internal; they do not include distance, magnitude zeropoint, or model assumption errors.
The question is: What objects dominate and ? Possibilities include stars (which can be obscured by dust), gas, and a central BH. For stars, is normal for an old stellar population in a globular cluster (Wolf et al. 2010, see Fig. 4) or a small early-type galaxy (Cappellari et al. 2006, see Fig 8). Star formation is in progress in NGC 6946, but our Figure 8 also shows patchy absorption. We need to look at the situation in more detail to see how consistent our results are with the sum of a central concentration of gas plus a partly absorbed, mixed-age stellar population.
3.3.2 - and -Band Photometry and Mass Estimates
We therefore measured -, -, and -band profiles (Fig. 12). The -band profile was measured using an HST NICMOS NIC3 F190N image zeropointed to the 2MASS Large Galaxy Atlas profile (Jarrett et al. 2003). We abbreviate as “”. The -band profile was measured using a NICMOS NIC2 F160W image zeropointed to the 2MASS -band profile. Unlike the - and -band profiles, the HST and profiles required 40 iterations of Lucy-Richardson deconvolution using PSF stars in the images. Finally, we remeasured the -band profile using an HST WFPC2 PC F547M image. The zeropoint is from Dolphin (2009). In Figure 12, the outer -band profile is from Fisher & Drory (2008) shifted to our zeropoint.
The contrast of the nucleus above the pseudobulge is smaller at and than at , so we do not try profile decomposition. Instead, we estimate core masses and ratios using the total profiles in Figure 12. In band, = 060 = 17 pc; ; . In band, = 069 = 20 pc; ; . These infrared mass-to-light ratios are smaller than those of unobscured, old stellar populations. This suggests that the nucleus contains young stars that are partly obscured at optical wavelengths.
![[Uncaptioned image]](/html/1009.3015/assets/x13.png)
Composite -, -, -, and -band, major-axis brightness profiles of NGC 6946. All individual profiles that are used in this paper are shown.
3.3.3 Stellar Population Models and the
Stellar Mass of the NGC 6946 Nucleus
We therefore compare our results with models of stellar populations that include starbursts and internal absorption. The modeling machinery from Drory et al. (2004a, b) was used to fit the central surface brightnesses, mag arcsec-2, mag arcsec-2, mag arcsec-2, and mag arcsec-2. Relative errors are estimated from plausible zeropoint and photometry errors. The foreground extinctions were assumed to be , , , and (Schlegel et al. 1998). An example of such a model is shown in Figure 13.
Each model consists of the sum of a starburst with constant star formation rate for the past 50 Myr and a stellar population of intermediate to old age. Its spectrum is synthesized using the Charlot & Bruzual (2010) stellar population synthesis library that incorporates an improved treatment of thermally-pulsating
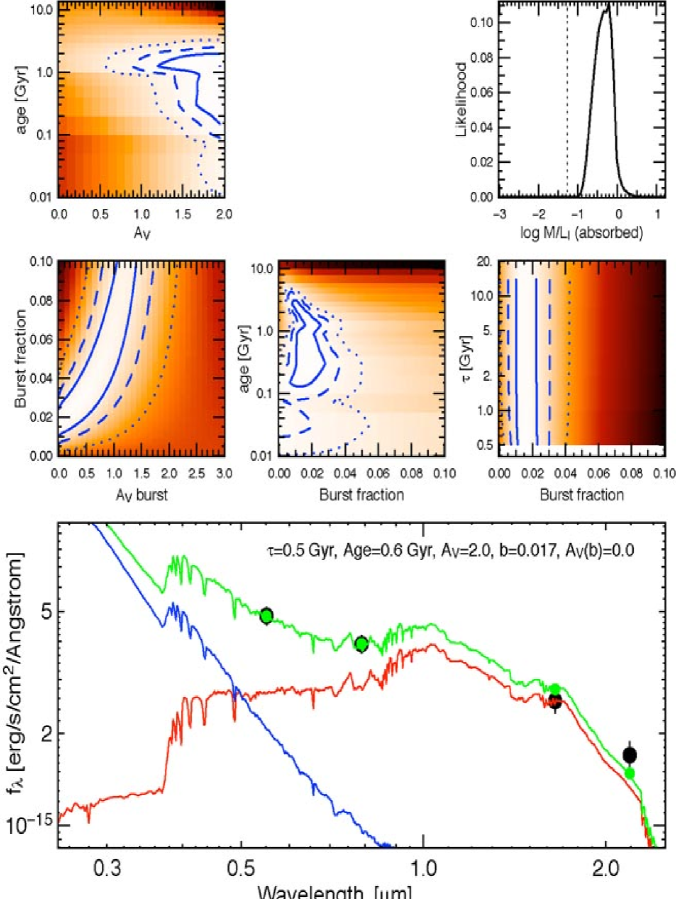
asymptotic giant branch (TP-AGB) stars. They dominate intermediate-age (0.5 – 2 Gyr old) populations from the band through the near-infrared (Maraston 2005; Maraston et al. 2006). They can lead to changes of up to a factor of 2 – 3 in the stellar mass estimates for starbursts such as the one in NGC 6946. In Figure 13, the burst fraction , the internal absorptions and of the burst and of the older population, the latter’s age, and its star formation -folding time are free parameters. We want to know the total mass-to-light ratio of the extincted model. The upper-right panel of Figure 13 shows the likelihood distribution of the extincted marginalized over all other parameters. The most likely unextincted (dashed line). But the extincted ratio has a median value of and a most likely value of . It is robustly less than the observed value .
Stellar populations have much more freedom than Figure 13 explores. With only four points in a spectral energy distribution (SED), our model fits are underconstrained. Some parameters are especially unconstrained. E. g., we can trade burst fraction against the absorption of the older population (modifying the burst extinction) and produce good fits that are dominated either by the starburst or by the older population. But putting more light into the starburst forces us to increase its absorption. And trying to force higher mass-to-light ratios by adding priors that favor older stars forces the fit to put more light into less obscured, young stars in order to fit the - and -band points. Trying to increase by allowing higher extinctions has the same effect. The fitting procedure wants most of the light to be only moderately extincted. The result is that the extincted is constrained to be – 1. Favored mass-to-light ratios are (median) to 0.61 (most probable) and (median) to 0.039 (most probable).
Urged by the referee, we also tried three-component models. The added, old population has an age of 8 Gyr. The results are similar. Favoring young stars produced a , acceptable fit with an extincted, total . Forcing the intermediate-age population to contribute most of the light forced the extinction to be very low; at . Forcing the old population to contribute significantly at and forced the young population to fit and . That model has but . As long as the SED observations control the population mix, to 1 rather than as observed.
This implies a weak detection of more dynamical mass than we can account for with stellar populations that fit our SED. From and a stellar mass of (8 – 31) from the Fig. 13 models or (12 – 31) from the three-component models, we can estimate that the nonluminous material has a mass of (20 – 50) .
3.3.4 Molecular Gas Mass in the NGC 6946 Nucleus
It turns out that the above, nonluminous mass is reasonably consistent with the molecular gas mass in the nucleus. There is a large literature on the gas content and starburst in the center of NGC 6946; we concentrate on results that help us to interpret our mass measurement. In the optical, the center of the galaxy shows an H II region spectrum but not a LINER or a Seyfert nucleus (Ho et al. 1995, 1997). The nucleus plus pseudobulge contain both an -band mid-infrared source (Telesco et al. 1993) and an X-ray source (Ptak et al. 1999; Schlegel 1994; Schlegel et al. 2000, 2003). However, it satisfies X-ray–infrared correlations for starburst galaxies that are clearly separated from correlations for Seyferts (Krabbe et al. 2001). This is one sign among many that a starburst is in progress.
An early study by Engelbracht et al. (1996) found km s-1 and km s-1 from two independent analyses of the spectra of CO absorption bands at 2.3 m wavelength taken in a 24 8′′ aperture. This is consistent with our measurement. They fitted their flux and mass constraints with starburst models and favored a model with two instantaneous bursts, one that made of stars 7 million years ago and a second burst that made of stars 27 million years ago. They concluded that “the high rate of star formation in the nucleus of NGC 6946 must be episodic in nature rather than continuous throughout the lifetime of the galaxy.”
The highest-resolution line observations are IRAM Plateau de Bure Interferometer CO measurements by Schinnerer et al. (2006, 2007) with resolutions and , respectively. Their highest-resolution (“inspector”) rotation curve in Fig. 10 formally gives . This is not very different from our . The true mass is likely to be larger because beam-smearing affects and because the velocity dispersion of the gas is neglected. The molecular gas reaches a maximum central velocity dispersion of 50 and 42 km s-1 in the 12CO(1–0) and 12CO(2–1) lines, respectively (Schinnerer et al. 2006). These values are reassuringly consistent with Engelbracht et al. (1996) and with our results.
Most importantly, Schinnerer et al. (2006) estimate that the mass of molecular gas interior to pc is . Within measurement errors, this is similar to our dynamical estimate of the central dark matter. There is room for a BH whose mass is a few tens of millions of but no secure dynamical evidence that such a BH must be present.
3.3.5 Caveat No Limit
Many of the above papers conclude that the central starburst is essentially completely obscured. Our results do not require this conclusion. The - and -band HST images show the same nucleus as the and images even though the extinction is much smaller in the infrared. The stellar population models require that the optical light comes mostly from young stars. Of course, some stellar mass could be hidden from all photometry by putting it behind a completely opaque screen. But that screen would be transparent to CO line measurements. It is reassuring that the CO velocity dispersion of the central molecular cloud agrees with the -band stellar velocity dispersion of the nucleus. Since their linear sizes are similar, the implied dynamical masses are similar. Nevertheless, the potential that some stellar mass is completely hidden makes it impossible for us to derive an value or limit.
3.3.6 Episodic Growth of the Nucleus and Pseudobulge
Schinnerer et al. (2006, 2007) note that NGC 6946 contains prototypical examples of a nucleus and pseudobulge that are caught in the act of growing by the internal secular evolution of isolated galaxy disks (Kormendy & Kennicutt 2004). With a stellar mass of and a molecular gas mass of (Schinnerer et al. 2006), the stellar mass will at least double when the present gas has turned into stars.
Other nuclei are seen in earlier and later stages. The blue nucleus of M 33 (§ 3.1) still has an A-type optical spectrum indicative of several past starbursts (van den Bergh 1976, 1991; O’Connell 1983; Schmidt et al. 1990; Kormendy & McClure 1993; Lauer et al. 1998; Gordon et al. 1999; Long et al. 2002), but it has no substantial molecular gas (Rosolowsky et al. 2007). In NGC 4593, gas is accumulating near the center but not yet starbursting. Kormendy et al. (2006) suggest that the “starburst events that contribute to pseudobulge growth can be episodic.”
3.4. NGC 6503
NGC 6503 (Figures 14 and 15) is an Scd galaxy that is smaller than NGC 5457 and NGC 6946. It has a rising rotation curve over the inner , i. e., roughly the radius range shown in Figure 14, and then a well known, flat outer rotation curve with km s-1 (van Moorsel & Wells 1985; Begeman 1987; Begeman et al. 1991) out to . This is similar to in M 33. NGC 6503 is another example of a pure-disk galaxy; it is not in the § 4 sample because km s-1.
Two HST archive images include the nucleus, an F814W image that defines our photometry bandpass and an F650N image that includes H emission. Color images of the galaxy and its nucleus plus pseudobulge are constructed from these images in Figures 14 and 15. The wavelength range is small, so colors look bland. But absorption and star-formation regions are recognizable, and the figures serve to emphasize how thoroughly this is a pure-disk galaxy.
The tiny, bright center that is saturated in Figure 14 is resolved in Figure 15 into an elongated structure that resembles a nuclear bar (see also González-Delgado et al. 2008). The disk-like or bar-like morphology is sufficient to identify this as a pseudobulge. It surrounds a distinct, high-surface-brightness nucleus. NGC 6503’s distance is only 5.27 Mpc (Karachentsev et al. 2003c; Karachentsev & Sharina 1997). So the nucleus provides another opportunity to use ground-based spectroscopy to derive an limit in a pure-disk galaxy.
![[Uncaptioned image]](/html/1009.3015/assets/x16.png)
Color image of the central of NGC 6503 made as in Figure 14 but with a different square-root stretch to show the central bar-like pseudobulge and nuclear star cluster. Both together are saturated in Figure 14.
![[Uncaptioned image]](/html/1009.3015/assets/x17.png)
VEGAmag -band surface brightness and ellipticity profiles of NGC 6503. Black lines show a decomposition into nuclear, pseudobulge, and disk components; their sum is shown in dark red. The nuclear profile is exponential. Two Sérsic functions, the inner of which is essentially Gaussian, are required to fit the pseudobulge; they should not be interpreted as physically separate or distinct components. The outer exponential is fitted to the inner, flat part of the Freeman (1970) “Type II” profile of the disk. The fit range is shown by vertical dashes; the RMS of the fit is 0.063 mag arcsec-2. The inner pseudobulge brightness shelf has essentially the same flattening as the outer disk; it is the disk-like or bar-like feature seen around the nucleus in Figure 15. The ellipticity wiggles at to 1.9 are caused by patchy dust (see Figures 14 and 15).
The major-axis brightness profile of NGC 6503 is shown in Figure 16. All of our results except our measurement of the total magnitude of the galaxy are based on the -band profile derived from the HST ACS F814W image. However, this profile was extended to by averaging an -band profile from Bottema (1989) and a -band profile from Héraudeau et al. (1996) both shifted to the present zeropoint. Over this wavelength range, color gradients in the galaxy are small.
Figure 16 shows the central profile after 40 iterations of Lucy-Richardson deconvolution. However, all analysis was also carried out in parallel on the undeconvolved profile. We use both sets of results below.
To estimate the total magnitude of the galaxy and to check our zeropoint, we extended the observed profile by fitting an exponential to the outer, steep profile that is just beginning to be visible at the largest radii shown in Figure 16. This is the outer exponential in the Freeman (1970) Type II profile of the galaxy. Integrating this extended profile and the ellipticity profile gives a total apparent magnitude of . This compares well with in Héraudeau et al. (1996) and with and 9.02 using magnitudes and colors from the main and integrated photometry tables in HyperLeda. Magnitudes and colors from the RC3 (NED) give . Makarova (1999) gets . We adopt our total magnitude but again note that it is unrealistic to think that this is more accurate than mag since extrapolations of , , and color are required. The agreement in zeropoint and total magnitude of our results with published photometry is good.
Figure 16 shows that the nucleus is tiny and dense compared to the main part of the pseudobulge. Its deprojected outer profile is much steeper than , so we treat it as an independent self-gravitating cluster. To estimate its mass and a limit on , we need its effective radius, harmonic mean radius, and total magnitude with the small contribution from the rest of the galaxy removed.
A profile decomposition of NGC 6503 is shown in Figure 16. The inner, shallow part of the Freeman Type II disk profile is accurately exponential. The pseudobulge is too complicated to be fitted by a single function, Sérsic or otherwise. We fit it with the sum of two Sérsic functions, an inner one for the nuclear bar and an outer one for the rest. However, we interpret both as being parts of the same pseudobulge in the same way that, in any barred galaxy, the bar and the rest of the disk are parts of the same disk. The secular evolution that makes pseudobulges is complicated and often involves starburst rings (Kormendy & Kennicutt 2004); it is convenient that the results are often nearly-Sérsic profiles with , but this is not guaranteed. Here, we need to fit the inner shelf in the pseudobulge profile well enough for a robust extrapolation into the nucleus. The decomposition in Fig. 16 serves this purpose.
Then the nucleus is exponential and . Its profile falls off steeply, so we expect that the deconvolution “rings” and makes the profile slightly too steep. So we carried out the same analysis on the undeconvolved profile. This is PSF-blurred, so overestimates the effective radius. We therefore average these two values and adopt pc. If km s-1, then . The total mass of the nucleus, , is included in Table 1.
The total magnitude of the nucleus given by the raw and deconvolved profiles is and , respectively. We adopt ; , and . So .
This value is too large to be easy to understand. Of course, star formation histories and internal absorptions that make can be devised. But the color of the nucleus is normal for an Scd galaxy: the central five measurements in HyperLeda range from 0.69 to 0.88 and average . The aperture diameters are 14 to 69; that is, these are measurements of the nucleus and pseudobulge. Correcting for Galactic reddening, . Bell & de Jong (2001, Table 1) list the relationship between color and stellar population for a formation model that, while not unique, is suitable for NGC 6503. For the above color, it predicts that .
Absent exotic star formation histories, two possibilities look plausible. The stellar population may be as above and we may have weakly detected a BH of mass . But a more conservative interpretation is more likely. Integrating the light profiles of the components shown in Figure 16 shows that 10 % of the light in our spectroscopic aperture comes from the nucleus. Our measurement of km s-1 is a measurement of the pseudobulge. The same is true of Ho et al. (2009) quoting Barth et al. (2002). Many galactic nuclei have velocity dispersions of 20 – 25 km s-1; M 33 and NGC 5457 are two of them. NGC 6503 may be another. That is, the velocity dispersion may decrease from the pseudobulge into the nucleus and its stellar population may be entirely normal.
The irony is that Bottema (1989) found km s-1, even though we cannot understand how he did it, because he got similar dispersions even at larger radii where we get 40 km s-1. Bottema’s gives . Moreover, our km s-1 gives a pseudobulge mass-to-light ratio of . The first value is as expected and the second is more plausible than . We clearly need a high-spatial-resolution measurement of in the nucleus of NGC 6503.
The same uncertainty applies to constraints on . For the undeconvolved and deconvolved nuclear profiles, we measure and 0053, respectively. We adopt the mean, pc. It fortuitously equals . Then .
This limit is not restrictive in the context of an extrapolation of the – correlation (Ferrarese & Merritt 2000; Gebhardt et al. 2000; Tremaine et al. 2002). For km s-1 and 25 km s-1, it predicts and , respectively. All allowed are adequate to explain any low-level AGN activity in NGC 6503. It was classified as a Seyfert-LINER transition object (“T2/S2”) by Ho et al. (1997), and it contains a weak nuclear X-ray source (Panessa et al. 2006, 2007; Desroches & Ho 2009). The latter papers suggest that the nucleus may be powered by young stars rather than an AGN.
4. How Can Hierarchical Clustering Make So Many Bulgeless, Pure-Disk Galaxies?
Hierarchical clustering in a cold dark matter universe (White & Rees 1978) is a remarkably successful theory of galaxy formation. The remaining struggle is with baryonic physics. The most serious problem has been emphasized many times by observers (e. g., Freeman 2000; Kormendy & Kennicutt 2004; Kormendy & Fisher 2005, 2008; Kautsch et al. 2006; Carollo et al. 2007; Kormendy 2008; Barazza et al. 2008; Weinzirl et al. 2009; Kautsch 2009), by modelers (Steinmetz & Navarro 2002; Abadi et al. 2003; Governato et al. 2004, 2010; Robertson et al. 2004; Mayer et al. 2008, Stewart et al. 2008, 2009; Hopkins et al. 2009a, and Croft et al. 2009 is a very incomplete list), and by reviewers (e. g., Burkert & D’Onghia 2004; Lake 2004; Brooks 2010; Peebles & Nusser 2010). Given so much merger violence, how can hierarchical clustering make so many pure-disk galaxies with no signs of merger-built bulges? That is:
How can dark matter halos grow (e. g.) to km s-1 without letting the mergers that accomplished that growth destroy the fragile thin disks of stars that predate the mergers (Tóth & Ostriker 1992) and without scrambling disks into recognizable classical bulges (Toomre 1977; Schweizer 1989)? Minor mergers are not a problem; they do no damage. But major mergers – with range of mass ratios to be determined – scramble disks into classical bulges. Can we explain pure disks?
The problem gets much harder when we realize that many (we thought) small bulges are unlikely to be merger remnants; rather, they are pseudobulges made mainly by secular evolution of isolated galaxy disks (e. g., Kormendy & Kennicutt 2004; Kormendy & Fisher 2008; Weinzirl et al. 2009). From a galaxy formation point of view, galaxies that contain only pseudobulges are pure-disk systems. The luminosity function of ellipticals is bounded at low luminosities (Sandage et al. 1985a, b; Binggeli et al. 1988); the faintest ones resemble M 32 but are very rare (Kormendy et al. 2009). Recognizing pseudobulges shows us that small classical bulges are rarer than we thought, too. How much rarer is the subject of this section.
The problem of bulgeless disks is least difficult for small galaxies. They accrete gas in cold streams or as gas-rich dwarfs more than they suffer violent mergers (Maller et al. 2006; Dekel & Birnboim 2006; Stewart et al. 2009; Koda et al. 2009; Brooks et al. 2009; Hopkins et al. 2009b, 2010). Energy feedback from supernovae is effective in counteracting gravity (Dekel & Silk 1986; Robertson et al. 2004; D’Onghia et al. 2006; Dutton 2009; Governato et al. 2010). Attempts to explain pure disk galaxies have come closest to success in explaining dwarf systems (Robertson et al. 2004; Governato et al. 2010). So:
The pure-disk galaxies that most constrain our formation picture are the ones that live in the highest-mass dark halos. We know of no Sc or later-type galaxy that has a classical bulge (Kormendy & Kennicutt 2004). In this section, we inventory classical and pseudo bulges in the nearby universe and conclude that the solution to the problem of giant bulgeless galaxies is not to hope that they are rare enough so they can be explained as the tail of a distribution of formation histories that included a few fortuitously mergerless galaxies.
Consider first the Local Group. Only our Galaxy has had an uncertain bulge classification. Its boxy shape (Maihara et al. 1978; Weiland et al. 1994; Dwek et al. 1995) implies that the high-latitude structure is a pseudobulge – the part of the disk that heated itself vertically when it formed the Galactic bar (Combes & Sanders 1981; Combes et al. 1990; Raha et al. 1991; Athanassoula & Misiriotis 2002; Athanassoula 2005). Particularly compelling is the observation of a perspective effect – the near side of the thick bar looks taller than the far side, so the pseudobulge is not just boxy, it is a parallelogram (Blitz & Spergel 1991). Further evidence is provided by the observation that the rotation velocity is almost independent of height above the disk plane, as in other boxy bulges and as in -body models of edge-on bars (Howard et al. 2009; Shen et al. 2010). Further, the low velocity dispersion of the bulge merges seamlessly with that of the disk (Lewis & Freeman 1989). Finally, the complicated central profile derived by Tremaine et al. (2002) also implies a pseudobulge. Only the old, -element-enhanced stellar population is suggestive of a classical bulge. But these stars could have formed before the bar structure (Freeman 2008). Kormendy & Kennicutt (2004) discuss caveats. Like Freeman (2008), we conclude that there is no photometric or dynamical evidence for a classical bulge.
Our Galaxy provides an additional important conclusion. Its disk stars are as old as 9 – 10 Gyr (Oswalt et al. 1995; Winget & Kepler 2008). Unless our Galaxy is unusual, this suggests: The solution to the problem of forming giant, pure-disk galaxies is not to use some physical process like energy feedback to delay star formation until recently and thereby to give the halo time to grow without forming a classical bulge.
Then the Local Group contains one tiny elliptical, M 32, and one big classical bulge, in M 31. In the most massive three galaxies, there is only one classical bulge.
Looking beyond the Local Group, the nearest giant Sc-Scd galaxies include the well known objects M 101, NGC 6946, and IC 342. All have outer rotation velocities km s-1. All have extraordinarily tiny pseudobulges and no sign of classical bulges (§ 3). To further test whether such galaxies could be rare enough to have formed as the quiescent tail of a distribution of merger histories, we inventory similar giant galaxies in the nearby universe. This section expands on Kormendy & Fisher (2008) to provide better statistics.
The problem of pure disk galaxies proves to depend on environment – it is a puzzle in the field but not in rich clusters. Also, we need detailed observations to classify (pseudo)bulges. These considerations motivate us to restrict ourselves to a nearby volume that contains small groups of galaxies like the Local Group but not any denser environments that approach the conditions in the Virgo cluster. M 101 is the most distant bulgeless disk discussed in § 3, at Mpc. We look for all giant galaxies with Mpc. As our cutoff for giant galaxies, we will be conservative and choose km s-1 or central km s-1. We use Tully (1988), HyperLeda, and NED to construct a master list of nearby galaxies and then use individual papers that provide accurate measures of , , and to cull a sample that satisfies the above criteria.
![[Uncaptioned image]](/html/1009.3015/assets/x18.png)
Table 2 lists the resulting 19 galaxies in order from pure disk to pure elliptical. Distances are a complicated problem; we use averages (Column 3) of the most accurate determinations that we could find in the sources in Column (4). Column (5) gives the -band absolute magnitude of the galaxy from the total magnitude in the 2MASS Large Galaxy Atlas (Jarrett et al. 2003). Column (6) is the -band total absolute magnitude. Column (7) gives the outer rotation velocity from sources in Column (8). For the two ellipticals, we use , where is an approximate velocity dispersion. Finally, classical-bulge-to-total and pseudobulge-to-total ratios and , respectively, are listed in Columns (9) and (10). We averaged the values given by the sources listed in Column (11). Bulge classifications are discussed in the Appendix.
M 101, NGC 6946, and IC 342 are well-known examples of giant, pure-disk galaxies, but they are not unique even in our sample. Four of the 19 galaxies have 4 %. No classical bulge can be hidden in these galaxies – not even one as small as M 32. In M 101 and in NGC 6946, we find nuclear star clusters that make up 0.03 % and 0.1 % of the light of the galaxy; these are as faint as or fainter than the smallest ellipticals known. But they are nuclei – they are too small and dense to be bulges. We emphasize: we do not have the freedom to postulate classical bulges which have arbitrary properties (such as low surface brightnesses) that make them easy to hide. Classical bulges and ellipticals satisfy well defined fundamental plane correlations (Kormendy et al. 2009 and Kormendy 2009 show these to the faintest luminosities). Objects that satisfy these correlations cannot be hidden in the above galaxies. So in 4/19 of the giant galaxies in our sample.
Of the rest, 7 more are dominated by pseudobulges and show no signs of classical bulges. The pseudobulge classifications are robust. There is no sign of a multi-component bulge structure. Many of these objects have long been discussed as prototypical examples of pseudobulge formation by secular evolution (e. g., NGC 4736, see the Appendix). So 11 of the 19 giant galaxies in our sample either cannot have a classical bulge or have dominant pseudobulges and show no sign of a classical bulge.
Four galaxies are listed in Table 2 as having tiny classical bulges (). Except in NGC 4258, the identification of these as classical bulges is uncertain. E. g., Erwin et al. (2003) decompose the complicated inner light profile of NGC 2787 into two components that they interpret as coexisting classical and pseudo bulges with . It is not clear that the smaller of these components is a classical bulge. But we do expect that classical and pseudo bulges coexist in some galaxies (Kormendy 1993; Erwin et al. 2003; Kormendy & Kennicutt 2004). In Table 2 and in the Appendix, we err on the side of caution in identifying small classical bulges. However, note that in NGC 2683 – NGC 4258, to 0.12. This is still small compared to the classical bulges that are made in simulations of hierarchical clustering (Abadi et al. 2003).
Finally, substantial merger remnants are not absent from our sample. Maffei 1 and NGC 5128 = Centaurus A are ellipticals. They are sometimes classified as peculiar S0s, but we assign to both. NGC 5128 is the most massive classical bulge in our sample. Two other galaxies have classical bulges with and no sign of pseudobulges, M 31 and M 81.
We conclude that bulgeless galaxies do not form the rare tail of the distribution of galaxy formation histories; they are 58 – 74 % of our sample. Almost all of the classical bulges that we do identify – some with substantial uncertainty – are smaller than those normally made in simulations of galaxy formation. In field environments, the problem of forming giant, pure-disk galaxies in a hierarchically clustering universe is acute.
Finally, we estimate the stellar mass in disks, pseudobulges, and classical bulges ellipticals summed over the 19 galaxies in our sample. The calculation is approximate, e. g., because we do not have dynamical stellar mass measurements and because many of the galaxies have large and somewhat uncertain Galactic obscurations. We estimate a stellar population, -band mass-to-light ratio, , from the dereddened color, following Bell & de Jong (2001). Classical bulges are redder than their associated disks; we use the correspondingly higher ratios. For pseudobulges, we use the disk (“Bulges are more like their disks than they are like each other.” – Wyse et al. 1997; see also Peletier & Balcells 1996; Gadotti & dos Anjos 2001). We assume that the and values in Table 2 apply at band and apply them to to get the luminosity of each component. The result is that the total stellar masses in the galaxies, in their pseudobulges, and in classical bulges ellipticals are ; ; . That is, % of the mass is in bulges and ellipticals, % is in pseudobulges, and so % is in pseudobulges plus disks, i. e., not in major merger remnants. In the above, the high-bulge-mass-fraction error bar is derived by assigning half of all pseudobulge mass to classical bulges; this is certainly too conservative, because it is inconsistent with the properties observed for the biggest pseudobulges. The low-bulge-mass-fraction error bar is similarly derived by assigning 1/2 of the classical bulge mass (not including ellipticals) to the pseudobulges; this also is inconsistent with observations.
Our conclusions are robust to uncertainties in assumptions. For example, if we use the same mass-to-light ratio for all stellar populations, then % of the mass is in bulges and ellipticals, % is in pseudobulges, and % is in pseudobulges plus disks. The stellar mass results are even robust to any uncertainty in the distinction between classical and pseudo bulges, because the ratio of stellar mass in both together is to 0.30 for the above possible choices of mass-to-light ratios. That is, the total mass in bulges is small because most values in the field are small. Note also that our procedure underestimates disk and pseudobulge masses significantly, because we do not inventory cold gas and because we do not correct for internal absorption, which is large in some disks but small in bulges and ellipticals.
We conclude that, in the nearby field, most stellar mass and most baryonic mass is in disks; in fact, in pure disks. The ratio of pseudobulge-to-bulge stellar mass is ; that is, significant but not dominant. However, the importance of pseudobulges is not in their total mass but rather in the fact that they are not merger remnants. From the point of view of galaxy formation by hierarchical clustering, their mass should be included in the disk inventory. So only 1/5 of the stellar mass in giant galaxies in our 8-Mpc-radius, field volume is in probable remnants of major mergers. And this is distributed in no more than 8 but possibly as few as 5 of the 19 giant galaxies in our sample. Pure disk galaxies are the dominant population among our giant galaxies in extreme field environments.333Our results generally agree with published studies, but quantitative comparison is difficult: (1) Pseudobulges have not generally been identified; most of the ones discussed here could not easily be classified far away. So studies of large (e. g., SDSS) samples find that pure disks are common – and, indeed, more common in the field than in clusters (Kautsch et al. 2009) – but they probably underestimate the fraction of bulgeless galaxies. (2) Many studies combine their statistics over a variety of environments; they find that late-type galaxies dominate strongly at low redshifts (e. g., Nair & Abraham 2010). We concentrate on the extreme field in part to emphasize the stark contrast with Virgo. Jogee et al. (2009) provide an up-to-date discussion of how observed merger rates over the past 7 Gyr agree with theory. Engineering consistency between our theoretical picture and our observations of zero- and high-redshift galaxies is a growth industry that is still in its early stages.
In contrast, in the Virgo cluster, about 2/3 of the stellar mass is in elliptical galaxies and some additional mass is in classical bulges (Kormendy et al. 2009). So the above statistics are a strong function of environment.
We therefore restate the theme of this section: What is special about galaxy formation in low-density, Local-Group-like environments that allows the majority of galaxies with halo km s-1 to form with no sign of a major merger?
Appendix
BULGE VERSUS PSEUDOBULGE CLASSIFICATIONS IN TABLE 2
This Appendix discusses the bulge and pseudobulge classifications in Table 2. It is far from an exhaustive review; many of these galaxies have been studied in great detail. We provide enough information for a robust classification.
M 101 and NGC 6946 are discussed in § 3. They satisfy three of the pseudobulge classification criteria in Kormendy & Kennicutt (2004, hereafter KK04): they have overall Sérsic indices , they contain small-scale structure that cannot be formed in a hot stellar system, and star formation is vigorously in progress. In fact, in NGC 6946, the mass of molecular gas in the nuclear star cluster is very similar to its stellar mass, showing that growth of the nucleus and, at larger radii, the growth of the pseudobulge are still very much in progress.
IC 342 is closely similar to the above galaxies. Fisher & Drory (2010) find that . A strong central concentration of molecular gas feeds vigorous star formation (Becklin et al. 1980; Turner & Ho 1983; Böker et al. 1999; Meier et al. 2000; Helfer et al. 2003, and references therein).
NGC 4945’s pseudobulge is best fitted with , based on our decomposition of the 2MASS profile. Here and for all decompositions in this paper, the different flattenings of the bulge and disk are taken into account in measuring . A strong central concentration of molecular gas is associated with vigorous star formation (Dahlem et al. 1993; Henkel & Mauersberger 1993; Wang et al. 2004), particularly in a 100 pc nuclear ring (Marconi et al. 2000) like the starburst rings seen in many other barred and oval galaxies that are actively growing pseudobulges (see KK04 for a review). The starburst is powerful enough to drive a polar wind of x-ray-emitting gas (Strickland et al. 2004).
NGC 5236 has a powerful nuclear starburst (Turner & Ho 1994; Harris et al. 2001; Bresolin & Kennicutt 2002; Díaz et al. 2006) with multiple density concentrations that are comparable in mass to giant molecular clouds (Thatte et al. 2000; Bresolin & Kennicutt 2002; Rodrigues et al. 2009). Fisher & Drory (2010) find that . The whole center of the galaxy is being re-engineered on a timescale of yr (Rodrigues et al. 2009).
NGC 5194 = M 51 shows strong central star formation (e. g., Turner & Ho 1994; Calzetti et al. 2005) associated with a central peak in molecular gas emission (Helfer et al. 2003). It also has (Fisher & Drory 2008, 2010) and a nuclear bar (Menéndez-Delmestre et al. 2007).
NGC 253 has an extraordinarily powerful nuclear starburst (e. g., Rieke et al. 1980; Engelbracht et al. 1998; Ott et al. 2005b; Martín et al. 2006) that drives a polar wind of x-ray-emitting gas (e. g., Strickland et al. 2004). As in other, similar starbursts, it is associated with a dense and massive central concentration of molecular gas (e. g., Peng et al. 1996).
Maffei 2 has a pseudobulge, based on the observation that molecular gas (e. g., Kuno et al. 2007, 2008) feeds a nuclear starburst (e. g., Turner & Ho 1994; Tsai et al. 2006; Meier et al. 2008). We constructed a composite profile by measuring an HST NICMOS NIC3 F190N image and grafting its profile onto the center of the 2MASS profile. The central arcsec is heavily obscured even in the infrared. Extinction and star formation both render the Sérsic index uncertain; depending on assumptions about whether to include the obscured part of the profile in the decomposition fit or not, Sérsic indices from to fit the data reasonably well. The derived is more robust; the quoted error estimate takes the above uncertainties into account. Our value is measured in band. For comparison, Buta & McCall (1999) got 0.22 in band using an law for the pseudobulge.
Our Galaxy is discussed in § 4.
Circinus is discussed in detail in Kormendy (2010). The galaxy has a pseudobulge based on three classification criteria. The weakest one is Sérsic index. Kormendy (2010) constructs a -band composite profile from the 2MASS data at large radii and from HST NICMOS data near the center. The best-fit Sérsic-exponential decomposition has , which is formally but not significantly less than 2. A stronger argument is provided by the observation of a nuclear disk – a shelf in the brightness distribution that has almost the same flattening as the outer disk. Most compelling is the observation of a strong central concentration of molecular gas and star formation (Marconi et al. 1994; Oliva et al. 1995; Maiolino et al. 1998; Elmouttie et al. 1998; Jones et al. 1999; Wilson et al. 2000; Curran et al. 1998, 2008; Greenhill et al. 2003; Mueller Sánchez et al. 2006).
NGC 4736 is the “poster child” for pseudobulges. It satisfies five classification criteria in KK04. It has a nuclear bar (e. g., Kormendy 1993; Möllenhoff et al. 1995) which implies that a pseudobulge dominates the light even at small radii. Spiral structure reaches in to the nuclear bar essentially undiluted by a classical bulge (Chincarini & Walker 1967; Kormendy 1993; Fisher et al. 2009). Especially important is the observation that the pseudobulge has a large ratio of rotation velocity to velocity dispersion (Kormendy 1993; KK04). The pseudobulge has a complicated light profile (cf. the pseudobulge in NGC 6946: Fig. 9 – 11), but the main part has a Sérsic function profile with (Fisher & Drory 2008; 2010). Finally, star formation in central molecular gas (Regan et al. 2001; Helfer et al. 2003) is modest now (Turner & Ho 1994) but was more vigorous in the past (Pritchet 1977; Walker et al. 1988); in addition, vigorous star formation is under way now in a molecular gas ring farther out in the pseudobulge (Wong & Blitz 2000; Bendo et al. 2007). This is consistent with the general picture in which star formation – often in rings – builds pseudobulges from the inside outward as the gradual increase in central mass concentration shifts to larger radii the annulus at which infalling gas stalls and makes stars (KK04).
NGC 2683 is a difficult case, because the center of this almost-edge-on galaxy is obscured by dust in the optical. However, the 2MASS -band outer profile and an HST NICMOS NIC3 image taken with the F160W filter and calibrated to yield a composite profile that clearly shows a tiny central bulge. Is it classical or pseudo? We cannot be sure, because a bulge that is comparable in size to the thickness of the disk is not always classifiable using the KK04 criteria. The range of plausible decompositions gives . Its structural parameters satisfy the fundamental plane correlations for small ellipticals and classical bulges (Kormendy et al. 2009; Kormendy 2009). Both results favor but do not guarantee a classical bulge. It could be a pseudobulge, as is the case for the bright, tiny center of the similar, edge-on, “boxy bulge” galaxy NGC 4565 (Kormendy & Barentine 2010). But we err on the side of caution and call the bulge in NGC 2683 classical. It is important to note that this tiny bulge with is not the boxy bulge seen at larger radii and confidently identified as an edge-on bar via the observation of “figure 8” structure in the emission lines of ionized gas (Rubin 1993; Merrifield & Kuijken 1999; Funes et al. 2002; Kuzio de Naray et al. 2009).
NGC 4826 is tricky, because the KK04 bulge classification criteria send a mixed message. Among three pseudobulge characteristics, the most important is that the (pseudo)bulge has a relatively high ratio of rotation velocity to velocity dispersion. This puts it near other dynamically classified pseudobulges and above the “oblate line” that describes rotating, isotropic oblate spheroids in the – diagram (Kormendy 1993). This is a disky property (see KK04 for a review). For its luminosity, NGC 4826 also has a low, pseudobulge-like velocity dispersion (Kormendy 1993). A somewhat weaker argument is that it shows small-scale, mostly spiral structure all the way to the center (Lauer et al. 1995; http://heritage.stsci.edu/2004/04/big.html). The problem with interpreting this is that it could be caused by the prominent dust disk. The dust is associated with strong and centrally concentrated molecular gas emission (Regan et al. 2001; Helfer et al. 2003; García-Burillo et al. 2003), but the star formation rate is not particularly high (Turner & Ho 1994). All this is suggestive of a pseudobulge. On the other hand, the Sérsic index of the bulge is variously derived to be (Möllenhoff & Heidt 2001) to (Fisher & Drory 2008; Méndez-Abreu et al. 2008), and the apparent axial ratio of the bulge is considerably rounder than that of the disk (see all three of the above papers). These properties favor a classical bulge interpretation, although they are not conclusive. A complication is the observation of counterrotating gas at large radii (Braun et al. 1992, 1994; Rubin 1994a, b), although its mass is small and Rix et al. (1995) conclude that “NGC 4826 has not undergone a merger with another galaxy of significant size since the formation of its stellar disk.” Plausibly, they argue that “any [prograde-orbiting] gas …that is likely to have existed originally in NGC 4826 …would have suffered inelastic collisions with the [accreted] retrograde disk and would have gradually lost angular momentum and spiraled into the center of the galaxy. This mechanism offers an elegant explanation for the abnormally high gas surface density in the center of NGC 4826 (Braun et al. 1994)” and perhaps also for the dust disk. We conclude with some confidence that the recent minor accretion event – while intrinsically interesting – does not affect our classification of the (pseudo)bulge. The weight of the evidence favors a pseudobulge. However, in this paper more than most, it is exceedingly important that we not overestimate the importance of pseudobulges. Moreover, it is clear that classical and pseudo bulges must co-exist in some galaxies (Kormendy 1993; Erwin et al. 2003; KK04), the best candidates are galaxies in which classification criteria send a mixed message. We are therefore conservative and assign half of to a classical bulge and half to a pseudobulge.
NGC 2787 satisfies at least three pseudobulge classification criteria: high ratio of rotation to random velocities, a nuclear disk structure, and to 2 (Erwin et al. 2003; Kormendy & Fisher 2008; Fisher & Drory 2008). Erwin et al. (2003) decompose the profile into what they interpret as classical bulge and pseudobulge parts. The complicated central profile is not in doubt, but all of the bulge may be pseudo. To be conservative, we follow Erwin’s decomposition in Table 2.
NGC 4258 contains a classical bulge with and value consistent with the “oblate line” in the – diagram (Fisher & Drory 2008, 2010; Siopis et al. 2009). Molecular gas is observed (Helfer et al. 2003), but the emission drops in the center as it does in other classical bulges (Regan et al. 2001).
M 31 contains a classical bulge with (Kormendy & Bender 1999) and rotation that is slightly below the oblate line in the – diagram (Kormendy & Illingworth 1982).
M 81 contains a classical bulge with (Fisher & Drory 2008, 2010) and rotation that is consistent with the oblate line in the – diagram (Kormendy & Illingworth 1982). Like other classical bulges, M 81 has a central minimum in molecular gas emission (Helfer et al. 2003) and a low central star formation rate (Turner & Ho 1994).
Maffei 1 and NGC 5128: We adopt elliptical galaxy classifications for these two galaxies (for Maffei 1, see Buta & McCall 1999, 2003). We neglect the light of the small, late-type galaxy that is in the process of being inhaled by NGC 5128. The absolute magnitudes of both galaxies are somewhat uncertain: the intrinsic colors implied by and listed in Table 2 are for Maffei 1 and 2.56 for NGC 5128; these values are bluer than normal colors for old stellar populations. We use only the -band magnitudes consistently adopted from the 2MASS Large Galaxy Atlas.
Two galaxies that were included in Kormendy & Fisher (2008) are omitted here because km s-1:
NGC 3077 is usually classified as a Type II irregular (Sandage 1961) or equivalently as an I0 galaxy (de Vaucouleurs et al. 1991) because of patchy dust near its center. However, it is participating in a spectacular, three-way gravitational interaction with M 82 and M 81 (Yun et al. 1994), and its H I connection with the latter galaxy makes it likely that it has accreted cold gas during the interaction. The central dust and prominent star formation (e. g., Ott et al. 2003, 2005a; Harris et al. 2004) therefore are likely to be recent additions to what previously was probably a more normal, early-type galaxy. If it was an elliptical, then it is particularly important that we not bias our results by excluding it unfairly. Kormendy & Fisher (2008) included the galaxy to be safe but were not certain that it was big enough to make their sample cut. We have now checked this by obtaining spectra with the 9.2 m Hobby-Eberly Telescope and LRS Spectrogpaph (Hill et al. 1998). The slit width was 10 and the instrumental velocity dispersion was km s-1 near the Mg b lines ( Å). The K0 III standard star was HD172401. Our signal-to-noise ratios were very high, and the absorption lines in NGC 3077 are very obvious. However, we completely failed to resolve their line widths. We conclude that km s-1 in NGC 3077. This is consistent with the estimate that the central escape velocity from the galaxy is km s-1 (Ott et al. 2003). Therefore NGC 3077 is too small to be included in our sample.
NGC 5195, the companion of M 51, was also included in Kormendy & Fisher (2008). However, Kohno et al. (2002) find from CO observations that the maximum rotation velocity is “ km s-1 at pc in the plane of the galaxy” but that there is a “steep rise of rotation velocity toward the center” to the above value from smaller rotation velocities at larger radii (their Figure 6). We therefore omit the galaxy. However, we note that the central concentration of molecular gas and star formation – possibly fed by the interaction with M 51 – is most consistent with a pseudobulge and (ii) that the pseudobulge-to-total luminosity ratio is small (Smith et al. 1990 estimate that in band). If we are incorrect in omitting NGC 5195, then we underestimate the importance of pseudobulges in our mass inventory and therefore overestimate the importance of classical bulges. However, any error introduced is small, because the pseudobulge of NGC 5195 is small.
References
- (1)
- (2)
- (3) Abadi, M. G., Navarro, J. F., Steinmetz, M., & Eke, V. R. 2003, ApJ, 591, 499
- (4) Athanassoula, E. 1992, MNRAS, 259, 345
- (5) Athanassoula, E. 2005, MNRAS, 358, 1477
- (6) Athanassoula, E., & Misiriotis, A. 2002, MNRAS, 330, 35
- (7) Baggett, W. E., Baggett, S. M., & Anderson, K. S. J. 1998, AJ, 116, 1626
- (8) Balcells, M., Graham, A. W., Domínguez-Palmero, L., & Peletier, R. F. 2003, ApJ, 582, L79
- (9) Barazza, F. D., Jogee, S., & Marinova, I. 2008, ApJ, 675, 1194
- (10) Barth, A. J., Ho, L. C., & Sargent, W. L. W. 2002, AJ, 124, 2607
- (11) Barth, A. J., Strigari, L. E., Bentz, M. C., Greene, J. E., & Ho, L. C. 2009, ApJ, 690, 1031
- (12) Becklin, E. E., Gatley, I., Matthews, K., Neugebauer, G., Sellgren, K., Werner, M. W., & Wynn-Williams, C. G. 1980, ApJ, 236, 441
- (13) Begeman, K. 1987, PhD Thesis, Rijksuniversiteit te Groningen
- (14) Begeman, K., Broeils, A. H., & Sanders, R. H. 1991, MNRAS, 249, 523
- (15) Bell, E. F., & de Jong, R. S. 2001, ApJ, 550, 212
- (16) Bender, R. 1990, A&A, 229, 441
- (17) Bender, R., Kormendy, J., & Dehnen, W. 1996, ApJ, 464, L123
- (18) Bendo, G. J., et al. 2007, MNRAS, 380, 1313
- (19) Bessell, M. S. 2005, ARA&A, 43, 293
- (20) Binggeli, B., Sandage, A., & Tammann, G. A. 1988, ARA&A, 26, 509
- (21) Blitz, L. & Spergel, D. N. 1991, ApJ, 379, 631
- (22) Böker, T., van der Marel, R. P., & Vacca, W. D. 1999, AJ, 118, 831
- (23) Bosma, A. 1981, AJ, 86, 1825
- (24) Bosma, A., Goss, W. M., & Allen, R. J. 1981, A&A, 93, 106
- (25) Bosma, A., van der Hulst, J. M., & Sullivan, W. T. 1977, A&A, 57, 373
- (26) Bottema, R. 1989, A&A, 221, 236
- (27) Bottema, R. 1997, A&A, 328, 517
- (28) Bottema, R., & Gerritsen, J. P. E. 1997, MNRAS, 290, 585
- (29) Braun, R., Walterbos, R. A. M., & Kennicutt, R. C. 1992, Nature, 360, 442
- (30) Braun, R., Walterbos, R. A. M., Kennicutt, R. C., & Tacconi, L. J. 1994, ApJ, 420, 558
- (31) Bresolin, F., & Kennicutt, R. C. 2002, ApJ, 572, 838
- (32) Brooks, A. 2010, in Proceedings of the Frank N. Bash Symposium 2009: New Horizons in Astronomy (San Francisco: ASP), in press
- (33) Brooks, A. M., Governato, F., Quinn, T., Brook, C. B., & Wadsley, J. 2009, ApJ, 694, 396
- (34) Burkert, A. M., & D’Onghia, E. 2004, in Penetrating Bars Through Masks of Cosmic Dust: The Hubble Tuning Fork Strikes a New Note, ed. D. L. Block, I. Puerari, K. C. Freeman, R. Groess, and E. K. Block (Dordrecht: Kluwer), 341
- (35) Buta, R., & McCall, M. L. 2003, AJ, 125, 1150
- (36) Buta, R. J., & McCall, M. L. 1999, ApJS, 124, 33
- (37) Calzetti, D., et al. 2005, ApJ, 633, 871
- (38) Cappellari, M., et al. 2006, MNRAS, 366, 1126
- (39) Caputo, F., Marconi, M., & Musella, I. 2002, ApJ, 566, 833
- (40) Carollo, C. M. 1999, ApJ, 523, 566
- (41) Carollo, C. M., Scarlata, C., Stiavelli, M., Wyse, R. F. G., & Mayer, L. 2007, ApJ, 658, 960
- (42) Carollo, C. M., Stiavelli, M., de Zeeuw, P. T., & Mack, J. 1997, AJ, 114, 2366
- (43) Carollo, C. M., Stiavelli, M., de Zeeuw, P. T., Seigar, M., & Dejonghe, H. 2001, ApJ, 546, 216
- (44) Carollo, C. M., Stiavelli, M., & Mack, J. 1998, AJ, 116, 68
- (45) Carpenter, J. M. 2001, AJ, 121, 2851
- (46) Casertano, S., & van Gorkom, J. H. 1991, AJ, 101, 1231
- (47) Casoli, F., Clausset, F., Viallefond, F., Combes, F., & Boulanger, F. 1990, A&A, 233, 357
- (48) Cid Fernandes, R., González-Delgado, R. M., Storchi-Bergmann, T., Pires Martins, L., & Schmitt, H. 2005, MNRAS, 356, 270
- (49) Charlot, S., & Bruzual A., G. 2010, in preparation
- (50) Chincarini, G., & Walker, M. F. 1967, ApJ, 147, 407
- (51) Chung, A., & Bureau, M. 2004, AJ, 127, 3192
- (52) Combes, F., Debbasch, F., Friedli, D. & Pfenniger, D. 1990, A&A, 233, 82
- (53) Combes, F. & Sanders, R. H. 1981, A&A, 96, 164
- (54) Corbelli, E. 2003, MNRAS, 342, 199
- (55) Corbelli, E., & Salucci, P. 2000, MNRAS, 311, 441
- (56) Corbelli, E., & Schneider, S. E. 1997, ApJ, 479, 244
- (57) Courteau, S., de Jong, R. S., & Broeils, A. H. 1996, ApJ, 457, L73
- (58) Cox, A. N., Ed. 2000, Allen’s Astrophysical Quantities, Fourth Edition (New York: AIP Press; Springer)
- (59) Croft, R. A. C., Di Matteo, T., Springel, V., & Hernquist, L. 2009, MNRAS, 400, 43
- (60) Curran, S. J., Johansson, L. E. B., Rydbeck, G., & Booth, R. S. 1998, A&A, 338, 863
- (61) Curran, S. J., Koribalski, B. S., & Bains, I. 2008, MNRAS, 389, 63
- (62) Dahlem, M., Golla, G., Whiteoak, J. B., Wielebinski, R., Hüttemeister, S., & Henkel, C. 1993, A&A, 270, 29
- (63) Dekel, A., & Birnboim, Y. 2006, MNRAS, 368, 2
- (64) Dekel, A., & Silk, J. 1986, ApJ, 303, 39
- (65) de Vaucouleurs, G., de Vaucouleurs, A., Corwin, H. G., Buta, R. J., Paturel, G., & Fouqué, P. 1991, Third Reference Catalogue of Bright Galaxies (New York: Springer) (RC3)
- (66) Desroches, L.-B., & Ho, L. C. 2009, ApJ, 690, 267
- (67) Díaz, R. J., Dottori, H., Aguero, M. P., Mediavilla, E., Rodrigues, I., & Mast, D. 2006, ApJ, 652, 1122
- (68) D’Onghia, E., Burkert, A., Murante, G., & Khochfar, S. 2006, MNRAS, 372, 1525
- (69) Dolphin, A. E. 2009, PASP, 121, 655
- (70) Dressler, A. 1984, ApJ, 286, 97
- (71) Dressler, A., & Richstone, D. O. 1988, ApJ, 324, 701
- (72) Drory, N., Bender, R., Feulner, G., Hopp, U., Maraston, C., Snigula, J., & Hill, G. J. 2004a, ApJ, 608, 742
- (73) Drory, N., Bender, R., & Hopp, U. 2004b, ApJ, 616, L103
- (74) Dutton, A. A. 2009, MNRAS, 396, 121
- (75) Dwek, E., et al. 1995, ApJ, 445, 716
- (76) Elmegreen, D. M., Chromey, F. R., & Santos, M. 1998, AJ, 116, 1221
- (77) Elmouttie, M., Krause, M., Haynes, R. F., & Jones, K. L. 1998, MNRAS, 300, 1119
- (78) Eisenhauer, F., Schödel, R., Genzel, R., Ott, T., Tecza, M., Abuter, R., Eckart, A., & Alexander, T. 2003, ApJ, 597, L121
- (79) Emsellem, E., Greusard, D., Combes, F., Friedli, D., Leon, S., Pécontal, E., & Wozniak, H. 2001, A&A, 368, 52
- (80) Engelbracht, C. W., Rieke, M. J., Rieke, G. H., Kelly, D. M., & Achtermann, J. M. 1998, ApJ, 505, 639
- (81) Engelbracht, C. W., Rieke, M. J., Rieke, G. H., & Latter, W. B. 1996, ApJ, 467, 227
- (82) Erwin, P., Vega Beltrán, J. C., Graham, A. W., & Beckman, J. E. 2003, ApJ, 597, 929
- (83) Falcón-Barroso, J., et al. 2006, MNRAS, 369, 529
- (84) Fathi, K., & Peletier, R. F. 2003, A&A, 407, 61
- (85) Ferrarese, L. 2002, ApJ, 578, 90
- (86) Ferrarese, L., & Merritt, D. 2000, ApJ, 539, L9
- (87) Ferrarese, L., Mould, J. R., Stetson, P. B., Tonry, J. L., Blakeslee, J. P., & Ajhar, E. A. 2007, ApJ, 654, 186
- (88) Ferrarese, L., et al. 2000, ApJS, 128, 431
- (89) Fingerhut, R. L., Lee, H., McCall, M. L., & Richer, M. G. 2007, ApJ, 655, 814
- (90) Fingerhut, R. L., McCall, M. L., de Robertis, M., Kingsburgh, R. L., Komljenovic, M., Lee, H., & Buta, R. J. 2003, ApJ, 587, 672
- (91) Fisher, D. B., & Drory, N. 2008, AJ, 136, 773
- (92) Fisher, D. B., & Drory, N. 2010, ApJ, 716, 942
- (93) Fisher, D. B., Drory, N., & Fabricius, M. H. 2009, ApJ, 697, 630
- (94) Freedman, W. L., et al. 2001, ApJ, 553, 47
- (95) Freeman, K. C. 1970, ApJ, 160, 811
- (96) Freeman, K. C. 2000, in Toward a New Millennium in Galaxy Morphology, ed. D. L. Block, I. Puerari, A. Stockton, & D. Ferreira (Dordrecht: Kluwer), 119
- (97) Freeman, K. C. 2008, in Formation and Evolution of Galaxy Disks, ed. J. G. Funes, & E. M. Corsini (San Francisco: ASP), 3
- (98) Funes, J. G., Corsini, E. M., Cappellari, M., Pizella, A., Vega Beltrán, J. C., Scarlata, C., & Bertola, F. 2002, A&A, 388, 50
- (99) Gadotti, D. A. 2009, MNRAS, 393, 1531
- (100) Gadotti, D. A., & dos Anjos, S. 2001, AJ, 122, 1298
- (101) Ganda, K., Falcón-Barroso, J., Peletier, R. F., Cappellari, M., Emsellem, E., McDermid,R. M., de Zeeuw, P. T., & Carollo, C. M. 2006, MNRAS, 367, 46
- (102) Ganda, K., Peletier, R. F., Balcells, M., & Falcón-Barroso, J. 2009, MNRAS, 395, 1669
- (103) García-Burillo, S., et al. 2003, A&A, 407, 485
- (104) Gebhardt, K., et al. 2000, ApJ, 539, L13
- (105) Gebhardt, K., et al. 2001, AJ, 122, 2469
- (106) González Delgado, R. M., Pérez, E., Cid Fernandes, R., & Schmitt, H. 2008, AJ, 135, 747
- (107) Gordon, K. D., Hanson, M. M., Clayton, G. C., Rieke, G. H., & Misselt, K. A. 1999, ApJ, 519, 165
- (108) Governato, F., et al. 2004, ApJ, 607, 688
- (109) Governato, F., et al. 2010, Nature, 463, 203
- (110) Greenhill, L. J., et al. 2003, ApJ, 590, 162
- (111) Gültekin, K., et al. 2009, ApJ, 698, 198
- (112) Gunn, J. E., Knapp, G. R., & Tremaine, S. D. 1979, AJ, 84, 1181
- (113) Harris, J., Calzetti, D., Gallagher, J. S., Conselice, C. J., & Smith, D. A. 2001, AJ, 122, 3046
- (114) Harris, J., Calzetti, D., Gallagher, J. S., Smith, D. A., & Conselice, C. J. 2004, ApJ, 603, 503
- (115) Helfer, T. T., Thornley, M. D., Regan, M. W., Wong, T., Sheth, K., Vogel, S. N., Blitz, L., & Bock, D. C.-J. 2003, ApJS, 145, 259
- (116) Henkel, C., & Mauersberger, R. 1993, A&A, 274, 730
- (117) Héraudeau, Ph., & Simien, F. 1996, A&AS, 118, 111
- (118) Héraudeau, Ph., Simien, F., Maubon, G., & Prugniel, Ph. 1999, A&AS, 136, 509
- (119) Hill, G. J., Nicklas, H. E., MacQueen, P. J., Tejada, C., Cobos Duenas, F. J., & Mitsch, W. 1998, Proc. SPIE, 3355, 375
- (120) Ho, L. C., Filippenko, A. V., & Sargent, W. L. W. 1995, ApJS, 98, 477
- (121) Ho, L. C., Filippenko, A. V., & Sargent, W. L. W. 1997, ApJS, 112, 315
- (122) Ho, L. C., Greene, J. E., Filippenko, A. V., & Sargent, W. L. W. 2009, ApJS, 183, 1
- (123) Hopkins, P. F., Bundy, K., Croton, D., Hernquist, L., Kereš, D., Khochfar, S., Stewart, K., Wetzel, A., & Younger, J. D. 2010, ApJ, 715, 202
- (124) Hopkins, P. F., Cox, T. J., Younger, J. D., & Hernquist, L. 2009a, ApJ, 691, 1168
- (125) Hopkins, P. F., Somerville, R. S., Cox, T. J., Hernquist, L., Jogee, S., Kereš, D., Ma, C.-P., Robertson, B., & Stewart, K. 2009b, MNRAS, 397, 802
- (126) Howard, C. D., et al. 2009, ApJ, 702, L153
- (127) Ishizuki, S., Kawabe, R., Ishiguro, M., Okumura, S. K., Morita, K.-I., Chikada, Y., Kasuga, T., & Doi, M. 1990, ApJ, 355, 436
- (128) Jarrett T. H., Chester, T., Cutri, R., Schneider, S. E., & Huchra, J. P. 2003, AJ, 125, 525
- (129) Jensen, J. B., Tonry, J. L., Barris, B. J., Thompson, R. I., Liu, M. C., Rieke, M. J., Ajhar, E. A., &Blakeslee, J. P. 2003, ApJ, 583, 712
- (130) Jogee, S., et al. 2009, ApJ, 697, 1971
- (131) Jones, K. L., Koribalski, B. S., Elmouttie, M., & Haynes, R. F. 1999, MNRAS, 302, 649
- (132) Karachentsev, I. D., Karachentseva, V. E., Huchtmeier, W. K., & Makarov, D. I. 2004, AJ, 127, 2031
- (133) Karachentsev, I. D., & Sharina, M. E. 1997, A&A, 324, 457
- (134) Karachentsev, I. D., Sharina, M. E., Dolphin, A. E., & Grebel, E. K. 2003a, A&A, 408, 111
- (135) Karachentsev, I. D., Sharina, M. E., & Huchtmeier, W. K. 2000, A&A, 362, 544
- (136) Karachentsev, I. D., et al. 2002, A&A, 385, 21
- (137) Karachentsev, I. D., et al. 2003b, A&A, 398, 467
- (138) Karachentsev, I. D., et al. 2003c, A&A, 398, 479
- (139) Karachentsev, I. D., et al. 2003d, A&A, 404, 93
- (140) Kautsch, S. J. 2009, PASP, 121, 1297
- (141) Kautsch, S. J., Gallagher, J. S., & Grebel, E. K. 2009, AN, 330, 1056
- (142) Kautsch, S. J., Grebel, E. K., Barazza, F. D., & Gallagher, J. S. 2006, A&A, 445, 765
- (143) Kenney, J. D. P., Scoville, N. Z., & Wilson, C. D. 1991, ApJ, 366, 432
- (144) Kent, S. M., Dame, T. M., & Fazio, G. 1991, ApJ, 378, 131
- (145) King, I. R. 1966, AJ, 71, 64
- (146) Koda, J., Milosavljević, M., & Shapiro, P. R. 2009, ApJ, 696, 254
- (147) Kohno, K., Tosaki, T., Matsushita, S., Vila-Vilaró, B., Shibatsuka, T., & Kawabe, R. 2002, PASJ, 54, 541
- (148) Kormendy, J. 1982, in Twelfth Advanced Course of the Swiss Society of Astronomy and Astrophysics, Morphology and Dynamics of Galaxies, ed. L. Martinet & M. Mayor (Sauverny: Geneva Observatory), 113
- (149) Kormendy, J. 1993, in IAU Symposium 153, Galactic Bulges, ed. H. Dejonghe & H. J. Habing (Dordrecht: Kluwer), 209
- (150) Kormendy, J. 2008, in IAU Symposium 245, Formation and Evolution of Galaxy Bulges, ed. M. Bureau, E. Athanassoula, & B. Barbuy (Cambridge: Cambridge Univ. Press), 107
- (151) Kormendy, J. 2009, in Galaxy Evolution: Emerging Insights and Future Challenges, ed. S. Jogee, I. Marinova, L. Hao, & G. A. Blanc (San Francisco: ASP), 87 (arXiv:0812.0806)
- (152) Kormendy, J. 2010, ApJS, in preparation
- (153) Kormendy, J., & Barentine, J. C. 2010, ApJ, 715, L176
- (154) Kormendy, J., & Bender, R. 1999, ApJ, 522, 772
- (155) Kormendy, J., & Bender, R. 2009, ApJ, 691, L142
- (156) Kormendy, J., Bender, R., & Cornell, M. E. 2010, in preparation
- (157) Kormendy, J., & Cornell, M. E. 2004, in Penetrating Bars Through Masks of Cosmic Dust: The Hubble Tuning Fork Strikes a New Note, ed. D. L. Block, I. Puerari, K. C. Freeman, R. Groess, & E. K. Block (Dordrecht: Kluwer), 261
- (158) Kormendy, J., Cornell, M. E., Block, D. L., Knapen, J. H., & Allard, E. L. 2006, ApJ, 642, 765
- (159) Kormendy, J., & Fisher, D. B. 2005, RevMexA&A (Serie de Conferencias), 23, 101
- (160) Kormendy, J., & Fisher, D. B. 2008, in Formation and Evolution of Galaxy Disks, ed. J. G. Funes & E. M. Corsini (San Francisco: ASP), 297
- (161) Kormendy, J., Fisher, D. B., Cornell, M. E., & Bender, R. 2009, ApJS, 182, 216
- (162) Kormendy, J., & Gebhardt, K. 2001, in 20th Texas Symposium on Relativistic Astrophysics, ed. J. C. Wheeler & H. Martel (New York: AIP), 363
- (163) Kormendy, J., & Illingworth, G. 1982, ApJ, 256, 460
- (164) Kormendy, J., & Kennicutt, R. C. 2004, ARA&A, 42, 603 (KK04)
- (165) Kormendy, J., & McClure, R. D. 1993, AJ, 105, 1793
- (166) Kormendy, J., & Norman, C. A. 1979, ApJ, 233, 539
- (167) Krabbe, A., Böker, T., & Maiolino, R. 2001, ApJ, 557, 626
- (168) Kuno. N., Nakanishi, K., Sorai, K., & Shibatsuka, T. 2008, PASJ, 60, 475
- (169) Kuno, N. et al. 2007, PASJ, 59, 117
- (170) Kuzio de Naray, R., Zagursky, M. J., & McGaugh, S. S. 2009, AJ, 138, 1082
- (171) Lake, G. 2004, in Penetrating Bars Through Masks of Cosmic Dust: The Hubble Tuning Fork Strikes a New Note, ed. D. L. Block, I. Puerari, K. C. Freeman, R. Groess, and E. K. Block (Dordrecht: Kluwer), 359
- (172) Laor, A. 2001, ApJ, 553, 677
- (173) Lauer, T. R. 1985, ApJS, 57, 473
- (174) Lauer, T. R., Faber, S. M., Ajhar, E. A., Grillmair, C. J., & Scowen, P. A. 1998, AJ, 116, 2263
- (175) Lauer, T. R., et al. 1992, AJ, 104, 552
- (176) Lauer, T. R., et al. 1995, AJ, 110, 2622
- (177) Lauer, T. R., et al. 2005, AJ, 129, 2138
- (178) Laurikainen, E., Salo, H., Buta, R., & Vasylyev, S. 2004, MNRAS, 355, 1251
- (179) Lewis, J. R., & Freeman, K. C. 1989, AJ, 97, 139
- (180) Long, K. S., Charles, P. A., & Dubus, G. 2002, ApJ, 569, 204
- (181) Lucy, L. B. 1974, AJ, 79, 745
- (182) MacArthur L. A., Courteau, S., & Holtzman, J. A. 2003, ApJ, 582, 689
- (183) Maihara, T., Oda, N., Sugiyama, T., & Okuda, H. 1978, PASJ, 30, 1
- (184) Maiolino, R., Krabbe, A., Thatte, N., & Genzel, R. 1998, ApJ, 493, 650
- (185) Makarova, L. 1999, A&AS, 139, 491
- (186) Maller, A. H., Katz, N., Kereš, D., Davé, R., & Weinberg, D. H. 2006, ApJ, 647, 763
- (187) Maraston, C. 2005, MNRAS, 362, 799
- (188) Maraston, C., Daddi, E., Renzini, A., Cimatti, A., Dickinson, M., Papovich, C., Pasquali, A., & Pirzkal, N. 2006, ApJ, 652, 85
- (189) Marconi, A., Moorwood, A. F. M., Origlia, L., & Oliva, E. 1994, ESO Messenger, 78, 20
- (190) Marconi, A., Oliva, E., van der Werf, P. P., Maiolino, R., Schreier, E. J., Macchetto, F., & Moorwood, A. F. M. 2000, A&A, 357, 24
- (191) Márquez, I., Masegosa, J., Durret, F., González Delgado, R. M., Moles, M., Maza, J., Pérez, E., & Roth, M. 2003, A&A, 409, 459
- (192) Martín, S., Mauersberger, R., Martín-Pintado, J., Henkel, C., & García-Burillo, S. 2006, ApJS, 164, 450
- (193) Mayer, L., Governato, F., & Kaufmann, T. 2008, Advanced Sci. Letters, 1, 7
- (194) McGaugh, S. S. 2005, ApJ, 632, 859
- (195) McLure, R. J., & Dunlop, J. S. 2002, MNRAS, 331, 795
- (196) McMillan, P. J., & Binney, J. J. 2010, MNRAS, 402, 934
- (197) Meier, D. S., Turner, J. L., & Hurt, R. L. 2000, ApJ, 531, 200
- (198) Meier, D. S., Turner, J. L., & Hurt, R. L. 2008, ApJ, 675, 281
- (199) Méndez-Abreu, J., Aguerri, J. A. L., Corsini, E. M., & Simonneau, E. 2008, A&A, 478, 353
- (200) Menéndez-Delmestre, K., Sheth, K., Schinnerer, E., Jarrett, T. H., & Scoville, N. Z. 2007, ApJ, 657, 790
- (201) Merrifield, M. R., & Kuijken, K. 1999, A&A, 345, L47
- (202) Merritt, D. 1987, ApJ, 313, 121
- (203) Merritt, D., & Ferrarese, L. 2001, MNRAS, 320, L30
- (204) Merritt, D., Ferrarese, L., & Joseph, C. L. 2001, Science, 293, 1116
- (205) Möllenhoff, C. 2004, A&A, 415, 63
- (206) Möllenhoff, C., & Heidt, J. 2001, A&A, 368, 16
- (207) Möllenhoff, C., Matthias, M., & Gerhard, O. E. 1995, A&A, 301, 359
- (208) Mosenkov, A. V., Sotnikova, N. Ya., & Reshetnikov, V. P. 2010, MNRAS, 401, 559
- (209) Mouhcine, M., Ferguson, H. C., Rich, R. M., Brown, T. M., & Smith, T. E. 2005, ApJ, 633, 810
- (210) Mould, J., & Sakai, S. 2008, ApJ, 686, L75
- (211) Mueller Sánchez, F., Davies, R. I., Eisenhauer, F., Tacconi, L. J., Genzel, R., & Sternberg, A. 2006, A&A, 454, 481
- (212) Nair, P. B., & Abraham, R. G. 2010, ApJS, 186, 427
- (213) O’Connell, R. W. 1983, ApJ, 267, 80
- (214) Oliva, E., Origlia, L., Kotilainen, J. K., & Moorwood, A. F. M. 1995, A&A, 301, 55
- (215) Oswalt, T. D., Smith, J. A., Wood, M. A., & Hintzen, P. 1995, Nature, 382, 692
- (216) Ott, J., Martin, C. L., & Walter, F. 2003, ApJ, 594, 776
- (217) Ott, J., Walter, F., & Brinks, E. 2005a, MNRAS, 358, 1453
- (218) Ott, J., Weiss, A., Henkel, C., & Walter, F. 2005b, ApJ, 629, 767
- (219) Paczyński, B., & Stanek, K. Z. 1998, ApJ, 494, L219
- (220) Panessa, F., Barcons, X., Bassani, L., Cappi, M., Carrera, F. J., Ho, L. C., & Pellegrini, S. 2007, A&A, 467, 519
- (221) Panessa, F., Bassani, L., Cappi, M., Dadina, M., Barcons, X., Carrera, F. J., Ho, L. C., & Iwasawa, K. 2006, A&A, 455, 173
- (222) Paturel, G., Petit, C., Prugniel, Ph., Theureau, G., Rousseau, J., Brouty, M., Dubois, P., & Cambrésy, L. 2003, A&A, 412, 45
- (223) Peebles, P. J. E., & Nusser, A. 2010, Nature, 465, 565
- (224) Peletier, R. F. 2008, in ASP Conference Series, Volume 390, Pathways Through an Eclectic Universe, ed. J. H. Knapen, T. J. Mahoney, & A. Vazdekis (San Francisco: ASP), 232
- (225) Peletier, R. F., & Balcells, M. 1996, AJ, 111, 2238
- (226) Peletier, R. F., et al. 2006, in IAU Symposium 241, Stellar Populations as Building Blocks of Galaxies, ed. A. Vazdekis & R. F. Peletier (Cambridge: Cambridge University Press), 485
- (227) Peletier, R. F., et al. 2007a, MNRAS, 379, 445
- (228) Peletier, R. F., et al. 2007b, in IAU Symposium 245, Formation and Evolution of Galaxy Bulges, ed. M. Bureau, E. Athanassoula, & B. Barbuy (Cambridge: Cambridge University Press), 271
- (229) Peng, R., Zhou, S., Whiteoak, J. B., Lo, K. Y., & Sutton, E. C. 1996, ApJ, 470, 821
- (230) Pritchet, C. 1977, ApJS, 35, 397
- (231) Ptak, A., Serlemitsos, P., Yaqoob, T., & Mushotzky, R. 1999, ApJS, 120, 179
- (232) Raha, N., Sellwood, J. A., James, R. A. & Kahn, F. D. 1991, Nature, 352, 411
- (233) Ramsey, L. W., et al. 1998, Proc. SPIE, 3352, 34
- (234) Regan, M. W., Thornley, M. D., Helfer, T. T., Sheth, K., Wong, T., Vogel, S. N., Blitz, L., & Bock, D. C.-J. 2001, ApJ, 561, 218
- (235) Rejkuba, M. 2004, A&A, 413, 903
- (236) Richardson, W. H. 1972, J. Opt. Soc. Am., 62, 52
- (237) Rieke, G. H., Lebofsky, M. J., Thompson, R. I., Low, F. J., & Tokunaga, A. T. 1980, ApJ, 238, 24
- (238) Rix, H.-W., Kennicutt, R. C., Braun, R., & Walterbos, R. A. M. 1995, ApJ, 438, 155
- (239) Rizzi, L., Tully, R. B., Makarov, D., Makarova, L., Dolphin, A. E., Sakai, S., & Shaya, E. J. 2007, ApJ, 661, 815
- (240) Robertson, B., Yoshida, N., Springel, V., & Hernquist, L. 2004, ApJ, 606, 32
- (241) Rodrigues, I., Dottori, H., Díaz, R. J., Agüerro, M. P., & Mast, D. 2009, AJ, 137, 4083
- (242) Rosolowsky, E., Keto, E., Matsushita, S., & Willner, S. P. 2007, ApJ, 661, 830
- (243) Rubin, V. C. 1993, Proc. Nat. Acad. Sci., 90, 4814
- (244) Rubin, V. C. 1994a, AJ, 107, 173
- (245) Rubin, V. C. 1994b, AJ, 108, 456
- (246) Saha, A., Claver, J., & Hoessel, J. G. 2002, AJ, 124, 839
- (247) Saha, A., Thim, F., Tammann, G. A., Reindl, B., & Sandage, A. 2006, ApJS, 165, 108
- (248) Sakai, S, Ferrarese, L., Kennicutt, R. C., & Saha, A. 2004, ApJ, 608, 42
- (249) Sánchez-Portal, M., Díaz, A. I., Terlevich, E., & Terlevich, R. 2004, MNRAS, 350, 1087
- (250) Sandage, A. 1961, The Hubble Atlas of Galaxies (Washington: Carnegie Institution of Washington)
- (251) Sandage, A., Binggeli, B., & Tammann, G. A. 1985a, in ESO Workshop on the Virgo Cluster, ed. O.-G. Richter & B. Binggeli (Garching: ESO), 239
- (252) Sandage, A., Binggeli, B., & Tammann, G. A. 1985b, AJ, 90, 1759
- (253) Sargent, W. L. W., Schechter, P. L., Boksenberg, A., & Shortridge, K. 1977, ApJ, 212, 326
- (254) Sarzi, M., Rix, H.-W., Shields, J. C., Rudnick, G., Ho, L. C., McIntosh, D. H., Filippenko, A. V., & Sargent, W. L. W. 2001, ApJ, 550, 65
- (255) Scarlata, C., et al. 2004, AJ, 128, 1124
- (256) Schinnerer, E., Böker, T., Emsellem, E., & Downes, D. 2007, A&A, 462, L27
- (257) Schinnerer, E., Böker, T., Emsellem, E., & Lisenfeld, U. 2006, ApJ, 649, 181
- (258) Schlegel, D. J., Finkbeiner, D. P., & Davis, M. 1998, ApJ, 500, 525
- (259) Schlegel, E. M. 1994, ApJ, 434, 523
- (260) Schlegel, E. M., Blair, W. P., & Fesen, R. A. 2000, AJ, 120, 791
- (261) Schlegel, E. M., Holt, S. S., & Petre, R. 2003, ApJ, 598, 982
- (262) Schmidt, A. A., Bica, E., & Alloin, D. 1990, MNRAS, 243, 620
- (263) Schweizer, F. 1989, in Dynamics and Interactions of Galaxies, ed. R. Wielen (New York: Springer), 60
- (264) Seigar, M. S., Barth, A. J., & Bullock, J. S. 2008, MNRAS, 389, 1911
- (265) Sérsic, J. L. 1968, Atlas de Galaxias Australes (Córdoba, Argentina: Observatorio Astronómico, Universidad Nacional de Córdoba)
- (266) Shen, J., Rich, R. M., Kormendy , J., Howard, C. D., De Propris, R., & Kunder, A. 2010, ApJ, 720, L72
- (267) Shostak, G. S. 1987, A&A, 175, 4
- (268) Silge, J. D., Gebhardt, K., Bergmann, M., & Richstone, D. 2005, AJ, 130, 406
- (269) Siopis, C., et al. 2009, ApJ, 693, 946
- (270) Simien, F., & de Vaucouleurs, G. 1986, ApJ, 302, 564
- (271) Skrutskie, M. F., et al. 2006, AJ, 131, 1163
- (272) Sofue, Y. 1996, ApJ, 458, 120
- (273) Sofue, Y. 1997, PASJ, 49, 17
- (274) Springob, C. M., Masters, K. L., Haynes, M. P., Giovanelli, R., & Marinoni, C. 2007, ApJS, 172, 599
- (275) Smith, J., Gehrz, R. D., Grasdalen, G. L., Hackwell, J. A., Dietz, R. D., & Friedman, S. D. 1990, ApJ, 362, 455
- (276) Stanek, K. Z., & Garnavich, P. M. 1998, ApJ, 503, L131
- (277) Steinmetz, M., & Navarro, J. F. 2002, NewA, 7, 155
- (278) Stewart, K. R., Bullock, J. S., Wechsler, R. H., & Maller, A. H. 2009, ApJ, 702, 307
- (279) Stewart, K. R., Bullock, J. S., Wechsler, R. H., Maller, A. H., & Zentner, A. R. 2008, ApJ, 683, 597
- (280) Stover, R. J. 1988, in Instrumentation for Ground-Based Optical Astronomy: Present and Future, ed. L. B. Robinson ( New York: Springer), 443
- (281) Strickland, D. K., Heckman, T. M., Colbert, E. J. M., Hoopes, C. G., & Weaver, K. A. 2004, ApJ, 606, 829
- (282) Tacconi, L. J., & Young, J. S. 1986, ApJ, 308, 600
- (283) Telesco, C. M., Dressel, L. L., & Wolstencroft, R. D. 1993, ApJ, 414, 120
- (284) Tempel, E., Tamm, A., & Tenjes, P. 2010, A&A, 509, A91
- (285) Thatte, N., Tecza, M., & Genzel, R. 2000, A&A, 364, L47
- (286) Thim, F., Tammann, G. A., Saha, A., Dolphin, A.. Sandage, A., Tolstoy, E., & Labhardt, L. 2003, ApJ, 590, 256
- (287) Tilanus, R. P. J., & Allen, R. J. 1991, A&A, 244, 8
- (288) Tody, D. 1993, in ASP Conference Series 52, Astronomical Data Analysis Software and Systems II, ed. R. J. Hanisch, R. J. V. Brissenden, & J. Barnes (San Francisco: ASP), 173
- (289) Tonry, J. L. 1984, ApJ, 283, L27
- (290) Tonry, J. L. 1987, ApJ, 322, 632
- (291) Tonry, J. L., Dressler, A., Blakeslee, J. P., Ajhar, E. A., Fletcher, A. B., Luppino, G. A., Metzger, M. R., & Moore, C. B. 2001, ApJ, 546, 681
- (292) Toomre, A. 1977, in The Evolution of Galaxies and Stellar Populations, ed. B. M. Tinsley & R. B. Larson (New Haven: Yale Univ. Observatory), 401
- (293) Tóth, G., & Ostriker, J. P. 1992, ApJ, 389, 5
- (294) Tremaine, S., & Ostriker, J. P. 1982, ApJ, 256, 435
- (295) Tremaine, S., et al. 2002, ApJ, 574, 740
- (296) Tsai, C.-W., Turner, J. L., Beck, S. C., Crosthwaite, L. P., Ho, P. T. P., & Meier, D. S. 2006, AJ, 132, 2383
- (297) Tull, R. G. 1988, Proc SPIE, 3355, 387
- (298) Tully, R. B. 1988, Nearby Galaxies Catalog (Cambridge: Cambridge University Press)
- (299) Turner, J. L., & Ho, P. T. P. 1983, ApJ, 268, L79
- (300) Turner, J. L., & Ho, P. T. P. 1994, ApJ, 421, 122
- (301) van Albada, G. D. 1980, A&A, 90, 123
- (302) van den Bergh, S. 1976, ApJ, 203, 764
- (303) van den Bergh, S. 1991, PASP, 103, 609
- (304) van der Marel, R. P., Evans, N. W., Rix, H.-W., White, S. D. M., & de Zeeuw, P. T. 1994b, MNRAS 271, 99
- (305) van der Marel, R. P., Rix, H.-W., Carter, D., Franx, M., White, S. D. M., & de Zeeuw, P. T. 1994a, MNRAS, 268, 521
- (306) van Dokkum, P. G. 2001, PASP, 113, 1420
- (307) van Moorsel, G. A., & Wells, D. C. 1985, AJ, 90, 1038
- (308) Vega Beltrán, J. C., Pizzella, A., Corsini, E. M., Funes, J. G., Zeilinger, W. W., Beckman, J. E., & Bertola, F. 2001, A&A, 374, 394
- (309) Visser, H. D. C. 1980, A&A, 88, 149
- (310) Walcher, C. J., van der Marel, R. P., McLaughlin, D., Rix, H.-W., Böker, T., Häring, N., Ho, L. C., Sarzi, M., & Shields, J. C. 2005, ApJ, 618, 237
- (311) Walker, C. E., Lebofsky, M. J., & Rieke, G. H. 1988, ApJ, 325, 687
- (312) Wang, M., Henkel, C., Chin, Y.-N., Whiteoak, J. B., Hunt Cunningham, M., Mauersberger, R., & Muders, D. 2004, A&A, 422, 883
- (313) Weiland, J. L., et al. 1994, ApJ, 425, L81
- (314) Weinzirl, T., Jogee, S., Khochfar, S., Burkert, A., & Kormendy, J. 2009, ApJ, 696, 411
- (315) White, S. D. M., & Rees, M. J. 1978, MNRAS, 183, 341
- (316) Wilson, A. S., Shopbell, P. L., Simpson, C., Storchi-Bergmann, T., Barbosa, F. K. B., & Ward, M. J. 2000, AJ, 120, 1325
- (317) Winget, D. E., & Kepler, S. O. 2008, ARA&A, 46, 157
- (318) Wolf, J., Martinez, G. D., Bullock, J. S., Kaplinghat, M., Geha, M., Muñoz, R. R., Simon, J. D., & Avedo, F. F. 2010, MNRAS, 406, 1220
- (319) Wong, T., & Blitz, L. 2000, ApJ, 540, 771
- (320) Wyse, R. F. G, Gilmore, G., & Franx, M. 1997, ARA&A, 35, 637
- (321) Yun, M. S., Ho, P. T. P., & Lo, K. Y. 1994, Nature, 372, 530
- (322)