Spectroscopy of a narrow-line laser cooling transition in atomic dysprosium
Abstract
The laser cooling and trapping of ultracold neutral dysprosium has been recently demonstrated using the broad, open 421-nm cycling transition. Narrow-line magneto-optical trapping of Dy on longer wavelength transitions would enable the preparation of ultracold Dy samples suitable for loading optical dipole traps and subsequent evaporative cooling. We have identified the closed 741-nm cycling transition as a candidate for the narrow-line cooling of Dy. We present experimental data on the isotope shifts, the hyperfine constants and , and the decay rate of the 741-nm transition. In addition, we report a measurement of the 421-nm transition’s linewidth, which agrees with previous measurements. We summarize the laser cooling characteristics of these transitions as well as other narrow cycling transitions that may prove useful for cooling Dy.
pacs:
32.70.Cs, 32.80.Pj, 37.10.DeI Introduction
Due to its extraordinarily large ground state magnetic dipole moment ( Bohr magnetons), dysprosium is a prime candidate for the study of ultracold dipolar physics Lahaye et al. (2009); *Fregoso:2009; *Fregoso:2009b; *Machida10. The Dy atom belongs to the lanthanide (rare-earth) group and has ten elections in an open shell submerged under closed shells. Numerous combinations of valence electron couplings lead to a multitude of electronic energy levels. Laser cooling Dy in a traditional manner would require an impracticable number of repumper lasers due to the large number of metastable states below 421 nm (see Fig. 1). Consequently, preparation of cold Dy samples had been limited to the method of buffer gas cooling Hancox et al. (2004); *Newman2010. Recent progress in the laser cooling and trapping of Dy atoms in a repumper-less magneto-optical trap (MOT) Lu et al. (2010) now allows the creation of large population samples at 100 colder temperatures. Laser cooling and trapping Dy constitutes a new route toward achieving Bose and Fermi degeneracy in this most magnetic of atoms 111Fermionic Dy’s magnetic moment is the largest of all elements, and bosonic Dy’s is equal only to terbium’s Martin et al. (1978)..
However, further progress necessitates the optical trapping of Dy Metcalf and P. van der Straten (1999) so that evaporative cooling may proceed without suffering trap losses arising from dipole-relaxation-induced inelastic collisions Hensler et al. (2003). A possible solution lies in the narrow-line-cooling of Dy in a manner similar to that demonstrated in the highly magnetic erbium system Berglund et al. (2008). A narrow-line Dy MOT could produce Dy temperatures in the K-range. Such ultracold samples would be readily confined in standard optical dipole traps (ODTs).
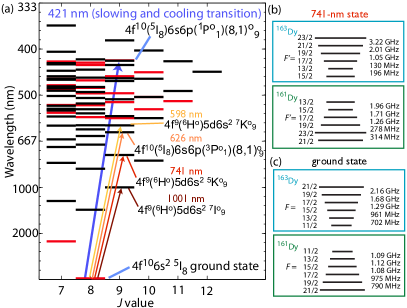
We focus here on the characteristics of the cycling transition at wavelength 741 nm. We believe this transition to be a prime candidate for creating a narrow-line MOT in a similar manner as that demonstrated in Ref. Berglund et al. (2008) for Er. Existing spectroscopic data Martin et al. (1978) are insufficient for implementing the 741-nm narrow-line MOT, and we present here the first measurements of this transition’s hyperfine structure, isotope shifts, and lifetime. Together these measurements provide a sufficient spectroscopic guide for attempting the 741-nm narrow-line cooling of Dy’s bosonic and fermionic isotopes.
Standard spectroscopic records Martin et al. (1978) had misrecorded by 21% the linewidth of the 401-nm state used for Er laser cooling McClelland (2006). Linewidth verification of the analogous transition in Dy (at 421 nm) is therefore justified, and we present a linewidth measurement that is consistent with previous measurements. Finally, we discuss the properties and relative merits of other optical transitions at 598 nm, 626 nm and 1001 nm that could also be used for laser cooling.
II 741-nm transition
We discuss in this section an optical transition at 741 nm that could prove important for creating narrow-line Dy MOTs. Although the broad, blue 421-nm transition is highly effective for cooling Dy atoms from an atomic beam and in a MOT Youn et al. (2010a), the transition’s 1 mK Doppler limit is too high for directly loading an ODT. Due to its narrow linewidth (unmeasured until now), the red 741-nm transition provides a means to Doppler cool with a very low temperature limit. Our measurements indicate that this transition’s recoil temperature would be higher than its Doppler-limited temperature: Observing novel laser cooling phenomena Loftus et al. (2004) might be possible using this transition.
II.1 Experimental apparatus for measuring isotope shifts and hyperfine structure
The spectroscopic measurement for determining the isotope shifts and hyperfine structure employs a crossed excitation laser and atomic beam method Demtröder (2008). In a UHV chamber Youn et al. (2010a), thermal Dy atoms effuse from a high-temperature oven working at 1275 ∘C. The atoms are collimated by a long differential pumping tube which forms an atomic beam with a diameter of 5 mm and a diverging (half) angle of 0.02 rad. The beam enters a chamber with two pairs of optical viewports oriented orthogonally to the atomic beam.
| Coeff. | 163Dy222Ref. Dzuba and Flambaum (2010) | 163Dy | 161Dy | 333Ref. Childs (1970) | |
|---|---|---|---|---|---|
| 142 | 142.91(3) | -102.09(2) | -1.3999(4) | -1.40026(4) | |
| 4000 | 4105(2) | 3883(1) | 1.0570(9) | 1.05615(90) |
A 5 mW 741-nm laser beam [1/e2 waist (radius) 2 mm] from an external cavity diode laser (ECDL) is directed through the UHV chamber via one pair of viewports. This laser has a mode-hop-free region of 20 GHz. Atomic fluorescence on the 741-nm line is collected through an orthogonal viewport by a AR-coated achromatic lens pair with a magnification of 0.4. This forms an image on the detection area (-mm diameter) of a femtowatt photodetector (DC gain: V/W, bandwidth 750 Hz). The whole system is carefully shielded from stray light.
The direct output from the detector suffers from low signal-to-noise due to the oven’s thermal radiation and the multiple scattering of 741-nm light from the windows and the chamber’s inner walls. An electronic bandpass filter (0.3 Hz to 3 kHz) with a DC amplification of 10 improves the signal-to-noise to a sufficient level without artificially broadening the Doppler-limited resonances. With a laser scanning rate of GHz/s and a 15 MHz Doppler-broadening (measured in Sec. III), the 2 ms rise and fall time of the spectral peaks are slower than the detector’s response time.
To measure the full spectrum of isotope shifts and hyperfine states, we scan the ECDL using the piezoelectric transducer (PZT) that modulates its grating position. However, the free scan of the ECDL suffers from the slight nonlinear scanning of the PZT versus drive voltage. We reduce the nonlinearity by limiting the scan range and by scanning the PZT slowly to prevent inertial effects. To calibrate the frequency scan, we couple the 741-nm light into a temperature-stabilized 750 MHz free-spectral range (FSR) confocal cavity. Simultaneously recording the transmission of the confocal cavity with the fluorescence signal provides a frequency calibration as the ECDL is scanned. The FSR of the cavity itself is measured via rf sidebands imprinted onto the cavity-coupled 741-nm light with a stable and calibrated rf frequency source. To correct for the nonlinearity of the scan, a calibration is performed by fitting a polynomial to the cavity spectrum. The maximum deviation throughout the scan due to a quadratic term is 3% of the linear term (the cubic term is negligible); we corrected the nonlinear effect up to quadratic order.
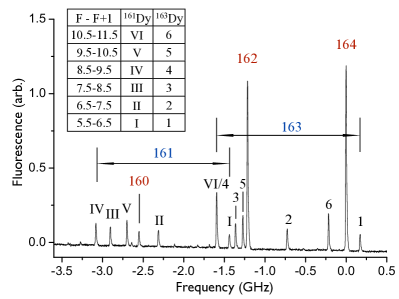
The calibrated spectrum after 512 averages is shown in Fig. 2. These data are sufficient to resolve and identify all () 741-nm transitions for the bosonic (fermionic) isotopes. Optical pumping is a negligible effect in this spectrum since the 10 s transit time is much shorter than the transition lifetime (see Sec. II.4).
II.2 Hyperfine structure
The position and ordering of 163Dy and 161Dy’s hyperfine peaks in the spectrum are given by the ground and excited state’s and coefficients 444The and coefficients are defined in, e.g., Ref. Metcalf and P. van der Straten (1999).. Identification of the isotope and hyperfine transition peaks are found with guidance from the calculations in Ref. Dzuba and Flambaum (2010), and a least squares fitting routine extracts the experimental values of and (see Table 1). Since this is a cycling transition, the strongest observed lines for the fermions are of the type; the much weaker Sobelman (1992) transitions are visible as the small, unlabeled peaks in Fig. 2. We note that for the excited states, the ratios of and are consistent with the analogous ratios for the ground state; there is no noticeable hyperfine anomaly for the 741-nm transition Clark et al. (1977).
II.3 Isotope shifts
| Isotope shifts | 741nm | 457 nm555Ref. Zaal et al. (1980) |
|---|---|---|
| 164Dy | 0 | 0 |
| 163Dy | MHz | MHz |
| 162Dy | MHz | MHz |
| 161Dy | MHz | MHz |
| 160Dy | MHz | MHz |
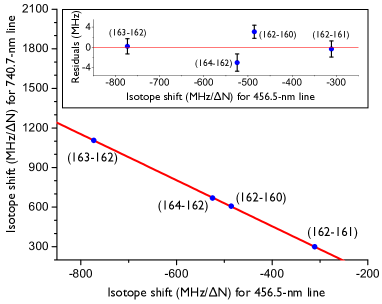
The measured isotope shifts (from 164Dy to 160Dy) for the 741-nm transition are listed in Table 2, together with the isotope shifts for the 457-nm line. The 457-nm line has a pure electronic configuration which makes it useful as a reference transition for creating the King plot Budker et al. (2008) described below. The fermionic isotope shifts are derived from the center-of-gravity of the hyperfine peaks, the positions of which are extracted from hyperfine structure fits. We could not obtain the isotope shift of 158Dy and 156Dy due to their low natural abundances and the weak strength of the 741-nm transition.
We draw the King plot using the documented transition at 457 nm as the reference transition Zaal et al. (1980); Leefer et al. (2008). The isotope shift includes the contribution from the mass term, which is related to the change of isotope mass, and the field shift, which is due to the finite possibility of electrons being inside the nucleus. Different electron configurations lead to different field shifts: From the fit of the isotope shifts of the 741-nm transition plotted against those values for 457 nm, the ratio of electronic field-shift parameter is determined based on the slope of the linear fit. The minus sign indicates the very different nature of two transitions, i.e., one is of type while the other is .
The mass term includes the normal mass shift (NMS) and specific mass shift (SMS). The NMS for the 457-nm and 741-nm transitions are MHz and MHz, respectively Budker et al. (2008). The SMS of the 457-nm transition is 7(8) MHz Zaal et al. (1980), which allows us to calculate the SMS for the 741-nm line: MHz, based on the intercept of the King plot. Such a large SMS is known to arise from the following effects: electrons deeply buried inside the electron core, strong electron correlations, and electrons coupling to each other before coupling to the outer electrons Cowan (1973). A transition of type leaves the inner electrons little changed, while transitions lead to large changes in the inner electron correlations. The large experimental value of the 741-nm transition SMS is consistent with the typical values for transitions Jin et al. (2001).
II.4 Lifetime measurement
A direct lifetime measurement based on the fluorescence decay observed with the crossed-beam method is not possible due to large transit time broadening relative to the natural decay time. Therefore, we resort to measuring the fluorescence scattered from relatively static atoms, i.e., from the 1 mK atoms in the MOT and in the magnetostatic trap (MT). We measure a consistent lifetime with both methods.
In the “MOT” method, we shine a retroreflected 5 mW 741-nm excitation beam of waist 3 mm onto a MOT generated on the 421-nm transition and record the decay of 741-nm scattered light after the 741-nm beam is extinguished. While the 741-nm excitation beam is on, the system establishes a steady-state population distribution among the 421-nm, 741-nm, and ground states. By switching on and off the 741-nm laser beam with a period of s, the atoms initially shelved in the 741-nm state will decay back to the ground state via the spontaneous emission of 741-nm photons. The small branching ratio of the 421-nm transition, measured in previous work Lu et al. (2010); Youn et al. (2010a), means that the Dy atom is effectively a three-level system during the 250 s decay measurement: decay out of the three-level system from 421-nm state to the metastable states occurs on a much longer time scale, 2 ms. Solutions to the optical Bloch equations Cohen-Tannoudji et al. (1998) for such a “V” system—two excited states coupled to a ground state via resonant 421-nm and 741-nm light—verify that the decay rate observed is equal to the decay rate of the bare 741-nm state.
An avalanche photodetector (APD) and collection lenses with a 741-nm narrow bandpass filter is used to detect the weak signal, which we average 10752 times to obtain the data in Fig. 4(a). Note that for neither this method nor the following one does the presence of 421-nm light or magnetic field gradients affect the natural decay rate measurement of the closed 741-nm transition.
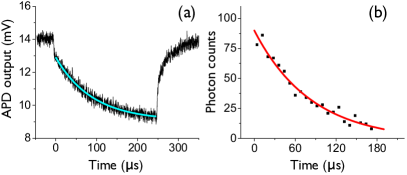
In the “MT” method, we extinguish the 421-nm MOT light and capture the atoms in the magnetic quadrupole field of the now-extinguished MOT. We wait 5 s to allow the atoms to equilibrate in the MT Lu et al. (2010) before shining onto the trap a resonant retroreflected 741-nm beam of 5 mW power and waist 3 mm. A single photon counter with collection lenses and a 741-nm bandpass filter records the very weak flux of 741-nm photons from the MT after the 741-nm excitation beam is extinguished [see Fig. 4(b)]. The long experimental run time necessary to measure a single decay limits the obtainable statistics.
Single exponential fits to the data in both methods derive lifetimes that are consistent with each other (see Table 3). We note that the values are 4 longer than the theoretical value reported in Ref. Dzuba and Flambaum (2010), and the measurement reported here may be used to refine Dy structure calculations Dzuba . With such a narrow linewidth—the weighted combination of the lifetime is 89.3(8) s, resulting in a linewidth of 1.78(2) kHz—narrow-line cooling on the 741-nm transition is technically challenging for red-detuned narrow-line MOTs, since the laser linewidth should be comparably narrow Loftus et al. (2004). However, a blue-detuned narrow-line MOT, which relies on the atoms’ large magnetic dipole and has been demonstrated with Er Berglund et al. (2008), does not require a laser linewidth as narrow as the addressed atomic line; a narrow-line blue-detuned MOT on the 741-nm line seems feasible.
| MOT method | MT method | Theory666Ref. Dzuba and Flambaum (2010) |
|---|---|---|
III 421-nm transition
Quantitative understanding of the population, dynamics, and cooling mechanisms Youn et al. (2010b) of the Dy MOT requires the accurate knowledge of the 421-nm transition’s linewidth. To ensure the use of the correct value of the 421-nm transition linewidth in laser cooling calculations, we remeasure this linewidth using the crossed-beam method described earlier, though with a 421-nm beam derived from a frequency-doubled Ti:Sapphire laser.
To uniformly and stably scan the laser frequency, we employ the transfer cavity technique to lock the laser to a spectroscopic reference Youn et al. (2010a). The optical transfer cavity is doubly resonant at 780 nm and 842 nm. The cavity itself is stabilized by locking a 780-nm ECDL to a hyperfine transition of the 780-nm D2 line in Rb before locking a resonance of the cavity to the stabilized ECDL. The Ti:Sapphire laser which generates the 842-nm beam is then locked to this cavity. In order to scan the Ti:Sapphire laser’s frequency while the cavity remains locked to Rb, an electro-optical modulator driven by a microwave source generates tunable GHz-frequency sidebands on the 842-nm laser beam. By locking the sideband to the cavity, the carrier frequency can be stably scanned via tuning the microwave source. The 421-nm laser beam is obtained from a resonant LBO doubler. In the experiment, the laser frequency is scanned 400 MHz with a period of 1 s to ensure that the bandwidth of the PIN photodetector does not artificially broaden the transition. The fluorescence was collected via a pair of 2” achromatic doublets mounted outside an AR-coated UHV viewport. The electronic detector output was recorded on a fast digital oscilloscope and averaged 64 times.
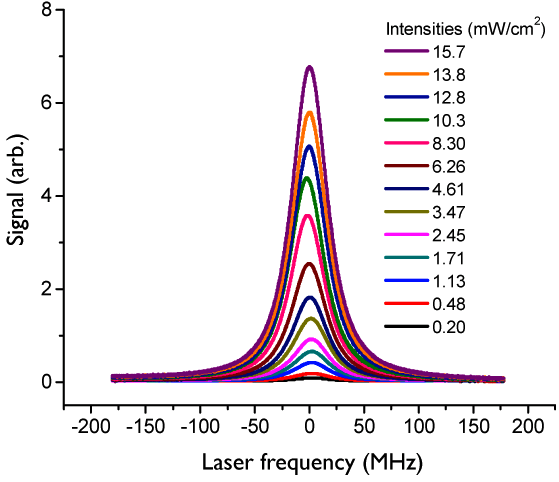
The fluorescence versus frequency is shown in Fig. 5. The profile has the typical Voigt form due to the residual Doppler broadening of the atomic beam. Curves corresponding to different laser beam intensities possess differing linewidths due to power broadening. A global Voigt fit allows a deconvolution of the Doppler width from the transition linewidth by assuming a single Gaussian Doppler width and by accounting for the power broadening from the laser. The fitted value for the Doppler broadening is 14.8(6) MHz, which is consistent with the estimation of the residual Doppler broadening based on the geometry of the collimation tube and oven orifice.
At low intensities, the power broadening is linear as a function of laser intensity. A linear fit to the extracted linewidths provides the natural linewidth at the zero-intensity limit McClelland (2006). The extrapolated value for the natural linewidth of the 421-nm transition is 31.9(8) MHz. The uncertainty in the linewidth measurement arises from the error sources listed in Table 4. Among the errors, the largest source is the laser frequency drift from the imperfect transfer cavity lock. Unlike for Er McClelland (2006), this measurement result is consistent with that listed in the standard tables, 33.1(17) MHz Martin et al. (1978); Curry et al. (1997).
IV Alternative laser cooling transitions
Unlike the 421-nm line, the 598-nm, 626-nm, 741-nm and 1001-nm lines are closed cycling transitions; laser cooling on them would obviate the need for repumping lasers or magnetic confinement in metastable states. While the 421-nm transition has been used to form the first Dy MOT Lu et al. (2010) and the 741-nm transition—easily generated by a stabiized ECDL—is a good candidate for narrow-line cooling, the other three transitions might also be useful for laser cooling and trapping.
Table 5 summarizes these five laser cooling transitions: is the Landé factor of the excited state; is the transition decay rate; the linewidth is ; and the excited state lifetime is . From these values, we can calculate some quantities of importance to laser cooling and trapping Metcalf and P. van der Straten (1999). The saturation intensity is, e.g., an estimate of the required MOT laser power; the capture velocity provides a measure of the velocity range within which atoms can be collected in a MOT; is the Doppler cooling temperature limit; and is the temperature limit due to photon recoils.
The 1001-nm transition was considered as a candidate for narrow-line cooling because this is an intercombination transition which typically possesses narrow linewidth. We used the same experimental apparatus as in the 741-nm measurement—though a different ECDL laser—to find and measure the linewidth of the 1001-nm transition. However, we did not detect the line. Concurrently, theoretical calculations in Ref. Dzuba and Flambaum (2010) predicted the exceptionally small linewidth of Hz, which explains our inability to detect the line with our current apparatus. This ultranarrow linewidth limits the transition’s utility for a MOT, but along with the 741-nm line, the 1001-nm transition may be useful for resolved sideband cooling in an optical lattice Ido and Katori (2003); Grain et al. (2007); Dzuba et al. . This cooling technique may provide an alternative method Olshanii and Weiss (2002) to evaporative cooling for the production of degenerate Dy gases.
| Source | Uncertainty (MHz) |
|---|---|
| Extrapolation to zero intensity | 0.13 |
| Drift of laser during scans777Scan nonlinearity is negligible in transfer cavity technique. | 0.7 |
| Laser linewidth | 0.1 |
| Rise time of detector | 0.4 |
The 626-nm transition has a intermediate linewidth of kHz, which could be used as the main laser cooling and trapping transition in a MOT while the atomic beam is Zeeman-slowed via the broad 421-nm transition. The benefit of such a combination Kuwamoto et al. (1999) lies in the lower MOT temperature, since the 626-nm transition’s Doppler limit is only 3.2 K. A colder MOT facilitates subsequent ODT loading. However, this combination requires the use of a narrow-linewidth dye-based laser to obtain 626-nm light. We note that the large Landé factor difference between the excited state (1.29) and ground state (1.24) suggests that intra-MOT sub-Doppler cooling Berglund et al. (2007); Youn et al. (2010b) will not be as effective on this transition.
| Line | ||||||||
|---|---|---|---|---|---|---|---|---|
| 888Present work, 2.5% uncertainty | ||||||||
| 999Ref. Dzuba and Flambaum (2010), theory | ||||||||
| 101010Ref. Martin et al. (1978), experiment 5% uncertainty | ||||||||
| 111111Present work, 1% uncertainty | ||||||||
| 121212Ref. Dzuba and Flambaum (2010), theory |
The linewidth of the 598-nm transition has yet to be measured, but the calculated value Dzuba and Flambaum (2010) indicates a linewidth of kHz. This narrow linewidth would be optimal for conventional narrow-line cooling as performed in, e.g., ultracold Sr experiments Loftus et al. (2004), but again, the line must be generated with a dye-based laser. Its excited state Landé factor (1.24) is almost the same as its ground state’s, which bodes well for effective intra-MOT sub-Doppler cooling.
V summary
We measured the natural lifetime of the 741-nm line of Dy using a Dy MOT and magnetic trap; the weighted average is 89.3(8) s. We predict that this closed cycling transition will be useful for the formation of a narrow-line MOT, which could cool Dy to the ultracold temperatures necessary for loading an optical dipole trap. The isotope shifts and hyperfine structure ( and coefficients) were measured for all five high-abundance Dy isotopes, providing a spectral roadmap for the future narrow-line cooling of bosonic and fermionic Dy. In addition, we verified the linewidth of the 421-nm transition in Dy to be 31.9(8) MHz, a precautionary measure taken since the standard tables had listed the analogous transition in Er to be in error by 21%. Finally, we tabulated—based on up-to-date linewidth information—the laser cooling properties of other attractive transitions in Dy.
Acknowledgements.
We acknowledge support from the NSF (PHY08-47469), AFOSR (FA9550-09-1-0079), and the Army Research Office MURI award W911NF0910406.References
- Lahaye et al. (2009) T. Lahaye, C. Menotti, L. Santos, M. Lewenstein, and T. Pfau, Rep. Prog. Phys. 72, 126401 (2009).
- Fregoso et al. (2009) B. M. Fregoso, K. Sun, E. Fradkin, and B. L. Lev, New J. Phys. 11, 103003 (2009).
- Fregoso and Fradkin (2009) B. M. Fregoso and E. Fradkin, Phys. Rev. Lett. 103, 205301 (2009).
- J. A. M. Huhtamäki et al. (2010) J. A. M. Huhtamäki, M. Takahashi, T. P. Simula, T. Mizushima, and K. Machida, Phys. Rev. A 81, 063623 (2010).
- Hancox et al. (2004) C. Hancox, S. Doret, M. Hummon, L. Luo, and J. Doyle, Nature 431, 281 (2004).
- Newman et al. (2010) B. Newman, N. Brahms, Y.-S. Au, C. Johnson, C. Connolly, J. M. Doyle, D. Kleppner, and T. J. Greytak, (2010), to be published.
- Lu et al. (2010) M. Lu, S.-H. Youn, and B. L. Lev, Phys. Rev. Lett. 104, 063001 (2010).
- Note (1) Fermionic Dy’s magnetic moment is the largest of all elements, and bosonic Dy’s is equal only to terbium’s Martin et al. (1978).
- Metcalf and P. van der Straten (1999) H. J. Metcalf and P. van der Straten, Laser Cooling and Trapping (Springer-Verlag, New York, 1999).
- Hensler et al. (2003) S. Hensler, J. Werner, A. Griesmaier, P. O. Schmidt, A. Görlitz, T. Pfau, S. Giovanazzi, and K. Rzazewski, Appl. Phys. B 77, 765 (2003).
- Berglund et al. (2008) A. J. Berglund, J. L. Hanssen, and J. J. McClelland, Phys. Rev. Lett. 100, 113002 (2008).
- Martin et al. (1978) W. C. Martin, R. Zalubas, and L. Hagan, Atomic Energy Levels–The Rare Earth Elements (NSRDS-NBS, 60, Washington, D.C., 1978).
- Childs (1970) W. J. Childs, Phys. Rev. A 2, 1692 (1970).
- McClelland (2006) J. J. McClelland, Phys. Rev. A 73, 064502 (2006).
- Youn et al. (2010a) S.-H. Youn, M. Lu, U. Ray, and B. L. Lev, (2010a), arXiv:1007.1480 .
- Loftus et al. (2004) T. H. Loftus, T. Ido, A. D. Ludlow, M. M. Boyd, and J. Ye, Phys. Rev. Lett. 93, 073003 (2004).
- Demtröder (2008) W. Demtröder, Laser spectroscopy (Springer-Verlag, Berlin Heidelberg, 2008).
- Dzuba and Flambaum (2010) V. A. Dzuba and V. V. Flambaum, Phys. Rev. A 81, 052515 (2010).
- Note (2) The and coefficients are defined in, e.g., Ref. Metcalf and P. van der Straten (1999).
- Sobelman (1992) I. I. Sobelman, Atomic spectra and radiative transitions (Springer-Verlag, New York, 1992).
- Clark et al. (1977) D. L. Clark, M. E. Cage, and G. W. Greenlees, Phys. Lett. 62A, 439 (1977).
- Zaal et al. (1980) G. J. Zaal, W. Hogervorst, E. R. Eliel, K. A. H. van Leeuwen, and J. Blok, J. Phys. B 13, 2185 (1980).
- Budker et al. (2008) D. Budker, D. F. Kimball, and D. P. DeMille, Atomic physics (Oxford University Press, New York, 2008).
- Leefer et al. (2008) N. Leefer, A. Cingöz, and D. Budker, Opt. Lett. 34, 2548 (2008).
- Cowan (1973) R. D. Cowan, Nucl. Instr. Meth. 110, 173 (1973).
- Jin et al. (2001) W.-G. Jin, T. Wakui, T. Endo, H. Uematsu, T. Minowa, and H. Karsuragawa, J. Phys. Soc. Japan 70, 2316 (2001).
- Cohen-Tannoudji et al. (1998) C. Cohen-Tannoudji, J. Dupont-Roc, and G. Grynberg, Atom-Photon Interactions: Basic Processes and Applications (Wiley Science, USA, 1998).
- (28) V. Dzuba, Private communication (2010).
- Youn et al. (2010b) S.-H. Youn, M. Lu, and B. L. Lev, (2010b), arXiv:1007.3245 .
- Curry et al. (1997) J. J. Curry, E. A. Den Hartog, and J. E. Lawler, J. Opt. Soc. Am. B 14, 2788 (1997).
- Ido and Katori (2003) T. Ido and H. Katori, Phys. Rev. Lett. 91, 053001 (2003).
- Grain et al. (2007) C. Grain, T. Nazarova, C. Degenhardt, F. Vogt, C. Lisdat, E. Tiemann, U. Sterr, and F. Riehle, Eur. Phys. J. D 42, 317 (2007).
- (33) V. A. Dzuba, V. V. Flambaum, and B. L. Lev, In preparation.
- Olshanii and Weiss (2002) M. Olshanii and D. Weiss, Phys. Rev. Lett. 89, 090404 (2002).
- Kuwamoto et al. (1999) T. Kuwamoto, K. Honda, Y. Takahashi, and T. Yabuzaki, Phys. Rev. A 60, R745 (1999).
- Berglund et al. (2007) A. J. Berglund, S. A. Lee, and J. J. McClelland, Phys. Rev. A 76, 053418 (2007).