Are Galaxy Clusters Suggesting an Accelerating Universe?
Abstract
The present cosmic accelerating stage is discussed through a new kinematic method based on the Sunyaev- Zel’dovich effect (SZE) and X-ray surface brightness data from galaxy clusters. By using the SZE/X-ray data from 38 galaxy clusters in the redshift range [Bonamente et al., Astrop. J. 647, 25 (2006)] it is found that the present Universe is accelerating and that the transition from an earlier decelerating to a late time accelerating regime is relatively recent. The ability of the ongoing Planck satellite mission to obtain tighter constraints on the expansion history through SZE/X-ray angular diameters is also discussed. Our results are fully independent on the validity of any metric gravity theory, the possible matter- energy contents filling the Universe, as well as on the SNe Ia Hubble diagram from which the presenting accelerating stage was inferred.
Keywords:
acceleration cosmic, Sunyaev-Zeldovich effect, galaxy clusters:
98.65.-r , 98.80.-k, 98.80.Es1 Introduction
One decade ago, observations from distant type Ia supernovae lead to a landmark conclusion: the universal expansion is speeding up and not slowing down as believed since the early days of observational cosmology riess98 ; perl99 . This phenomenon is normally interpreted as a dynamic influence of some sort of dark energy whose main effect is to change the sign of the universal decelerating parameter q(z)Padm03 . Another possibility is that the cosmic acceleration is a manifestation of new gravitational physics (rather than dark energy) that involves a modification of the left hand side (geometric sector) of the Einstein field equations. In this kind of theory the Friedmann equation is modified and a late time accelerating stage of the Universe is obtained even for a Universe filled only with cold dark matter (CDM). At present, the space parameter associated with the cosmic expansion is too degenerate, and as such, it is not possible to decode which mechanism or dark energy component is operating in the cosmic dynamics Padm03 ; FR .
SNe type Ia are not only the powerful standard candles available but still provides a unique direct access to the late time accelerating stage of the Universe. Naturally, this a rather uncomfortable situation from the observational and theoretical viewpoints even considering that ten years later, the main observational concerns about errors in SNe type Ia measurements, like host galaxy extinction, intrinsic evolution, possible selection bias in the low redshift sample seem to be under control Kowalski08 . A promising estimator fully independent of SNe type Ia and other calibrators of the cosmic distance ladder is the angular diameter distance (DA(z)) from a given set of distant objects. It has also been recognized that the combination of SZE and X-ray surface brightness measurements may provide useful angular diameters from galaxy clusters sunzel70 ; caval77 ; Birk99 ; SZEPapers2 ; Boname06 ; CML07 .
On the other hand, since the mechanism causing the acceleration is still unknown, it is interesting to investigate the potentialities of SZE/X-ray technique from a more general viewpoint, that is, independent of the gravity theory and the matter-energy contents filling the Universe. The better strategy available so far is to consider the same kind of kinematic approach which has been successfully applied for determining the transition deceleration/acceleration in the past by using SNe type Ia measurements TR02 ; Riess04 ; EM06 ; CL08 ; Cunha09 .
In this work, we employ a purely kinematic description of the universal expansion based on angular diameter distances of clusters for two different expansions of the deceleration parameter. As we shall see, by using the Bonamente et al. Boname06 sample we find that a kinematic analysis based uniquely on cluster data suggests that the Universe undergone a dynamic phase transition (deceleration/acceleration) in a redshift . Further, it is also shown that the Planck satellite mission data must provide very restrictive limits on the space parameter, thereby opening an alternative route for accessing the expansion history of the Universe.
2 Angular Diameter and Kinematic Approach
Let us now assume that the Universe is spatially flat as motivated by inflation and WMAP measurements Komat08 . In this case, the angular diameter distance in the FRW metric is defined by (in our units ),
| (1) | |||||
where is the Hubble parameter, and, , the deceleration parameter, is defined by
| (2) |
In the framework of a flat FRW metric, Eq. (1) is an exact expression for the angular diameter distance. As one may check, in the case of a linear two-parameter expansion for , the above integral can analytically be represented as
| (3) | |||||
where and are the values of and its redshift derivative, evaluated at while is an incomplete gamma AbrSte72 . By using the above expressions we may get information about , and, therefore, about the global behavior of . In principle, a dynamic “phase transition” (from decelerating to accelerating) happens at , or equivalently, . Another interesting parametrization is CL08 ; Cunha09 . It has the advantage to be well behaved at high redshift while the linear approach diverges at the distant past. Now, the integral (1) assumes the form:
| (4) | |||||
where now is the parameter yielding the total correction in the distant past () and is again the incomplete gamma function. Note that in this case the transition redshift is defined by .

3 SZE/X-ray Technique and Constraints
The SZE is a small distortion on the Cosmic Microwave Background (CMB) spectrum provoked by the inverse Compton scattering of the CMB photons passing through a population of hot electrons. This distortion is characterized by a low frequency ( GHz) decrement and higher frequency ( GHz) increment in the CMB intensity. The measured temperature decrement in the Raylegh- Jeans frequencies of the CMB is given by:
| (5) |
where is the temperature of the intra cluster medium (ICM), is the electron density, the Boltzmann constant, K is the temperature of the CMB, the Thompson cross section, the electron mass and accounts for frequency shift and relativistic corrections ( in our units). The integral is evaluated along the line of sight (l.o.s.).
The hot gas in galaxy clusters is also responsible for X-ray emission due to bremsstrahlung and line radiation resulting from electron-ion collisions. The X-Ray surface brightness is proportional to the integral along the line of sight of the square of the electron density:
| (6) |
where is the X-Ray cooling function of the ICM in the cluster rest frame and is the luminosity distance from the galaxy cluster. Observing the decrement of temperature of the CMB in the direction of galaxies clusters and also considering the X-rays observations, which are sensible to a different combination of the cluster electron density and the temperature , it is possible to break the degeneracy between concentration and temperature and to calculate the distance of angular diameter, yielding
| (7) |
where refers to a characteristic scale of the cluster along the l.o.s., whose exact meaning depends on the density model adopted. This technique for measuring distances is completely independent of other techniques and it can be used to measure distances at high redshifts directly.
Let us now consider the 38 measurements of angular diameter distances from galaxy clusters as obtained through SZE/X-ray method by Bonamente and coworkers Boname06 . The cluster plasma and dark matter distributions were analyzed using a hydrostatic equilibrium model (assuming spherical symmetry) that accounts for radial variations in density, temperature and abundance.
In our analysis we use a maximum likelihood determined by a statistics
| (8) |
where is the observational angular diameter distance, is the uncertainty in the individual distance, is the contribution of the statistical errors added in quadrature (%) and the complete set of parameters is given by . The common errors are: SZE point sources %, X-ray background%, Galactic NH , % for cluster asphericity, % kinetic SZ and for CMB anisotropy . When we combine the errors in quadrature, we find that the typical error are of %. The systematic effects will not considered in this preliminary analysis. Systematic contributions are: SZ calibration %, X-ray flux calibration %, radio halos % and x-ray temperatute calibration %. For the sake consistency, the Hubble parameter has been fixed by its best fit value .
3.1 Linear Parameterization:
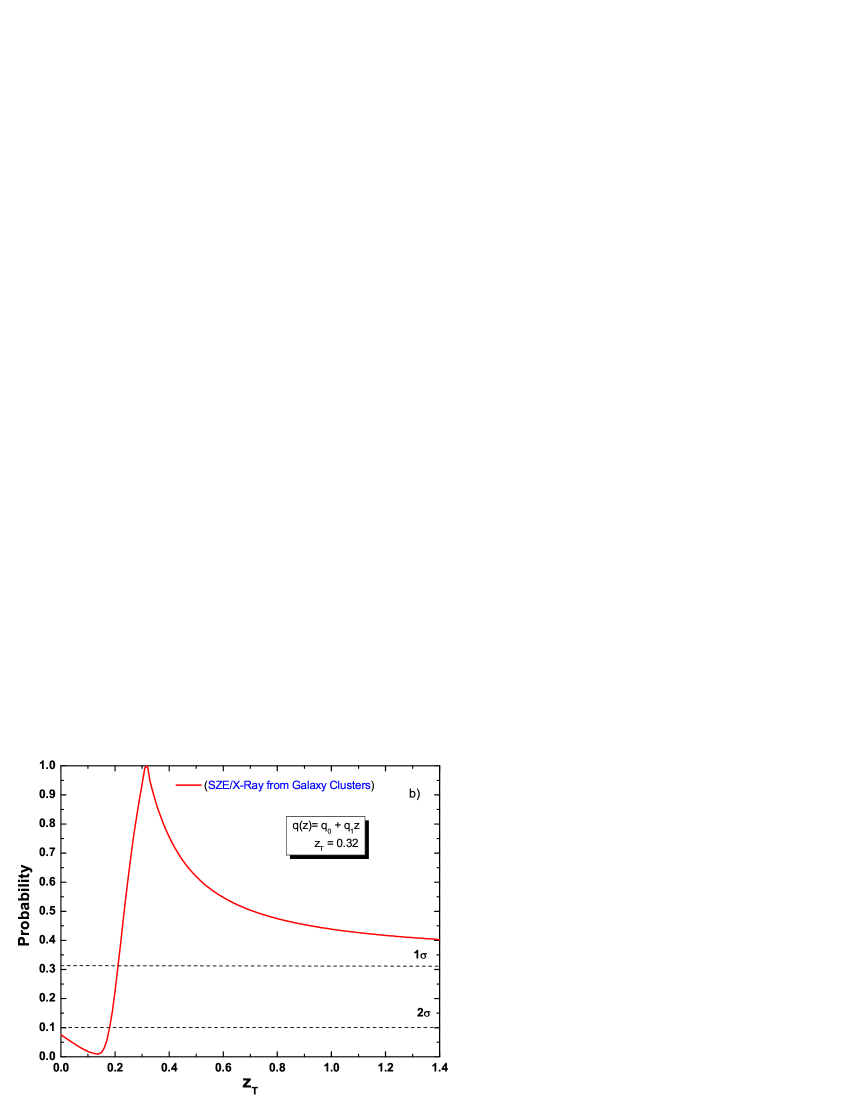
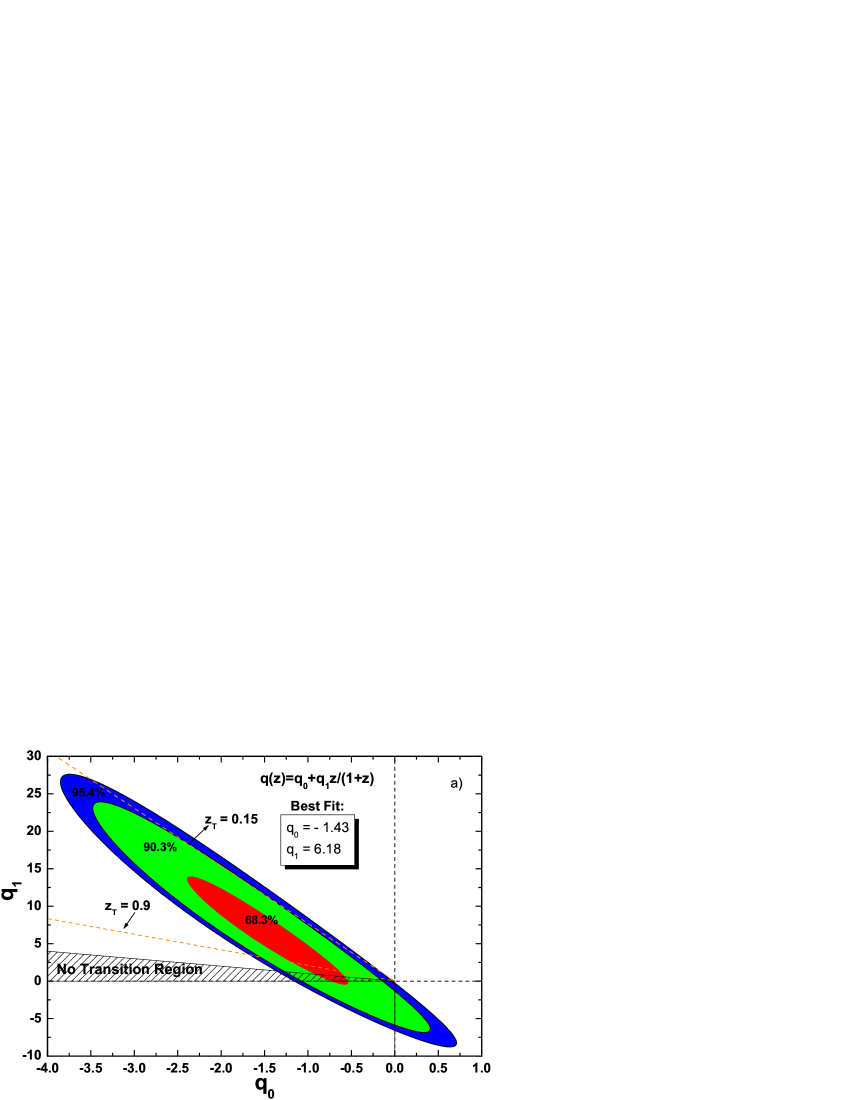
In Figs. 1(a) and 1(b) we show, respectively, the contour in the plane (, and c.l.) and likelihood of the transition redshift from the Bonamente et al. sample. The confidence region (1) are and . Such results favor a Universe with recent acceleration () and a previous decelerating stage (). From Fig. 1(a) we see that he best fits to the free parameters are while for the transition redshift is (see Fig. 1(b)). Note the presence of a forbidden region forming a trapezium. The horizontal line at the top is defined by , which leads to an infinite (positive or negative) transition redshift. Note also that the segment at defines the infinite future (). In addition, one may conclude that the vertical segment on the left closing the trapezium is also unphysical since it is associated , thereby demonstrating that the hatched trapezium is actually a physically forbidden region (for a similar analysis involving luminosity distance see CL08 ). For comparison we have also indicated in Fig. 1(a) the transition redshifts corresponding to a flat CDM with , as well as, corresponding to .
3.2 2nd Parameterization:
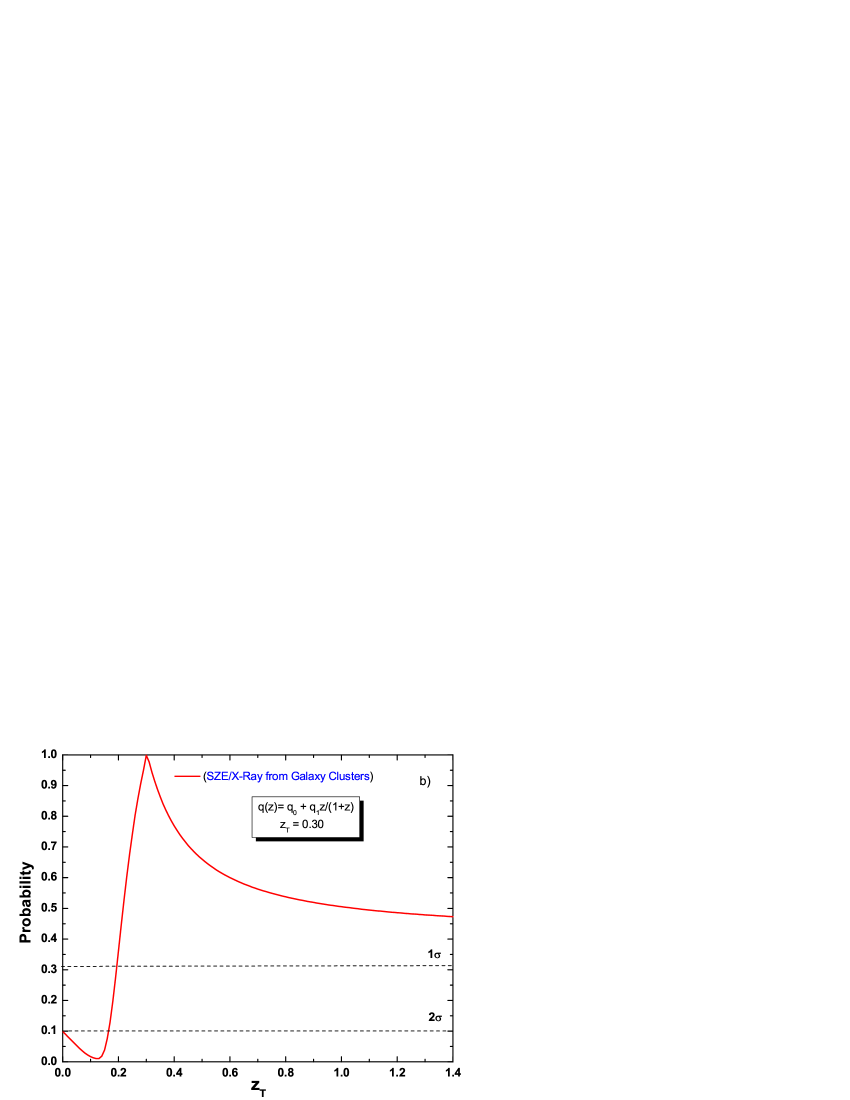
In Figures 2(a) and 2(b) we display the corresponding plots for the second parameterization. The confidence region (1) is now defined by: and . Such results also favor a Universe with recent acceleration () and a previous decelerating stage (). As indicated in Fig. 2(a), the best fits to the free parameters are and while for the transition redshift is a little smaller (see Fig. 1(b)). It should be noticed the presence of the forbidden region (trapezium) with a minor difference in comparison with Fig. 1(a), namely, as an effect of the parameterization, the horizontal line now is at the bottom. Note also that a decelerating Universe today () is only marginally compatible at of statistical confidence.
The results in the planes for both cases suggest that: (i) the Universe had an earlier decelerating stage ( for linear case and for 2nd parameterization), and (ii) the Universe has been accelerating () since . A similar result has been previously obtained using SNe type Ia as standard candles by Shapiro and TurnerTR02 .
4 Prospects for Planck Satellite Mission
Let us now discuss the potentiality of the SZE/X-ray technique when future data from Planck satellite mission become availableplanck . Planck satellite mission is a project from European Space Agency whose frequency channels were carefully chosen for measurements of thermal Sunyaev-Zeldovich effect. In principle, the Planck satellite will see (through SZE) about 30,000 galaxy clusters over the whole sky with significant fraction of clusters near or beyond redshift unity. However, since accurate angular diameter measurements require long SZE/X-ray integrations, we do not expect that all observed clusters might have useful distance measurements to constrain cosmological parameters. Therefore, it is interesting to simulate two realistic samples of angular diameter distances (ADD) by using a fiducial model to , where , and are the best fit values to the linear case obtained from Bonamente et al. sampleBoname06 .
Table 1
| range | Clusters | bins | Clusters/bin | Error |
|---|---|---|---|---|
| (P, O) | (P,O) | (P,O) | ||
| 100, 500 | 10 | 10, 50 | 15%, 10% | |
| 70, 350 | 10 | 7, 35 | 17%, 12% | |
| 40, 200 | 10 | 4, 20 | 20%, 15% |
The first simulation (termed pessimistic - P), assumes that only 210 clusters are distributed in the redshift ranges in the following form: (100), (70) and (40) with ADD statistical errors of , and , respectively (see Table 1). In the second one (optimistic case - O), 1050 clusters were redshift distributed as follows, (500), (350) and (200) with ADD statistical errors of , and , respectively. The redshift intervals were partitioned into bins () with the clusters distributed as shown in Table 1gol . Both simulations were carried out by marginalizing over the parameter in in Eqs. (1) and (5).
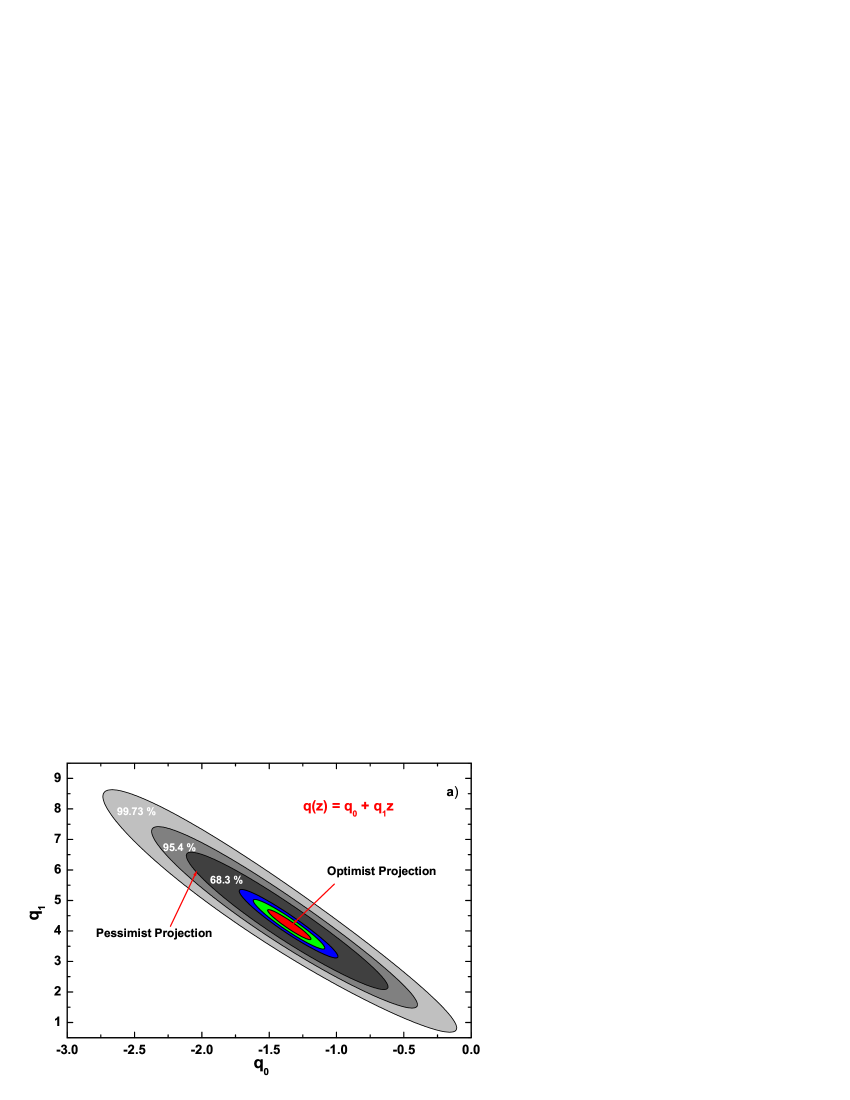
In Fig. 3 we display the results of our simulations for the linear parameterization. The contours correspond , and c.l. for the optimistic (colored inner contours) and pessimistic case (outer contours), respectively. Comparing with Fig. 1(a) we see that the allowed region was remarkably reduced even in the pessimistic case. This means that ADD from SZE/X-ray will become a potent tool for measuring cosmological parameters fully independent and competitive with SNe type Ia.

5 Conclusions
We have shown that the combination of Sunyaev-Zeldovich/X-ray data from galaxy clusters is an interesting technique for accessing the present accelerating stage of the Universe. This result follows from a new kinematic approach based on the angular diameter distance of galaxy clusters obtained from SZE/X-ray measurements. By using two different parameterizations, it was found the existence of a transition from a decelerating to an accelerating expansion was relatively recent ().
The ability of the future Planck satellite mission data to constrain the accelerating stage was discussed by simulating two realistic samples of angular diameters from clusters. The allowed regions in space parameter was significantly constrained for both the pessimistic and optimist simulations (Figure 3). The limits on the transition redshift derived here reinforces the extreme interest on the observational search for the combination of Sunyaev-Zeldovich and X-ray surface brightness from galaxy clusters.
Finally, it should also be stressed that the present results depends neither on the validity of general relativity nor the matter-energy contents of the Universe and, perhaps, more important, it is also independent from SNe type Ia observations.
References
- (1) A. G. Riess et al., Astron. J. 116, 1009-1038 (1998).
- (2) S. Perlmutter et al., Astrophys. J. 517, 565-586 (1999).
- (3) T. Padmanabhan, Phys. Rep. 380, 235-320 (2003); P. J. E. Peebles and B. Ratra, Rev. Mod. Phys. 75, 559-606 (2003); J. A. S. Lima, Braz. J. Phys. 34, 194-200 (2004); E. J. Copeland, M. Sami and S. Tsujikawa, Int. J. Mod. Phys. D 15,1753-1935 (2006); J. A. Frieman, M. S. Turner and D. Huterer, Ann. Rev. Astron. & Astrophys. 46, 385-432 (2008).
- (4) L. Amendola, David Polarski and Shinji Tsujikawa, Phys. Rev. Lett. 98, 131302-1 a 131302-4 (2007); T. P. Sotiriou and V. Faraoni, Classical and Quantum Gravity 25, 205002-205018 (2008).
- (5) M. Kowalski et al., Astrophys. J. 686, 749-778 (2008).
- (6) R. A. Sunyaev and Ya. B. Zel’dovich, Astrophys. Space Sci. 7, 20-30 (1970); R. A. Sunyaev and Ya. B. Zel’dovich, Comments Astrophys. Space Phys. 4, 173-178 (1972).
- (7) A. Cavaliere, L. Danese and G. De Zotti, Astrophys. J. 217, 6-15 (1977); A. Cavaliere and R. Fusco-Fermiano, Astron. Astrophys., 70, 677-684 (1978); M. Birkinshaw, Mon. Not. R. Astron. Soc. 187, 847-862 (1979).
- (8) M. Birkinshaw, Phys. Rep. 310, 97-195 (1999).
- (9) J. G. Bartlett and J. Silk, Astrophys. J. 423, 12-18 (1994); J. E. Carlstrom, G. P. Holder and E. D. Reese, ARAA 40, 643-680 (2002); E. D. Reese et al., Astrophys. J. 581, 53-85 (2002); M. E. Jones et al., MNRAS 357, 518 (2002).
- (10) M. Bonamente et al., Astrophys. J. 647, 25-54 (2006).
- (11) J. V. Cunha, L. Marassi and J. A. S. Lima, MNRAS 379, L1-L5 (2007), [astro-ph/0611934].
- (12) M. S. Turner and A. G. Riess, Astrophys. J. 569, 18-22 (2002); C. Shapiro and M. S. Turner, Astrophys. J. 649, 563-569 (2006).
- (13) A. G. Riess et al., Astrophys. J. 607, 665-687 (2004).
- (14) Elgarøy, Ø., & Multamäki, T., JCAP 9, 2-12 (2006) ; A. G. C. Guimaraes, J. V. Cunha and J. A. S. Lima, JCAP 10, (2009) arXiv:0904.3550v1.
- (15) J. V. Cunha and J. A. S. Lima, MNRAS 390, 210-217 (2008), [arXiv:0805.1261].
- (16) L. Xu, C. Zhang, B. Chang and H. Liu, Mod. Phys. Let. A 23, 1939-1948 (2007); J. V. Cunha, Phys. Rev. D 79, 047301 (2009).
- (17) E. Komatsu et al., Astrophys. J. Suppl. 180, 330-376 (2009).
- (18) M. Abramowitz and I. A. Stegun, Handbook of Mathematical Functions, Dover Publications (1972).
- (19) The Scientific Programme of Planck, the Planck Collaboration, arXiv:astro-ph/0604069.
- (20) M. Goliath, R. Amanullah, P. Astier, A. Goobar and R. Pain, Astron. Astrophys. 380, 6-18 (2001).