HerMES: Herschel-SPIRE observations of Lyman Break Galaxies
Abstract
We present first results of a study of the submillimetre (rest frame far-infrared) properties of 3 Lyman Break Galaxies (LBGs) and their lower-redshift counterparts BXBM galaxies, based on Herschel-SPIRE observations of the Northern field of the Great Observatories Origins Deep Survey (GOODS-N). We use stacking analysis to determine the properties of LBGs well below the current limit of the survey. Although LBGs are not detected individually, stacking the infrared luminous LBGs (those detected with Spitzer at 24 m) yields a statistically significant submm detection with mean flux = 5.91.4 mJy confirming the power of SPIRE in detecting UV-selected high-redshift galaxies at submillimetre wavelengths. In comparison, the Spitzer 24 m detected BXBM galaxies appear fainter with a stacked value of = 2.70.8 mJy. By fitting the Spectral Energy Distributions (SEDs) we derive median infrared luminosities, , of 2.81012L⊙ and 1.51011L⊙ for 3 LBGs and BXBMs, respectively. We find that estimates derived from present measurements are in good agreement with those based on UV data for z2 BXBM galaxies, unlike the case for 3 infrared luminous LBGs where the UV underestimates the true . Although sample selection effects may influence this result we suggest that differences in physical properties (such as morphologies, dust distribution and extent of star-forming regions) between 3 LBGs and z2 BXBMs may also play a significant role.
keywords:
Galaxies: high redshift –galaxies: starburst –submillimetre1 Introduction
The broadband dropout technique has been a very succesful tool for discovering high-redshift galaxies, the so-called Lyman break galaxies (LBGs, e.g. Steidel & Hamilton 1993, Steidel et al. 1999). The initial selection focused on 3 samples. The same colour criteria were later extended to select Lyman break galaxies at 1.4z2.5 (the so called BXBM objects) with approximately the same range of UV luminosity and intrinsic UV colours as the 3 LBGs (Reddy et al. 2006). The dropout broadband technique provides a complete census of UV light at high redshift, with well over a thousand galaxies detected at z1.5. Recent detailed studies including Spitzer observations have shown that some of these galaxies have large stellar masses 1010M⊙ (e.g. Rigopoulou et al. 2006, Reddy et al. 2006, Magdis et al. 2008, 2010a) while their comoving volume density at 3 is 0.005 Mpc-3 (e.g. Reddy & Steidel 2009).
A number of issues related to the nature and properties of 3 LBGs remain unclear. The dust-corrected star formation rate (SFR) of LBGs can be as high as 100 M⊙/yr, which would correspond to 1mJy depending on specific dust parameters (Chapman et al. 2009). However, the search for the sub-millimetre (submm) counterparts of LBGs has proven challenging due to uncertainties in the relations used to predict the rest-frame far-infrared luminosity from the UV. Peacock et al. (2000) analysed the submm emission from star forming galaxies with the highest UV star-formation rates and found that they were statistically detected with a flux density S850=0.2 mJy for a star formation rate of 1 h-2 M. Chapman et al. (2000, 2009) reported the submm detection of Westphal MMD-11 and Westphal-MM8, while Rigopoulou et al. (2010) reported mm detections of a further two LBGs, EGS-D49 and EGS-M28 selected based on their strong MIPS 24 m emission (e.g. Huang et al. 2005). Despite these promising detections the properties of the FIR and submm emission from LBGs, their dust content and their possible contribution to the cosmic far-infrared background is still largely unconstrained.
With the advent of Herschel (Pilbratt et al. 2010) it is now possible to investigate the submm (rest-frame far-infrared) properties of LBGs. In this letter we report first results on the far-infrared properties of LBGs based on observations that are part of the Herschel Multi-tiered Extragalactic Survey (HerMES), a Guaranteed Time project that will eventually result in a variety of surveys of varying depth and area which will be covered in five photometric bands (110, 160, 250, 350, 500 m; Oliver et al. 2010). The results presented here are based on HerMES data taken as part of the Herschel Science Demonstration Phase. Throughout this paper we assume = 0.3, =0.72 and H0 = 72 km s-1 Mpc-1.
2 Observations, Sample Selection and Analysis
2.1 Herschel Observations
Submm observations of the Northern field of the Great Observatories Origins Deep Survey (GOODS-N) were carried out at 250, 350 and 500 m, with the Spectral and Photometric Imaging Receiver (SPIRE). The instrument and its capabilities are described in Griffin et al. (2010), while the SPIRE astronomical calibration methods and accuracy are outlined in Swinyard et al. (2010). The GOODS-N images are amongst the deepest possible with SPIRE and, the instrumental noise is less than the confusion noise from overlapping faint sources. Confusion noise values of 5.8, 6.3 and 6.8 mJy beam-1 at 250, 350 and 500 m respectively, are reported in Ngyuen et al. (2010). Besides blind source extraction resulting in single-band catalogues (SCAT, see Smith et al. 2010, in prep.), a novel source extraction method based on 24 m priors has been developed to detect sources as close as possible to the confusion limit (see Roseboom et al. 2010, hereafter XID catalogue). The method uses a matrix inversion technique which relies on the assumption that sources detected in the 250 m band will also be detected at 24 m deep surveys (e.g. Marsden et al. 2009). The 24 m catalogue positions are then used to find sources in the Herschel 250 m images. The flux densities of the sources are allowed to vary until finally a set of flux densities is found that produce the best match to the image. In the current study we have made use of both blind (SCAT) and 24 m prior source catalogues (XID), while for the stacking analysis we have used calibrated GOODS-N SPIRE images.
2.2 Sample Selection and Analysis
The GOODS-N region contains 58 UV selected 3 LBGs (Steidel et al. 2003) and 212 UV selected BXBM objects (Reddy et al. 2006) down to 25.5. 49 LBGs and 200 BXBMs have been detected with the Spitzer Infrared Array Camera (IRAC, (down to 25.0 mag(AB) at 3.6 m) and 9 LBGs and 69 BXBMs have also been detected with the Multi Imager Photometer for Spitzer (MIPS, down to =20 Jy, 5). In the current study we investigate the submm properties of the UV selected LBGs and BXBMs focusing particularly on the sub-sample with MIPS detections: 9 3 LBGs and 69 1.52.5 BXBM (hereafter the MIPS-LBG and MIPS-BXBM samples). All LBG and BXBM galaxies have spectroscopic redshifts determined from optical spectroscopy (Steidel et al. 2003, Reddy et al. 2006) which has also been used to confirm the absence of strong high ionization emission lines indicative of the presence of AGN. Objects classified as AGNQSO are excluded from this study.
The LBG and BXBM samples were matched to the blind (SCAT) and priors (XID) catalogues. An object is considered detected when its flux is at least 3 above the noise (confusion plus instrumental). None of the LBGs and only three of the BXBM objects are detected in the HerMES GOODS-N priors catalogue down to 20 mJy. We discuss the properties of individual sources in section 2.3.
To assess the reliability of SPIRE detections at faint flux levels (20 mJy) close to the confusion limit we first look at the flux distribution (per pixel) of the whole GOODS-N map. For the present discussion we focus on the 250 m band which is the most sensitive and has the smallest beamsize (18′′). We find that the fraction of pixels above 5, 10 and 20 mJy is 6, 4 and 0.6 percent, respectively. These percentages imply that 16(4.5), 10(3) and 1.5(0.23) sources out of the 270(78) sources studied here could be associated with spurious detections at 5, 10 and 20 mJy. The number in parentheses correspond to the MIPS detected objects.
Since none of the LBGs and only three of the BXBMs are detected individually, we examine the properties of the two samples via stacking analysis. We measure flux densities directly from the calibrated GOODS-N SPIRE 250, 350 and 500 m images (at the optical positions of the LBGs and BXBMs). For the stacking we first consider the optically-selected LBG and BXBM samples. For the analysis we employ median stacking and stack at the optical position for each object. We exclude sources near bright objects (within 18′′ at 250 m) to avoid contamination of the measured signal. Stacking the UV selected samples returned no detections in any of the three SPIRE bands. For the LBGs we determine 3 upper limits of 2.8 mJy, 1.5mJy and 0.9mJy. For the BXBMs the corresponding (3) upper limits are 2.02 mJy, 1.2mJy and 0.6mJy, respectively.
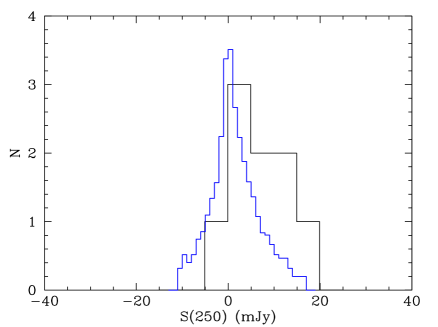
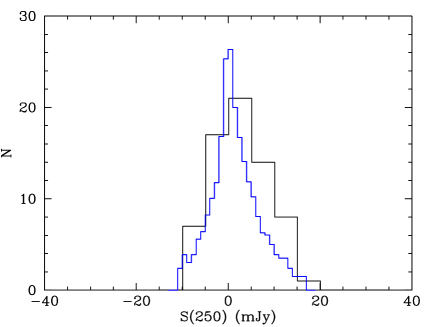
The same stacking technique was employed to investigate the properties of the MIPS detected LBGs and BXBMs. In Figure 1 we show the histograms of the 250 m flux density distributions for the MIPS-LBGS and MIPS-BXBMs. In the same plot, we show the normalised distribution of flux densities per pixel for the whole GOODS-N image. In both cases the distributions have positive skews and in the case of LBGs there is a clear positive tail implying that pixels containing flux from the LBGs have higher flux than the average pixel in the map. The case for the BXBMs is not as clear. Although the BXBM sample is bigger (69 objects vs 9) the population as a whole does not appear to strongly emit in the submm. In order to confirm that the two distributions are in fact different, we carry out a K-S two-sample test. The test results, D= 0.31 and (probability) (D) = 0.03, suggest that the two flux density distributions are intrinsically different at the 2 level. The mean flux densities are = 5.91.4 mJy (LBG) and =2.70.8 mJy (BXBM). The errors reported in these measurements have been quantified by stacking at 9 (for the LBGs) and 69 (for the BXBMs) random positions and then repeating the process 40,000 times. The 1 value of the derived distribution is adopted as the uncertainty of the measurement. Stacking at 350 and 500 m resulted in no formal detections. Instead we quote 3 upper limits of 4.9 mJy and 3.4 mJy for the MIPS-LBGs and 2.6 mJy and 1.6mJy for the MIPS-BXBMs, respectively.
A likely physical explanation for this difference in detection rates comes from the MIR properties of the two samples. For 3 LBGs the MIPS 24m band contains contributions from 6m (hot) dust continuum plus the 6.2 m emission from Polycyclic Aromatic Hydrocarbons (PAHs). The PAH contribution to the MIPS 24m flux is 20–30 percent (e.g. Huang et al. 2005), therefore, the MIPS 24 m flux mostly reflects the strength of the underlying continuum. Thus, the MIPS detected LBGs (with the strongest 6 m continuum) are likely to be amongst the most luminous 3 LBGs. For z2 BXBMs the MIPS 24m band includes contributions from both the 7.7m PAH feature and the underlying continuum. However, z2 galaxy populations show a wide variety in their rest-frame luminosity, with BXBMs, in particular showing a relatively weak MIR continuum (Reddy 2006b). PAHs in BXBMs, might be instrinsically weak since metallicity is known to affect their strength (Houck et al. 2005). The combination of low MIR continuum plus weaker PAH features may be responsible for the low detection rate in the submm of 24 m selected BXBMs. We thus conclude that, 3 LBGs detected by MIPS are likely to be on average more luminous than MIPS detected 2 BXBMs.
2.3 Individual detections
In the previous section we examined the average submm properties of LBGs and BXBMs here we take a closer look at individual detections, focusing on objects with MIPS detections. As discussed in section 2.1 of the 69 MIPS-BXBM objects, 3 are detected with 20mJy and SN 3 however, two of those, BX1296 and BX1223 lie close (within 3′′) to bright submm galaxies, BX1296 to GN07 and BX1223 to GN06 (the notation is from Pope et al. 2005). These confused cases have not been considered in this work. BM1326 is clearly detected, with =225 mJy while a further 3 BXBMs appear in the 250 SPIRE map (and prior-based catalogue) but with 250 m flux densities 10 mJy. Additionally, 2 (of the 9) LBGs, HDFN-M18 and HDFN-M23 appear to be present in the maps (and prior-based catalogue) although with fluxes below the 10mJy level. We note that, HDFN-M23 is included in the 5 radio catalogue of Morrison et al. (2010), with a flux density 21.24 Jy.
3 Results
3.1 Spectral Energy Distributions of LBGs
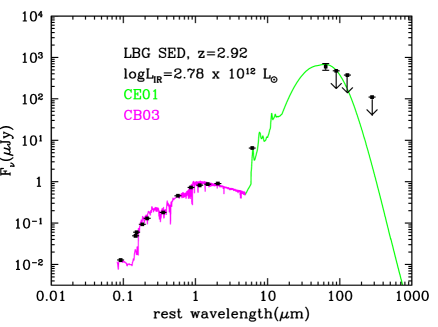
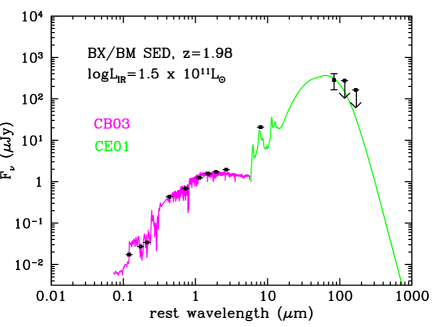
Fig. 2 shows the average Spectral Energy Distribution (SED) of MIPS-detected LBGs and BXBM galaxies. The SEDs have been constructed using available ‘averaged’ UGRViJK, IRAC, MIPS and SPIRE flux measurements. For the MIPS-LBGs we also use the 1.1 mm Aztec measurement from Magdis et al (2010b). We fit the opticalnear-infrared part with model SEDs generated using the Bruzual & Charlot (2003, BC03) code, while the mid-to-far infrared part is fit using Chary & Elbaz (2001, CE01) template SEDs. In brief, we use BC03 and construct stellar population models with a Salpeter IMF and constant star formation rate, which has been shown (van Dokkum et al. 2004, Rigopoulou et al. 2006, Lai et al. 2007) to provide an adequate description of the properties of high redshift galaxies with ongoing star formation. Age, stellar mass, dust reddening E(B-V) and star formation rates are then derived from the model fits. It is beyond the scope of the present work to discuss these results, a detailed analysis of the properties of the stellar population in Spitzer detected LBGs can be found in e.g. Rigopoulou et al. (2006), Magdis et al. (2010a, for LBGs) and Reddy et al. (2006, for BXBMs). It is however, worth noting the differences in the optical part of the SED with the BXBM galaxies showing a much ‘bluer’ SED.
We fit the far-IRsubmm part with templates from the CE01 library, with the best-fit templates rendering mean values of 2.8(0.6) L⊙ for MIPS-LBGs and 1.5(0.5) L⊙ for MIPS-BXBMs. The derived averaged for LBGs is typical of those seen in Ultraluminous Infrared Galaxies (ULIRGs). Using the infrared luminosities we derive average Star Formation Rates of 296Myr and 245Myr, for the 3 LBGs and BXBM galaxies, respectively. The SFR derived from the IR for LBGs is in agreement with the radio SFR estimate (28085M⊙ yr-1) but higher than the UV SFR estimate (250 M⊙ yr-1) reported in Magdis et al (2010b). Turning to the BXBM galaxies, the present SFR estimates agree well with those derived from the UV (Reddy et al. 2006) for UGR-selected galaxies.
3.2 Dust, temperature and mass
To derive the dust temperature, we use a single temperature greybody fitting function (Hildebrand 1983) in which the thermal dust spectrum is approximated by: , where is the Planck function, is the dust emissivity (with 12) and, is the effective dust temperature. For 1 the spectrum becomes :
| (1) |
Since Td and are degenerate for sparsely sampled SEDs we have fixed = 1.5 (e.g. Blain et al. 2003) which is consistent with SED fitting of low and high-z systems (e.g. Dunne et al. 2001). A higher value of will result in lower dust temperatures (Sajina et al. 2006). The dust temperature for BM1326, was obtained from the best fit model derived from minimization of the values. The uncertainty in the measurement was obtained by repeating the procedure based on perturbed values of the photometric points within their errors.

To derive dust masses we follow:
| (2) |
where is the total dust mass, the observed flux density, luminosity distance, ) is the rest frame dust mass absorption coefficient (taken from Weingartner & Draine 2001) and B is the Planck function. For the 3 LBGs we assume = 45 K, a value chosen from estimates for local ULIRGs (Lisenfeld, Isaak, Hills et al. 1997) since the average MIPS-LBG appears to have L 1012L⊙. We derive dust masses of =5.51.6108 M⊙ and =12.82.3108 M⊙ for the LBGs and for BM1326, respectively.
4 Dust obscuration in UV selected galaxies
The present SPIRE observations allow us to probe the cold dust peak of LBGs, determine their far-IR luminosity, dust temperature and dust mass from the far-IR alone with minimal additional assumptions. Earlier attempts to detect submm emission from LBGs (with targets selected mostly based on SFR(UV) estimates) were not met with success (e.g. Chapman et al. 2000, Peacock et al. 2000). These initial results led to suggestions that either is high (90 K) or, that estimates of from the rest-frame UV andor from the scatter in the UV-slope/far-IR relation are uncertain (e.g. Chapman et al 2000). Recently, Rigopoulou et al. (2010) reported 1.2 mm detections of 2 LBGs in the Extended Groth Strip (EGS), both are detected in the MIPS 24 m imaging survey of the EGS (for the full SEDs see Rigopoulou et al 2006). Briefly, their properties are similar to those of the GOODS-N 3 LBGs with in the 50–100 Jy range. Using CE01 models we infer infrared luminosities, L few1012 L⊙ for each of these LBGs.
Let us now focus on the MIPS-detected LBGs and BXBMs using the mean LBG properties reported in section 3.1 and compare values from the SPIRE data to those derived from the UV. LIR,UV is determined as follows: at 3, G and R bands correspond to rest-frame 1200 Å and 1500 Å, respectively, thus alowing us to estimate the slope . Assuming solar metallicity, Salpeter IMF and continuous dust-free star formation models we use the BC03 code to generate SEDs to fit each of the LBGs, assuming the Calzetti (2000) attenuation law (but see also Buat et al. 2010 for a discussion of alternative extinction laws). Based on the best-fit model we derive extinction values E(B-V) and infer the observed and intrinsic 1500 Å flux density and subsequently, luminosity. We repeat the same process for the two galaxies with mm detections and the z2 mean BXBM galaxies (using the B band flux density to estimate the intrinsic luminosity).
The results are plotted in Fig. 4.
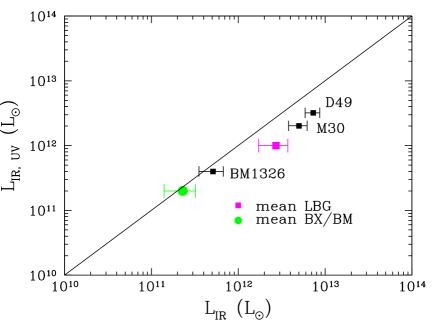
The UV appears to underestimate the of both the averaged 3 LBG (and the two LBGs with additional mm detections) by a factor 2. This is perhaps not surprising given that the LBGs that appear to be detected in the submm regime are all ULIRGs. It is known that the UV underpredicts the for both local ULIRGs (e.g. Howell et al. 2010) and z2 submm-luminous galaxies. On the other hand, it appears that the UV provides a better estimate (closer to the measured ) for the averaged BXBMs.
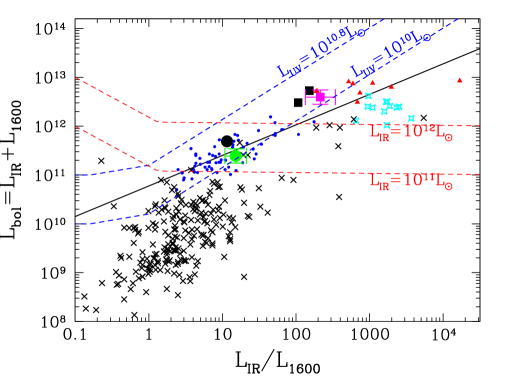
Finally, it is instructive to look at variations of the obscuration of these UV-selected galaxies. For this purpose we examine the bolometric luminosity (defined as the sum of the IR and UV luminosities) as a function of obscuration (approximated by the ratio of IR-to-UV luminosity) for LBGs and BXBMs. For comparison we include submm-luminous and UGR-selected 2 galaxies (from Reddy et al. 2006 and references therein). The resulting plot is shown in Fig. 5. The straight line indicates the correlation found by Reddy et al. (2006, 2010) for 2 UGR-selected galaxies. The averaged 3 LBG and the two individually detected ones appear to follow the relation defined for the z2 galaxies. In terms of luminosities, both averaged LBGs and BXBMs have similar (few 10) but LBGs have higher and thus higher ratio. Since it is well established that obscuration decreases with increasing redshift (Reddy et al. 2006, 2010, Adelberger and Steidel 2000), the difference in the ratio must be attributed to different causes. While selection effects are likely to play a role (see section 2.2) we argue that possible differences in morphologies, dust distribution and extent of star-forming regions are also likely to contribute. Morphological studies of UV-selected 2 and z3 galaxies in the GOODS-N field find few differences between the two samples (Law et al. 2007) although, dustier galaxies (as evidenced by E(B-V)) were found to show more nebulous UV morphologies. Finally, since MIPS-detected LBGs have ULIRG-like luminosities (section 3.1) it is possible that their UV and IR emission originates in different regions (as observed in local ULIRGs e.g. Wang et al 2004, see also Huang et al. 2007) and thus could account for the higher ratio observed.
Acknowledgments
SPIRE has been developed by a consortium of institutes led by Cardiff Univ. (UK) and including Univ. Lethbridge (Canada); NAOC (China); CEA, LAM (France); IFSI, Univ. Padua (Italy); IAC (Spain); Stockholm Observatory (Sweden); Imperial College London, RAL, UCL-MSSL, UKATC, Univ. Sussex (UK); Caltech, JPL, NHSC, Univ. Colorado (USA). This development has been supported by national funding agencies: CSA (Canada); NAOC (China); CEA, CNES, CNRS (France); ASI (Italy); MCINN (Spain); SNSB (Sweden); STFC (UK); and NASA (USA). The data presented in this paper will be released through the Herschel Database in Marseille HeDaM (hedam.oamp.frHerMES)
References
- Bruzual & Charlot (2003) Bruzual, G., Charlot, S., 2003, MNRAS 344, 1000
- Chapman et al. (2009) Chapman, S.C., Casey, C.C., 2009, MNRAS, 398, 1615
- Chapman et al. (2000) Chapman, S.C., Scott, D., Steidel, C.C., Borys, C., Halpern, M., et al., 2000, MNRAS, 319, 318
- Chary & Elbaz (2001) Chary, R.-R., Elbaz, D., 2001, ApJ 556, 562
- Dale & Helou (2002) Dale, A., Helou, G.G., 2002, ApJ 576, 152
- Dunne (2001) Dunne, L., et al., 2001, MNRAS 327, 697
- Foerster (2006) Foerster Schreiber, N.M.,Genzel, R., Lehnert, M. D., et al. 2006, ApJ 646, 1062
- Giavalisco (2001) Giavalisco, M., Dickinson, M., 2001, ApJ 55, 177
- Griffin et al. (2010) Griffin, M.M., et al., 2010, A&A in press
- Hildebrand (1983) Hildebrand et al., 1983, QJRAS 24, 267
- Houck (2005) Houck, J.R., Soifer, B.T., Weedman, D., Higdon, S.J.U., Higdon,J.L., et al., 2005, ApJ 622 105
- Howell (2010) Howell, J.H., Armus, L., Mazzarella, J.M., Evans, A.S., Surace, J.., et al., 2010, ApJ 715, 572
- Huang (2005) Huang, J-S., Rigopoulou, D., Papovich, C., et al., 2007, ApJL 660, 69
- Magdisb (2010b) Magdis, G., Elbaz, D., Daddi, E., et al., 2010b, ApJ 714, 1740
- Magdisa (2010) Magdis, G., Rigopoulou, D., Huang, J-S., Fazio, G.G., 2010a, MNRAS 401, 521
- Magdis (2008) Magdis, G., Rigopoulou, D., Huang, J-S., et al., 2008, MNRAS, 386, 11
- Magnelli et al. (2009) Magnelli, B., et al., 2009, A&A 496, 57
- Marsden (2009) Marsden, G., Ade, P.A.R., Bock, J.J., Chapin, E.L., Devlin, M.J., et al., 2009, ApJ 707, 1729
- Morrison (2010) Morrison, G.E., Owen, F. N., Dickinson, M., Ivison, R.J., Ibar, E., 2010, ApJS 188, 178
- Oliver et al. (2010) Oliver, S.J., et al., 2010, A&A in press
- Peacock et al. (2000) Peacock, J., Rowan-Robinson, M., Blain, A.W., Dunlop, J.S., Efstathiou, A. et al., 2000, MNRAS 318, 535
- Pillbrat et al. (2010) Pillbrat, G., et al., 2010, A&A in press
- Law et al. (2007) Law, D. R., Steidel, C.C., Erb, D. K., et al. 2007, ApJ 656, 1.
- Reddy et al. (2010) Reddy, N.A., Erb, D.K., Pettini, M., Steidel, C.C., Shapley, A.E., 2010, 712, 1070
- Reddy (2009) Reddy, N., Steidel, C.C., 2009, ApJ 692, 778
- Reddy et al. (2006) Reddy, N.A., Steidel, C.C., Erb, D.K., Shapley, A.E., Pettini, M. 2006, ApJ 644, 792
- Rigopoulou (2006) Rigopoulou, D., Huang, J-S., Papovich, C., et al., 2006, ApJ 648, 81
- Rigopouloub (2010) Rigopoulou, D., Magdis, G., Alonso-Herrero, A., et al., 2010, MNRAS, submitted
- Roseboom (2010) Roseboom, I., et al., 2010, MNRAS, submitted
- Sajina (2006) Sajina, A., Scott, D., Dennefeld, M., Dole, H., Lacy, M., Lagache, G., 2006, MNRAS, 269, 939
- Swinyard (2010) Swinyard, B.M., et al., 2010, A&A in press ApJ 582, 6