11email: bparise@mpifr.de
Extended emission of D2H+ in a prestellar core††thanks: Based on observations with the APEX telescope. APEX is a collaboration between the Max-Planck-Institut für Radioastronomie, the European Southern Observatory, and the Onsala Space Observatory
Abstract
Context. In the last years, the H2D+ and D2H+ molecules have gained great attention as probes of cold and depleted dense molecular cloud cores. These ions are at the basis of molecular deuterium fractionation, a common characteristic observed in star forming regions. H2D+ is now routinely observed, but the search for its isotopologue D2H+ is still difficult because of the high frequency of its ground para transition (692 GHz).
Aims. We have observed molecular transitions of H2D+ and D2H+ in a cold prestellar core to characterize the roots of deuterium chemistry.
Methods. Thanks to the sensitive multi-pixel CHAMP+ receiver on the APEX telescope where the required excellent weather conditions are met, we not only successfully detect D2H+ in the H-MM1 prestellar core located in the L1688 cloud, but also obtain information on the spatial extent of its emission. We also detect H2D+ at 372 GHz in the same source. We analyse these detections using a non-LTE radiative transfer code and a state-of-the-art spin-dependent chemical model.
Results. This observation is the first secure detection of D2H+ in space. The emission is moreover extended over several pixels of the CHAMP+ array, i.e. on a scale of at least 40′′, corresponding to 4800 AU. We derive column densities on the order of 1012 – 1013 cm-2 for both molecules in the LTE approximation depending on the assumed temperature, and up to two orders of magnitude higher based on a non-LTE analysis.
Conclusions. Our modeling suggests that the level of CO depletion must be extremely high (10, and even 100 if the temperature of the core is around 10 K) at the core center, in contradiction with CO depletion levels directly measured in other cores. Observation of the H2D+ spatial distribution and direct measurement of the CO depletion in H-MM1 will be essential to confirm if present chemical models investigating the basis of deuterium fractionation of molecules need to be revised.
Key Words.:
deuterium astrochemistry – prestellar core – depletion – submm observations1 Introduction
Although deuterium is a trace element (D/H 10-5), the study of deuterium fractionation in molecules is a very vivid field of research. The main astrochemical interest derives from the fact that the understanding of fractionation processes may ultimately help to understand the formation of the related hydrogenated species. As an example, the first detection of a doubly-deuterated molecule, D2CO, by Turner (1990) was interpreted as the hint that grain chemistry may be at work for synthesizing formaldehyde. However, the impact of deuterium fractionation studies rapidly outpassed the mere astrochemical interest. Since deuterated molecules are formed preferentially at low temperatures and high densities, they became valuable probes for studying, e.g., the kinematics of cold cloud cores harbouring the earliest stages of star formation (van der Tak et al., 2005).
The basic process transferring deuterium from the HD molecule to other molecules is through ion-molecule reactions involving H, CH, and C2H (see Parise et al., 2009, and references therein). The route involving H is the dominant one at very low temperatures ( 20 K), whereas the importance of CH takes over at slightly higher temperatures (20 40 K) due to its higher endothermicity (Turner, 2001; Roueff et al., 2007; Parise et al., 2009). H2D+ is thus a very good probe of very cold objects, and has been extensively used in the last years to probe gas in which CO is strongly depleted, i.e., frozen out on dust grain surfaces (e.g. Caselli et al., 2003). The deuteration level is also a decisive argument in the study of the evolutionary state of early phases of star formation. The deuterium fractionation is believed to decrease once the central protostar starts to heat its envelope (e. g., Emprechtinger et al., 2009). For instance, partly based on molecular deuteration, Belloche et al. (2006) concluded that the dense core Cha-MMS1 in the Chamaeleon I molecular cloud is likely at the stage of the first hydrostatic core when H2 has not been dissociated yet.
The study of several isotopologues of methanol toward the low-mass protostar IRAS16293-2422 (Parise et al., 2002, 2004) showed that grain chemistry models require a very high atomic D/H ratio accreting on the grains in order to explain the high CHD2OH and CD3OH abundances. At the time, gas-phase models could not reproduce such a high atomic D/H ratio, but a decisive step forward was done with the inclusion of D2H+ and D in the reaction networks (Roberts et al., 2003). Since then, D2H+ was searched for through observation of its ground para state line. The frequency of this line was initially published to be 691.660440 GHz ( 19 kHz (1), Hirao & Amano, 2003) and was later revised to 691.660483 GHz ( 20 kHz (1), Amano & Hirao, 2005). These astronomical searches are extremely difficult because of the high frequency of the molecular line, for which excellent instruments and weather conditions are required. Using the Caltech Submillimeter Observatory 10.4 m telescope (CSO), Vastel et al. (2004) detected a 3.3 line (in peak) toward the Ophiuchus dense core 16293E (4.4 in integrated intensity). This detection is to date the only published one, and its low signal-to-noise ratio as well as the velocity shift between H2D+ and D2H+ (0.23 km s-1 after remeasurement of o-H2D+ and p-D2H+ frequencies, Amano & Hirao, 2005) certainly require a confirmation of the detection by improving the observation sensitivity and frequency calibration precision (which was 0.1 km s-1 in the observations of Vastel et al. (2004)). We present here the first secure detection of D2H+ toward the prestellar core H-MM1 in L1688, the main molecular cloud in the Ophiuchus star forming region.
2 Observations
2.1 The source
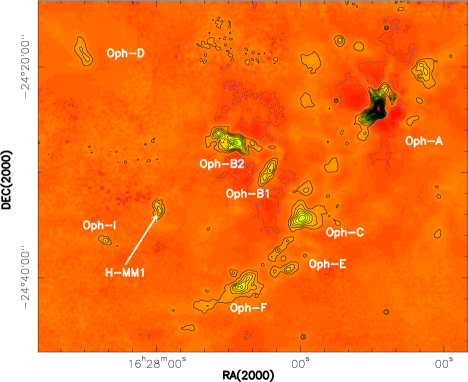
The L1688 cloud (the main cloud in the Ophiuchus dark cloud) has been mapped both in molecular tracers (e.g. Loren et al., 1990) and in continuum emission (e.g. at 1.3 mm by Motte et al., 1998). These early mapping studies revealed different areas of high column density, named Oph-A to Oph-G. Using the Submillimeter Common User Bolometer Array (SCUBA) at the 15 m James-Clerck-Maxwell Telescope (JCMT), Johnstone et al. (2004) covered a larger region, leading to the detection of two new dense cores, that they named Oph-H and Oph-I, following the same nomenclature. Oph-H contains a single continuum peak, H-MM1. The distance of the Ophiuchus region has been recently accurately determined to 120 pc (Loinard et al., 2008).
We present in Fig. 1 a part of the SCUBA map of the Ophiuchus region, as available from the SCUBA Legacy catalogues111http://www2.cadc-ccda.hia-iha.nrc-cnrc.gc.ca/community/ scubalegacy/ (data: scuba_F_353d1_16d8_850um.emi.fits, Di Francesco et al., 2008), showing the relative position of all dense cores. In this paper, we present observations toward the H-MM1 core, at coordinates =16h27m58.3s and =24∘33′42.0′′.
H-MM1 corresponds to the Bolo25 source of the 1.1 mm BOLOCAM (CSO) map observed by Young et al. (2006). The FWHM beam size of these observations is 31′′. Assuming a temperature of 10 K and a dust opacity222This dust opacity assumes a gas-to-dust mass ratio of 100, and is expressed per dust+gas mass unit = 0.0114 cm2 g-1 at 1.12 mm these authors infer a total mass of 0.24 M⊙ in 40′′, and measure a source FWHM size of 47′′ 56′′. They measure a peak visual extinction, , of 23 mag, and a mean density of 5105 cm-3.
Khanzadyan et al. (2004) and Stanke et al. (2006) carried out an unbiased search for protostellar signatures in the -Oph cloud. The closest source they identify in their continuum maps is MMS38 (at 9′′ from our position), which they classify as starless. No optical/NIR counterpart (2MASS) or sign of outflow are found in this source.
The region was also mapped with the Spitzer Space telescope, in the frame of the Cores to Disks legacy project (c2d). We downloaded the corresponding data from the Spitzer website333http:data.spitzer.caltech.edu/popular/c2d/20071101_enhanced_v1/ oph/. No source is detected in any of the Spitzer bands, especially at 70 m, which is a good tracer of embedded protostars (see Dunham et al., 2008). H-MM1 thus appears to be a dense prestellar core.
2.2 APEX line observations
Using the APEX2a single-pixel and CHAMP+ array receivers at the Atacama Pathfinder Experiment telescope (APEX), we observed H2D+ (372 GHz) and D2H+ (692 GHz) toward H-MM1 at the position given in Sect. 2.1. We used in each observation the position-switch mode, with the off-position at (0′′, 300′′) equatorial offsets. Calibration was done by measuring regularly the sky brightness and cold and hot loads in the cabin.
2.2.1 H2D+
Using the APEX2a receiver (Risacher et al., 2006), we observed the ground-state o-H2D+ line toward H-MM1. The frequency of this line is 372.421385 GHz (Amano & Hirao, 2005). Observations took place on June 29th, 2007, under very good weather conditions (precipitable water vapor PWV=0.24 mm). The system temperature was 250 K. The backend, a Fast Fourier Transform Spectrometer (FFTS), was used with 8192 channels, yielding a 0.0983 km s-1 channel separation. The effective frequency resolution of the FFTS in this configuration is 159 kHz (Klein et al., 2006, and B. Klein, priv. comm.), i.e. 0.13 km/s at 372 GHz.
The beam efficiency of APEX at 372 GHz was measured to be 0.73 for compact sources (as measured on Mars and Jupiter, which were respectively 8′′ and 32-35′′ at that time, Güsten et al., 2006). As the D2H+ emission seems extended on a scale comparable to the footprint of CHAMP+ (40′′, see Figure 4), H2D+ is likely to also be extended on that scale. We therefore adopt the scale for our analysis, using the beam efficiency of 0.73. The forward efficiency of the telescope is 0.95 at this frequency.
We reached a rms noise level of 72 mK ( scale) at the initial resolution (0.13 km s-1).
2.2.2 D2H+
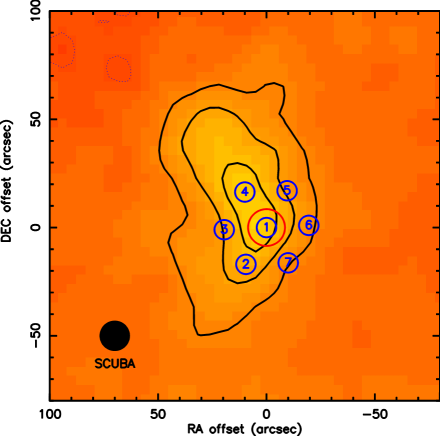
Using the CHAMP+ array receiver on the APEX telescope, we targeted the prestellar core H-MM1. The observations took place in June and August 2009, under good to very good weather conditions (most of the time with PWV 0.45mm). The typical system temperature in the central pixel of the array varied between 800 and 1400 K. Figure 2 presents the overlay of the CHAMP+ footprint on the 850 m continuum emission. Each CHAMP+ pixel was tuned to the CO(6-5) frequency (691.4730763 GHz), which is separated by 187.4 MHz from the D2H+ frequency. We adopt here the most recent measurement of Amano & Hirao (2005) of the D2H+ line frequency: 691.660483 GHz. The beam size is 9′′. The CHAMP+ AFFTS was used with a channel separation of 183 kHz (0.079 km/s). The effective resolution is 212 kHz, i.e. 0.092 km/s.
The beam efficiency at 692 GHz was measured to be 0.52 on Jupiter (angular size 47.3′′ at that time). Because the D2H+ emission is observed to be extended (see below) on a typical size of 40′′, we adopt the beam efficiency of 0.52. The forward efficiency is 0.95 at this frequency.
We reached an rms noise level of 34 mK ( scale) at the initial resolution (0.09 km s-1).
2.3 Continuum data
We retrieved the 850m map of the Ophiuchus region from the SCUBA Legacy catalogues (data: scuba_F_353d1_16d8_850um.emi.fits Di Francesco et al., 2008). The region covering the L1688 cloud is shown in Fig. 1, and was discussed by Jørgensen et al. (2008).
The beam of SCUBA at this frequency is 14′′. The local rms in the H-MM1 region of the map is found to be 60 mJy/beam.
3 Results
| Species | Position | Pixel | dv | vlsr | v | [ v]deconv | dv / | ||
|---|---|---|---|---|---|---|---|---|---|
| EQ offsets | (mK km s-1) | (km s-1) | (km s-1) | (K) | (km s-1) | (mJy/beam) | (K km s-1 / [Jy/beam]) | ||
| o-H2D+ | (0′′, 0′′) | 1 | 18020 | 4.230.04 | 0.510.07 | 0.33 | 0.49 | ||
| p-D2H+ | (0′′, 0′′) | 1 | 478 | 4.300.03 | 0.350.06 | 0.13 | 0.34 | 62860 | 0.0760.015 |
| (9.5′′, 17′′) | 2 | 498 | 4.260.04 | 0.420.09 | 0.11 | 0.41 | 46860 | 0.1060.022 | |
| (19.5′′, 1′′) | 3 | 2710 | 4.160.05 | 0.310.10 | 0.08 | 0.30 | 40460 | 0.0680.027 | |
| (10′′, 16′′) | 4 | 4411 | 4.230.05 | 0.410.12 | 0.10 | 0.40 | 61660 | 0.0720.019 | |
| (9.5′′, 17.0′′) | 5 | 30 | – | – | – | – | 34360 | 0.087 | |
| (19.5′′, 1′′) | 6 | 20 | – | – | – | – | 21160 | 0.095 | |
| (10′′, 16.3′′) | 7 | 20 | – | – | – | – | 17960 | 0.112 |
⋆ is the peak flux density in the 850 m SCUBA map at the center of each CHAMP+ pixel. It is in units of mJy/14JCMT beam. The noise in the map is 60 mJy/beam. The error bars are all 1, and the upper limits 3.
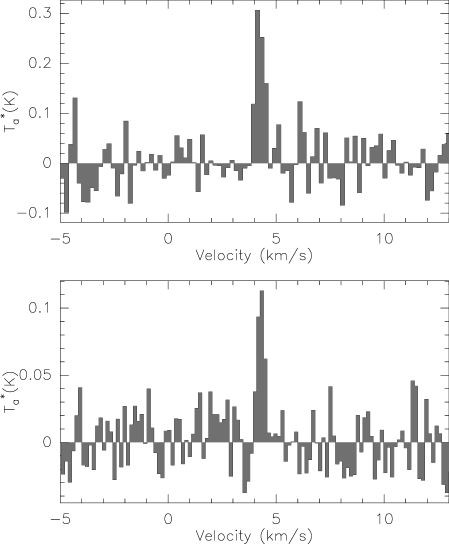
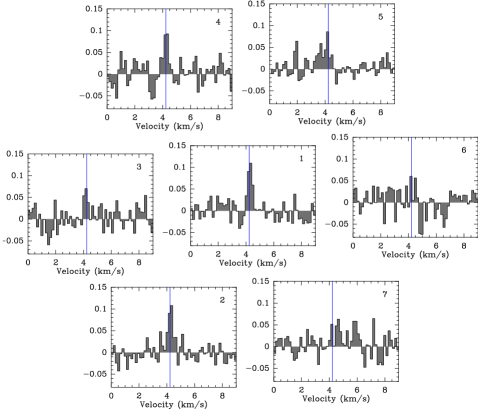
The main result of this work is the first unambiguous detection of p-D2H+ toward a prestellar core. Figure 3 presents the H2D+ and D2H+ emission at the (0′′, 0′′) position. The agreement of the LSR velocities, vlsr, for both lines is remarkable (see Table 1) and further strengthens the assignment of the lines. Figure 4 presents the D2H+ observation on each of the CHAMP+ pixels. The noise level is different from pixel to pixel, due to the different performances of the off-axis pixels. The line is clearly detected in at least two adjacent pixels (pixels 2 and 4). There is also a tentative detection in pixel 3, with a lower intensity. The D2H+ emission is thus extended on the scale of the CHAMP+ footprint (40′′), corresponding to a physical size of 4800 AU at the distance of 120 pc. The observational results are listed in Table 1.
We note that the detection of p-D2H+ in H-MM1 does not imply that it is a peculiar core. None of the searches for p-D2H+ published in Caselli et al. (2008) towards five prestellar cores have reached upper limits which are deep enough to discard the detection of the line with the same peak temperature in those cores.
3.1 Linewidths
The measured linewidths are listed in Table 1. Because the lines are not very broad compared to the frequency resolution of the FFTS, we also computed deconvolved linewidths to correct for instrumental broadening (column 7).
The expected thermal linewidth for a molecule of mass m is:
For H2D+, km/s. For D2H+, km/s, with in Kelvin.
The small linewidth of D2H+ on the (0′′, 0′′) position constrains the kinetic temperature to 13 K. For this upper limit value of the temperature, the rather large H2D+ linewidth points to non-thermal velocity broadening of 0.3 km/s. The different non-thermal velocity contribution to both lines might be a sign that the two molecules do not trace exactly the same gas. The larger non-thermal velocity broadening of o-H2D+ may imply that o-H2D+ is present in a more diffuse and turbulent gas than p-D2H+, as also supported by chemical models, which predict that the p-D2H+/ o-H2D+ ratio raises with density (see Figure 9). In this case, the p-D2H+/ o-H2D+ ratio that we will derive in the densest gas will likely be a lower limit.
3.2 Correlation with continuum emission
The continuum emission at the position of the individual pixels of CHAMP+ is listed in Table 1. The positions where p-D2H+ is detected correspond to the positions where the continuum emission is the strongest. The lower tentative detection in pixel 3 is also consistent with the continuum being weaker at this position. The correlation between the p-D2H+ and the continuum emission is quite good. This implies that the p-D2H+ emission comes from the densest regions of the core, in agreement with the narrow width of the line.
3.3 Column densities
3.3.1 LTE assumption
The critical densities for the o-H2D+ and p-D2H+ transitions are, respectively, 1.3105 and 5.6105 cm-3 (Hugo et al., 2009). Although the density of the dense core may be of the same order or only marginally higher than these critical densities, we start with an LTE analysis as a first approximation. We will consider a non-LTE approach in the following section.
We consider the ortho and para species of each molecule as different species, that do not interconvert via collisions with H2. We thus compute separately the partition function of ortho and para species, from the transitions given in the Cologne Database of Molecular Spectroscopy (CDMS, Müller et al., 2005). The partition functions are computed as
where is the spin degeneracy (1 and 3 for para- and ortho- H2D+ respectively, and 1 and 2 for para- and ortho- D2H+) and gr the rotational degeneracy (gr = 2J + 1). Note that the energies of the levels were all expressed relative to the ground level 000 of each molecule. These partition functions are presented in Table 2.
| Temperature | Q(o-H2D+) | Q(p-D2H+) |
|---|---|---|
| (K) | ||
| 7 | 4.210-5 | 2.310-3 |
| 8 | 2.010-4 | 5.710-3 |
| 9 | 6.910-4 | 1.210-2 |
| 10 | 1.810-3 | 2.010-2 |
| 11 | 4.210-3 | 3.310-2 |
| 12 | 8.210-3 | 4.810-2 |
| 13 | 1.510-2 | 6.810-2 |
| (o-H2D+) | (o-H2D+) | (p-D2H+) | (p-D2H+) | (p-D2H+)/(o-H2D+) | |
|---|---|---|---|---|---|
| (K) | (cm-2) | (cm-2) | |||
| 7 | 0.35 | 9.31012 | 1.7 | 4.11013 | 4.4 |
| 8 | 0.23 | 6.51012 | 0.59 | 1.51013 | 2.2 |
| 9 | 0.17 | 5.11012 | 0.33 | 8.21012 | 1.6 |
| 10 | 0.13 | 4.21012 | 0.21 | 5.41012 | 1.3 |
| 11 | 0.11 | 3.61012 | 0.15 | 3.91012 | 1.1 |
| 12 | 0.088 | 3.21012 | 0.11 | 3.01012 | 0.96 |
| 13 | 0.076 | 2.91012 | 0.089 | 2.51012 | 0.86 |
The column density in the upper level of the transition can be directly derived from the measure of the opacity.
The opacity of the transition, , is given by:
| (1) |
where
Assuming LTE (i.e. = ), we can then derive the total column density of the species:
We used the Aul of Ramanlal & Tennyson (2004). For both transitions, they are 11% different from the value quoted in the CDMS database. We used the accurate frequencies derived by Amano & Hirao (2005).
We note that equation (1) implies that mb J(. This condition for the 692 GHz line of D2H+ translates into J() 0.25 K, i.e. ex 7 K. This condition as well as the previous linewidth argument allow to restrict the kinetic temperature to the range 7–13 K.
The results are presented in Table 3. Depending on the assumed temperature, the p-D2H+/ o-H2D+ ratio varies in the range 0.86 – 4.4.
3.3.2 Out-of-equilibrium radiative transfer
Thanks to the recent computation of all elastic and non-elastic collision rate coefficients by Hugo et al. (2009), we can derive the column density using an out-of-equilibrium radiative transfer model. We used the non-LTE radiative transfer code RADEX (van der Tak et al., 2007), in the isothermal sphere geometry, with the escape probability as a function of the opacity as follows:
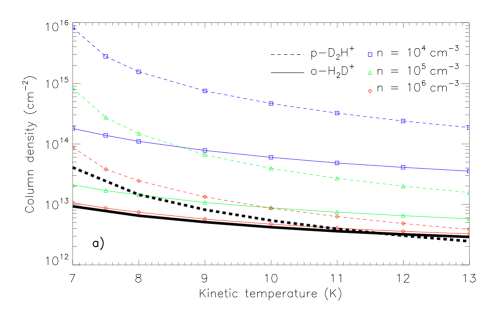
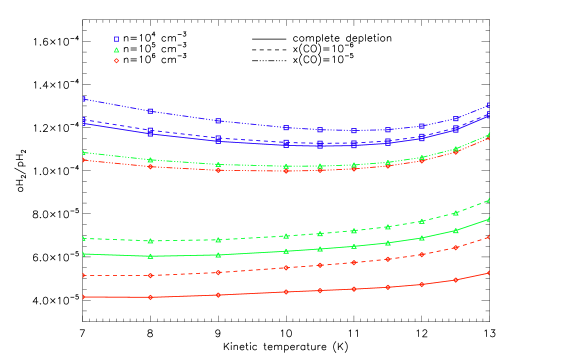
Because the rates for collisions with o-H2 and p-H2 are quite different, the nature of the collider matters for the excitation. Our chemical models (presented in Sect. 4) predict that the steady-state ortho/para-H2 is within a factor of two around 10-4 for all physical conditions probed (Fig. 8). We checked that the excitation is unchanged (within numerical precision) when considering only para-H2 or para-H2 with traces of ortho-H2 (o/p-H2 210-4). We thus assumed in a first approximation collisions with para-H2 only in the derivation of the column density of o-H2D+and p-D2H+. Pagani et al. (2009) however showed that the o/p-H2 ratio is unlikely in steady-state in prestellar cores (see also Section 4.2 and Fig. 7). For completeness, we checked the computed column densities in the case where the o/p-H2 ratio is higher than the steady-state value. We find that the derived column densities start to deviate sensibly from the ones derived with only p-H2 for values of the o/p-H2 ratio of the order of unity.
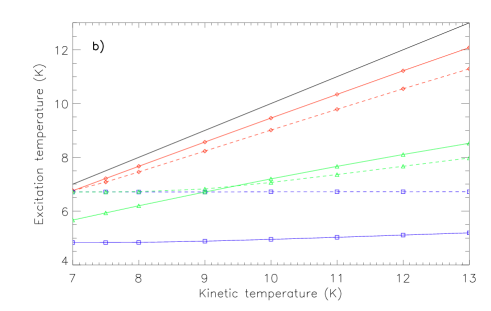
The results with excitation with para-H2 only are presented in Fig. 5a. The results with an o/p-H2 ratio of 10-2 are found to differ from Fig. 5a by less than 1%. The column densities derived within the LTE approximation are also shown on the figure. Even at a density of 106 cm-3, the LTE assumption is not accurate, especially for p-D2H+which has the highest critical density. One can check indeed that the excitation temperature does not reach the kinetic temperature in any of the studied cases (Fig. 5b).
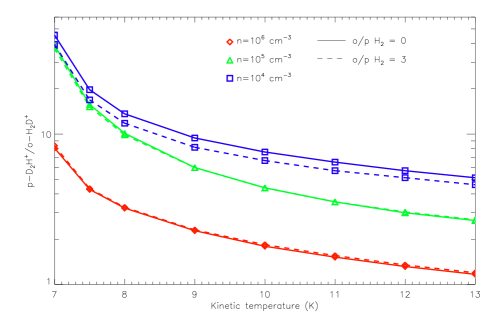
Assuming o/p-H2 = 3 (the highest possible ratio at thermodynamical equilibrium) results in column densities about 10–20% higher than in the case of excitation with only para-H2, the effect being more important at low densities, as expected (at high densities, the system is close to LTE, and does not depend on the nature of the collider). The abundance ratio of the two molecules is even less sensitive to the o/p-H2 ratio, as shown in Fig. 6. This figure presents the p-D2H+/ o-H2D+ ratio resulting from our radiative transfer analysis, for different densities and in the two cases o/p-H2 = 0 and 3. In the following, we aim at investigating the implications of this the p-D2H+/ o-H2D+ ratio with the help of a state-of-the art chemical model.
4 Astrochemical Modelling
4.1 Our model
We solve the chemistry in the gas phase using a code developed by our group, and based on the DLSODES solver, which is part of the ODEPACK package (www.netlib.org). The code was benchmarked against the results of Pagani et al. (2009) and Sipilä et al. (2010). We used the same approach as Sipilä et al. (2010) in building the reaction file for the complete depletion case. We take into account all different spin states of the different molecules and ions (i.e. we consider separately ortho and para species of H2, D2, H2D+, D2H+, H and ortho, para and meta species of D). We use the reaction rates between these species of Hugo et al. (2009). In addition we added a simple chemistry of CO and N2, as in Pagani et al. (2009). We use the recombination rates for all ions of Pagani et al. (2009).
The pseudo-time-dependent chemical model contains only gas phase reactions, except that formation of H2, HD, and D2 on the grain surface is also included. We use the “large grain limit” (Lipshtat et al., 2004), with the further assumption that all the influx of H and D atoms is converted into H2, HD, and D2 molecules, and the diffusion rates of H and D atoms on the grain surface are approximately the same. With these assumptions, the formation rates of these three molecules can be written explicitly as
| (2) | |||||
| (3) | |||||
| (4) |
Here and are the density and cross section of grain particles, , , , and are the thermal velocity and number density of H and D atoms. In this limit, the rather controversial detailed formation mechanism of H2 and the uncertain evaporation and diffusion energy barriers do not enter the equations. The ortho and para forms of H2 and D2 are produced according to the statistical weights ( and ).
The influence of the different parameters on the chemistry has been studied in great detail by Walmsley et al. (2004), Flower et al. (2004), Pagani et al. (2009) and Sipilä et al. (2010). Here, we adopt a cosmic ray ionization of 310-17 s-1, a dust-to-gas mass ratio of 1.310-2, and a grain radius of 0.1 m. These parameters are not varied, because of the lack of observational constraints at hand.
We simulate different levels of CO depletion by using different CO initial abundances. Note that we run the models with a constant elemental C and O abundance (i.e. we do not allow depletion on the grains during the evolution). In all our models, we assume that depletion affects CO and N2 abundances at the same level.
4.2 Timescales
The free-fall timescale of an isothermal sphere of = 106 cm-3 is 3104 yrs. Magnetic fields can increase the dynamical timescale, then controlled by ambipolar diffusion in the early evolution of subcritical cores. Timescales of core evolution can be inferred empirically by comparing the number of prestellar and protostellar cores in observed regions (for a review, see Ward-Thompson et al., 2007, and references therein). These empirical timescales lie roughly in the range 2–5 .
It is instructive to compare the chemical timescales to this dynamical timescale. Figure 7 shows the time evolution of the o/p-H2 ratio and p-D2H+/o-H2D+ ratio for constant physical conditions. The temperature was fixed to 12 K, and three different densities were considered. As already pointed out by e.g. Pagani et al. (2009), the longest timescale in the chemistry is the conversion between the two forms of ortho and para H2. The other ions adjust to the o/p ratio of H2 in typically less than 102 yrs. The ortho-para interconversion of H2 takes around 104 yrs (typical timescale for decrease of o/p-H2 ratio by a factor 1/e, see Fig. 7).
The free-fall timescale varies as 1/ and the chemical timescale varies even slower with the density. The timescale for o/p-H2 conversion is 6103 yrs at density = 106 cm-3, and 9103 and 1.7104 yrs for densities of 105 and 104 cm-3, respectively. At high densities, the chemical timescales are somewhat shorter than the free-fall timescales (thus roughly one order of magnitude smaller than the empirical core timescales), and the difference even increases at lower densities. This comparison between timescales justifies at first order to consider the chemistry independently of the dynamical evolution, as already discussed by Walmsley et al. (2004).
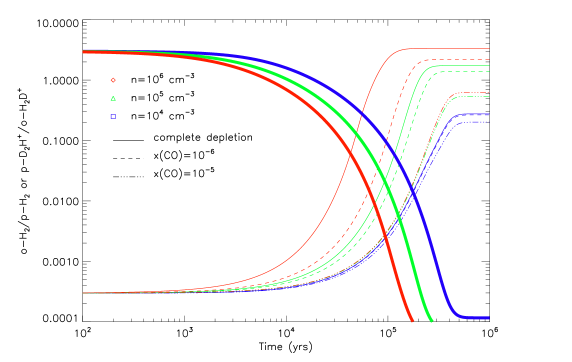
Because the evolutionary stage of the H-MM1 core is not constrained, in the following we will focus on the study of the chemical composition when the steady-state is obtained. This choice avoids including the age of the core as an additional parameter but will not invalidate the generality of our conclusions. As shown in Fig. 7, taking the chemical composition at long times overestimates the p-D2H+/o-H2D+ ratio in case the core is not yet in chemical steady-state. This note will be important for the extrapolation of our conclusions in the next sections.
4.3 Physical conditions
We could in principle derive the density profile of the core from the continuum emission at 850 m. However, this would require the knowledge of the temperature profile, which is not known. The Gould Belt Survey (André et al., 2010) made with the Herschel Space Observatory should allow to derive accurate temperature profiles. Until then, as we cannot constrain the density profile without ad-hoc assumptions on the temperature, we restrict ourselves here in running chemical models at different densities, temperatures, and levels of CO depletion. Our goal is to investigate under which average conditions the model can reproduce the observations. A full physical model of the source will be presented in a forthcoming detailed study, after collecting new observational constraints.
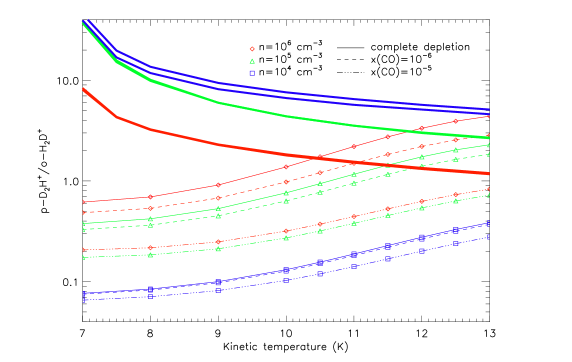
Figure 9 shows the prediction of the model for the p-D2H+/o-H2D+ ratio. The thin lines are the model predictions, as a function of temperature, and for different densities and CO depletion factors. At fixed density, the p-D2H+/o-H2D+ ratio is increasing with the CO depletion level, because HD becomes more and more competitive over CO for reaction with H and isotopologues. The ratio increases with temperature in this temperature range, as already explained in detail by Flower et al. (2004). The three thick lines are the ratios as calculated with RADEX from the observed line intensities (as a function of temperature and for different densities and o/p-H2 ratios, as already shown in Fig. 6). We discuss in the following section the comparison between the chemical model and the observations.
5 Discussion
Figure 9 allows to investigate the effect of the temperature, density and CO depletion level on the p-D2H+ / o-H2D+ratio, and to infer under which average conditions our model could reproduce the observed value. It should be noted that the observational ratio also depends on the assumed density, because of the non-LTE effects described in Section 3.3.2. Agreement between observations and model can only be reached for densities strictly higher than 105 cm-3. This is consistent with the relatively high measured average density of the core (5105 cm-3, Young et al., 2006). Even at the high density of 106 cm-3, the model can only reproduce the large observed p-D2H+/o-H2D+ ratio if 10 K and if the CO depletion level is substantial. The model points to the fact that the CO abundance should be 10-5. This corresponds to a CO depletion level of more than 10 (for = 13 K). The required depletion is even more severe if the density is a bit lower, or if the temperature is closer to 10 K. Complete depletion (i.e. 100) is required at 10 K.
Bacmann et al. (2002) have studied the level of CO depletion toward a sample of seven prestellar cores. These cores are located at distances between 120 and 200 pc, and three of them are in the Ophiuchus molecular cloud. The cores have mean densities in the range (0.9–6) 105 cm-3, similar to H-MM1. Based on IRAM observations of dust continuum and CO isotopologues (at angular resolution of 22′′), the authors find depletion factors at the continuum peak of the cores in the range 4.515.5, but this factor drops to 25 at offset positions where the continuum is 70% of the peak value. Although the study of Bacmann et al. (2002) was done at a 22′′ resolution (to be compared to our 9–14′′ beams), preventing us from doing an accurate comparison, the average depletion level we deduce in H-MM1 seems to be in the high range. Moreover the D2H+ emission is extended over 40′′. Should the H2D+ be also extended on that scale, this would imply that the model requires a high CO depletion ( 10) over an extended region, in contradiction with the results of Bacmann et al. (2002). It is clear that the observation of the H2D+ spatial distribution and the direct measurement of the level of CO depletion are required to confirm if the astrochemical model is indeed unable to describe satisfactorily the roots of deuterium chemistry.
Following the discussion on the linewidths in Section 3.1, the level of the thick observational curves in Fig. 9 is in fact likely underestimated. Similarly, following the discussion in Section 4.2, the model predictions are overestimated if the core has not yet reached chemical equilibrium. These remarks show that the difficulties of the model might be even more severe than shown on Fig. 9.
The model also seems to exclude kinetic temperatures below 10 K, but several very cold prestellar cores are known (6–7 K, Crapsi et al., 2007; Pagani et al., 2007; Harju et al., 2008). The temperature in H-MM1 still needs to be determined, but this point could be another difficulty of the model.
Further tests of our understanding of the root of deuterium fractionation will depend on the observation of H2D+ at the offset positions where D2H+ was detected, and on the independent measure of the kinetic temperature and CO depletion level, for which we have an on-going APEX project.
6 Conclusions
We presented the first secure D2H+ detection in the ISM, toward the Oph H-MM1 core. The centroid velocity of the line is consistent with the one of the o-H2D+ line. The emission is extended over 40′′ at least. Using an out-of-equilibrium radiative transfer model, we have inferred the column densities of both o-H2D+ and p-D2H+. We analyzed the chemistry with a state-of-the-art astrochemical model including all spin states of H, H2D+, D2H+, D. The model can reproduce the data only if the average density is high ( few 105 cm -3), the kinetic temperature is between 10 and 13 K, and the depletion level of CO is high ( 10 at 13 K, 100 at 10 K). Further observational studies may show whether these conditions indeed apply to H-MM1, and if the CO depletion level stays high on the large scales at which p-D2H+ emits.
Should new observational studies confirm the failure of the model, new ways will have to be investigated. We list here several possibilities: include a more complete description of the chemistry (treating fully e.g. the CO chemistry and gas-grain interaction), recompute or measure the reaction and collision rates of all (spin separated) species, include in the chemical model a correct treatment of the excitation of the different molecules (at the moment, all adopted reactive and non-reactive collision rates describe the molecules in their rotational ground state).
Acknowledgements.
We thank the technical team who built the CHAMP+ receiver for APEX. This work is supported by the German Deutsche Forschungsgemeinschaft, DFG Emmy Noether project number PA1692/1-1.References
- Amano & Hirao (2005) Amano, T. & Hirao, T. 2005, Journal of Molecular Spectroscopy, 233, 7
- André et al. (2010) André, P., Men’shchikov, A., Bontemps, S., et al. 2010, A&A, 518, L102+
- Bacmann et al. (2002) Bacmann, A., Lefloch, B., Ceccarelli, C., et al. 2002, A&A, 389, L6
- Belloche et al. (2006) Belloche, A., Parise, B., van der Tak, F. F. S., et al. 2006, A&A, 454, L51
- Caselli et al. (2003) Caselli, P., van der Tak, F. F. S., Ceccarelli, C., & Bacmann, A. 2003, A&A, 403, L37
- Caselli et al. (2008) Caselli, P., Vastel, C., Ceccarelli, C., et al. 2008, A&A, 492, 703
- Crapsi et al. (2007) Crapsi, A., Caselli, P., Walmsley, M. C., & Tafalla, M. 2007, A&A, 470, 221
- Di Francesco et al. (2008) Di Francesco, J., Johnstone, D., Kirk, H., MacKenzie, T., & Ledwosinska, E. 2008, ApJS, 175, 277
- Dunham et al. (2008) Dunham, M. M., Crapsi, A., Evans, II, N. J., et al. 2008, ApJS, 179, 249
- Emprechtinger et al. (2009) Emprechtinger, M., Caselli, P., Volgenau, N. H., Stutzki, J., & Wiedner, M. C. 2009, A&A, 493, 89
- Flower et al. (2004) Flower, D. R., Pineau des Forêts, G., & Walmsley, C. M. 2004, A&A, 427, 887
- Güsten et al. (2006) Güsten, R., Booth, R. S., Cesarsky, C., et al. 2006, in Society of Photo-Optical Instrumentation Engineers (SPIE) Conference Series, Vol. 6267, Society of Photo-Optical Instrumentation Engineers (SPIE) Conference Series
- Harju et al. (2008) Harju, J., Juvela, M., Schlemmer, S., et al. 2008, A&A, 482, 535
- Hirao & Amano (2003) Hirao, T. & Amano, T. 2003, ApJ, 597, L85
- Hugo et al. (2009) Hugo, E., Asvany, O., & Schlemmer, S. 2009, J. Chem. Phys., 130, 164302
- Johnstone et al. (2004) Johnstone, D., Di Francesco, J., & Kirk, H. 2004, ApJ, 611, L45
- Jørgensen et al. (2008) Jørgensen, J. K., Johnstone, D., Kirk, H., et al. 2008, ApJ, 683, 822
- Khanzadyan et al. (2004) Khanzadyan, T., Gredel, R., Smith, M. D., & Stanke, T. 2004, A&A, 426, 171
- Klein et al. (2006) Klein, B., Philipp, S. D., Krämer, I., et al. 2006, A&A, 454, L29
- Lipshtat et al. (2004) Lipshtat, A., Biham, O., & Herbst, E. 2004, MNRAS, 348, 1055
- Loinard et al. (2008) Loinard, L., Torres, R. M., Mioduszewski, A. J., & Rodríguez, L. F. 2008, ApJ, 675, L29
- Loren et al. (1990) Loren, R. B., Wootten, A., & Wilking, B. A. 1990, ApJ, 365, 269
- Motte et al. (1998) Motte, F., Andre, P., & Neri, R. 1998, A&A, 336, 150
- Müller et al. (2005) Müller, H. S. P., Schlöder, F., Stutzki, J., et al. 2005, in IAU Symposium, ed. D. C. Lis, G. A. Blake, & E. Herbst, 30–+
- Pagani et al. (2007) Pagani, L., Bacmann, A., Cabrit, S., & Vastel, C. 2007, A&A, 467, 179
- Pagani et al. (2009) Pagani, L., Vastel, C., Hugo, E., et al. 2009, A&A, 494, 623
- Parise et al. (2004) Parise, B., Castets, A., Herbst, E., et al. 2004, A&A, 416, 159
- Parise et al. (2002) Parise, B., Ceccarelli, C., Tielens, A. G. G. M., et al. 2002, A&A, 393, L49
- Parise et al. (2009) Parise, B., Leurini, S., Schilke, P., et al. 2009, A&A, 508, 737
- Ramanlal & Tennyson (2004) Ramanlal, J. & Tennyson, J. 2004, MNRAS, 354, 161
- Risacher et al. (2006) Risacher, C., Vassilev, V., Monje, R., et al. 2006, A&A, 454, L17
- Roberts et al. (2003) Roberts, H., Herbst, E., & Millar, T. J. 2003, ApJ, 591, L41
- Roueff et al. (2007) Roueff, E., Parise, B., & Herbst, E. 2007, A&A, 464, 245
- Sipilä et al. (2010) Sipilä, O., Hugo, E., Harju, J., et al. 2010, A&A, 509, A98
- Stanke et al. (2006) Stanke, T., Smith, M. D., Gredel, R., & Khanzadyan, T. 2006, A&A, 447, 609
- Turner (1990) Turner, B. E. 1990, ApJ, 362, L29
- Turner (2001) Turner, B. E. 2001, ApJS, 136, 579
- van der Tak et al. (2007) van der Tak, F. F. S., Black, J. H., Schöier, F. L., Jansen, D. J., & van Dishoeck, E. F. 2007, A&A, 468, 627
- van der Tak et al. (2005) van der Tak, F. F. S., Caselli, P., & Ceccarelli, C. 2005, A&A, 439, 195
- Vastel et al. (2004) Vastel, C., Phillips, T. G., & Yoshida, H. 2004, ApJ, 606, L127
- Walmsley et al. (2004) Walmsley, C. M., Flower, D. R., & Pineau des Forêts, G. 2004, A&A, 418, 1035
- Ward-Thompson et al. (2007) Ward-Thompson, D., André, P., Crutcher, R., et al. 2007, Protostars and Planets V, 33
- Young et al. (2006) Young, K. E., Enoch, M. L., Evans, II, N. J., et al. 2006, ApJ, 644, 326