Evolution of National Nobel Prize Shares in the 20th Century
Abstract
We analyze the evolution of cumulative national shares of Nobel Prizes since 1901, properly taking into account that most prizes were divided among several laureates. We rank by citizenship at the moment of the award, and by country of birth. Surprisingly, graphs of this type have not been published before, even though they powerfully illustrate the century’s migration patterns (brain drains and gains) in the sciences and other fields.
The Nobel Foundation does not treat all Nobel Laureates equally. While some get a full prize for their achievements, most get only 1/2, 1/3, or 1/4. For example, some Nobel Prizes are divided among three laureates such that one of them gets 1/2, and the others 1/4 each. Our data gathered from the Nobel Foundation web site nobelprize.org (retrieved in March 2010) takes this into account. For the most successful nations of the 20th century, our figures show the temporal evolution from 1901 to 2000 (and up to 2009) of national Nobel Prize shares, by country of birth, by citizenship at the time of the award, for each Nobel Prize type, for the total, and for the sciences in particular.
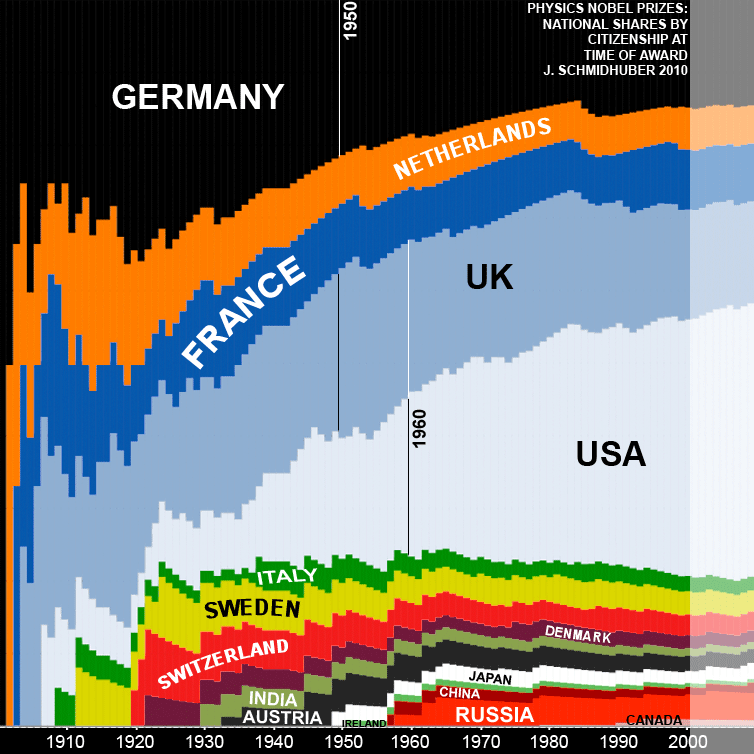
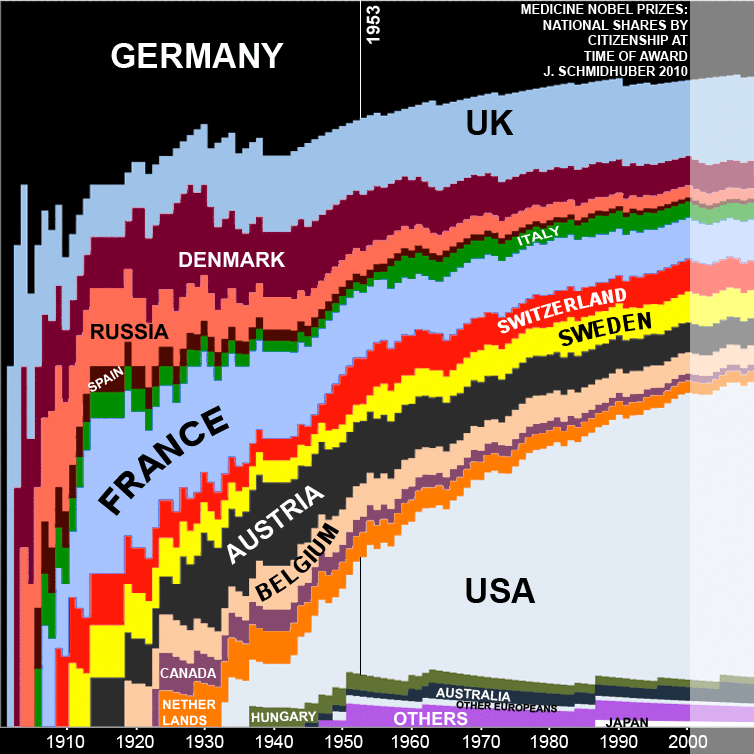
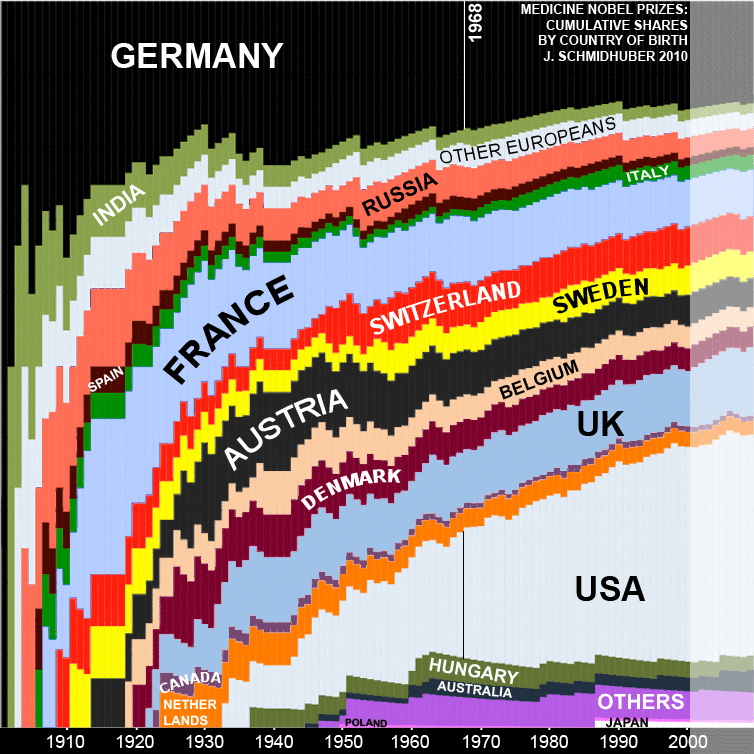
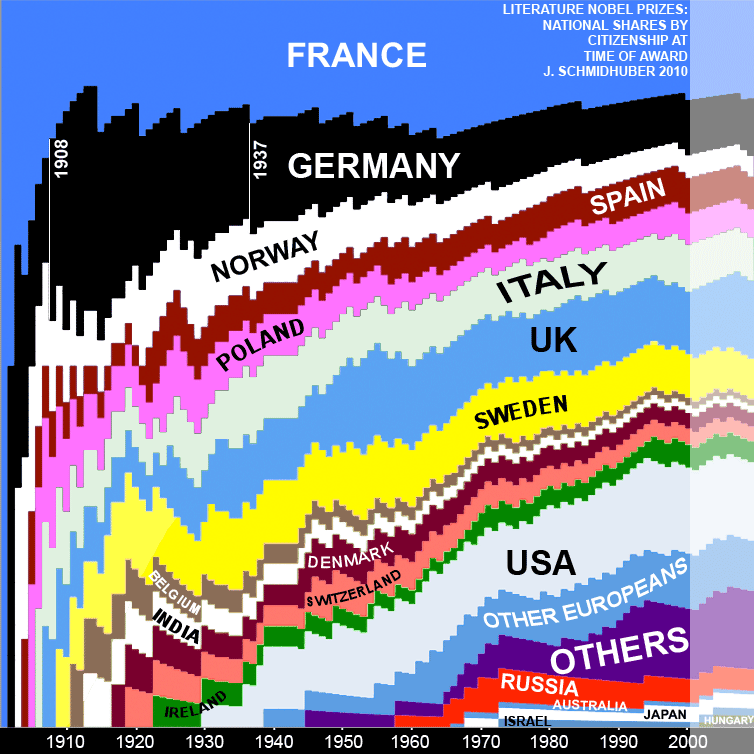
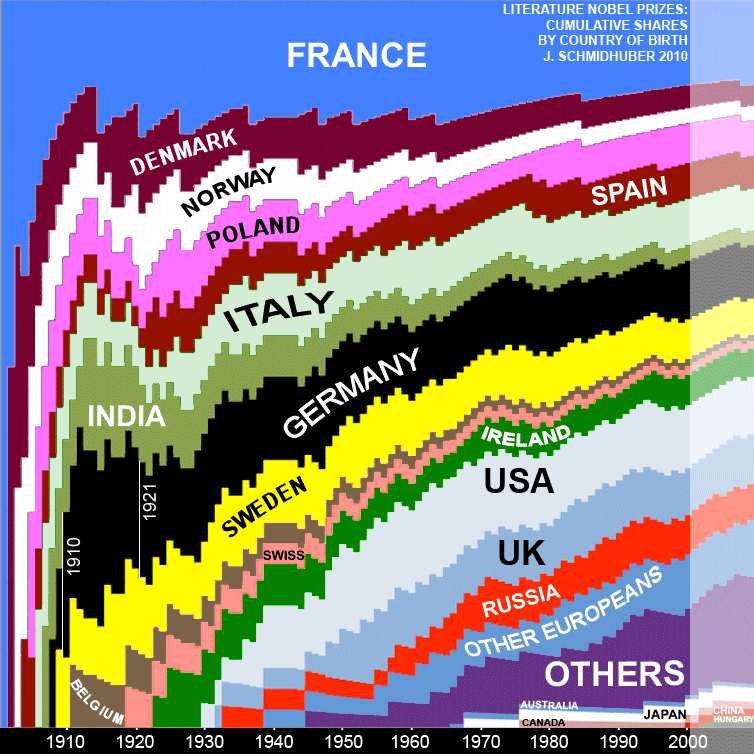
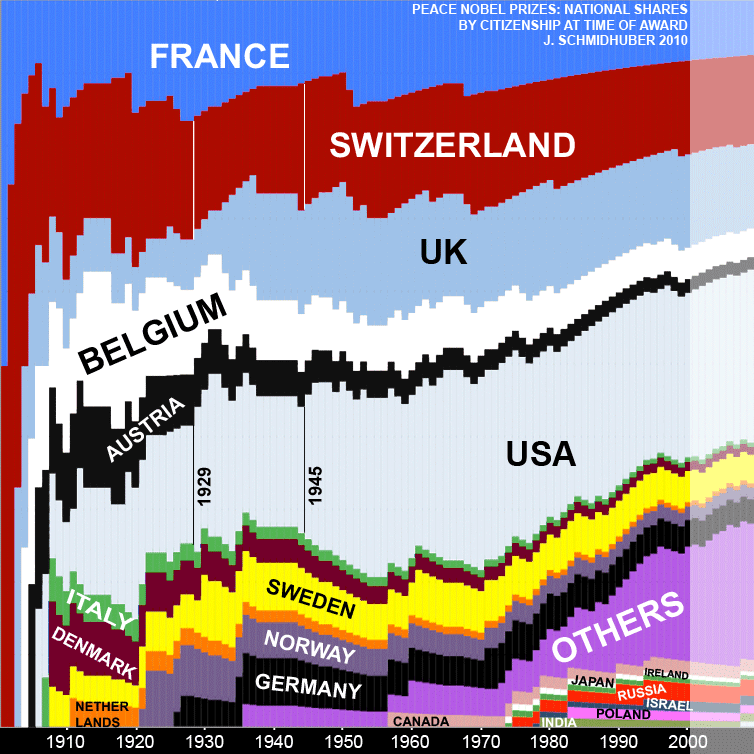
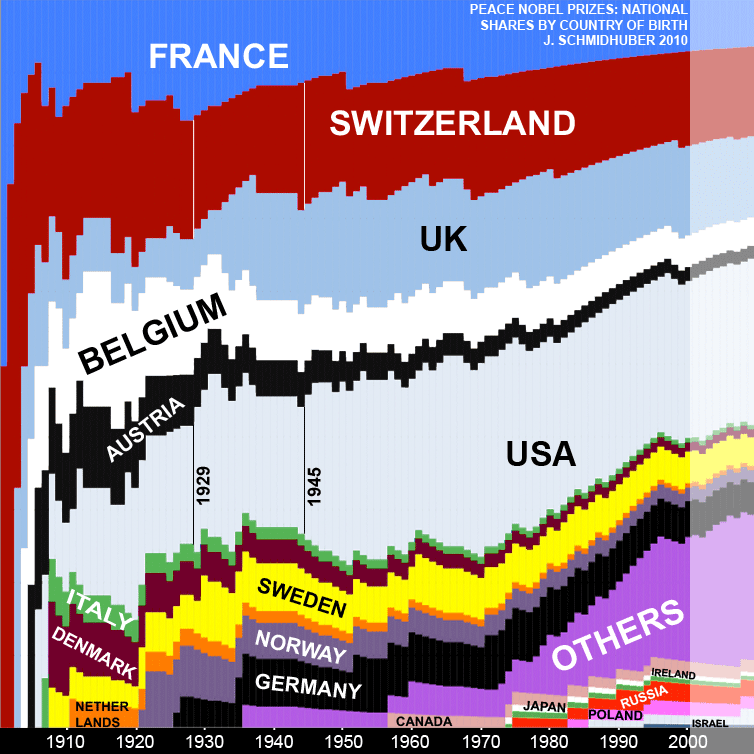
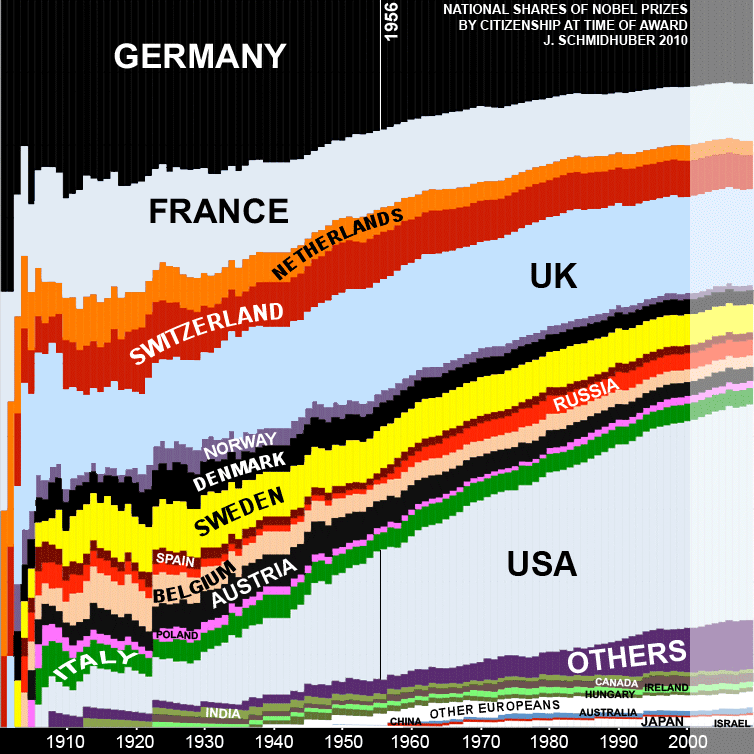
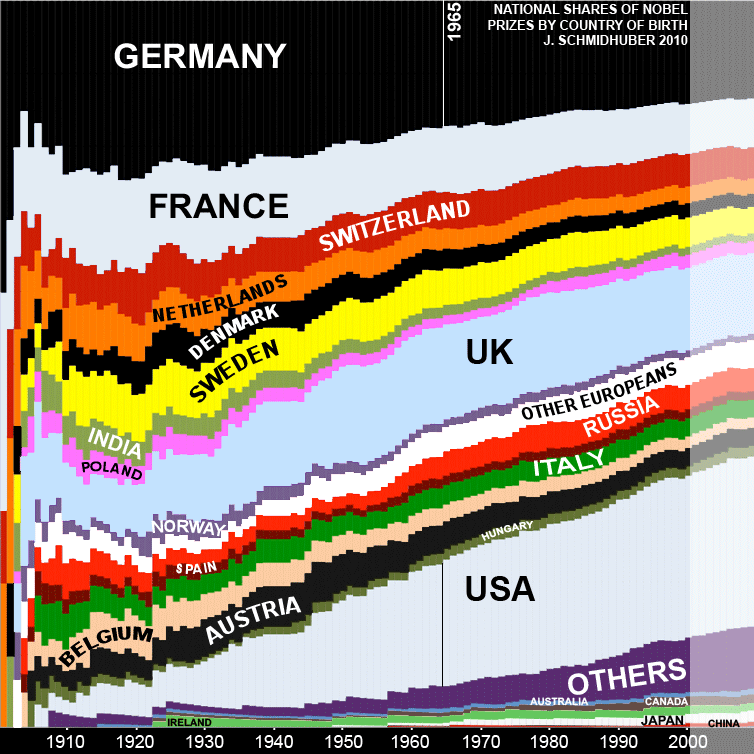
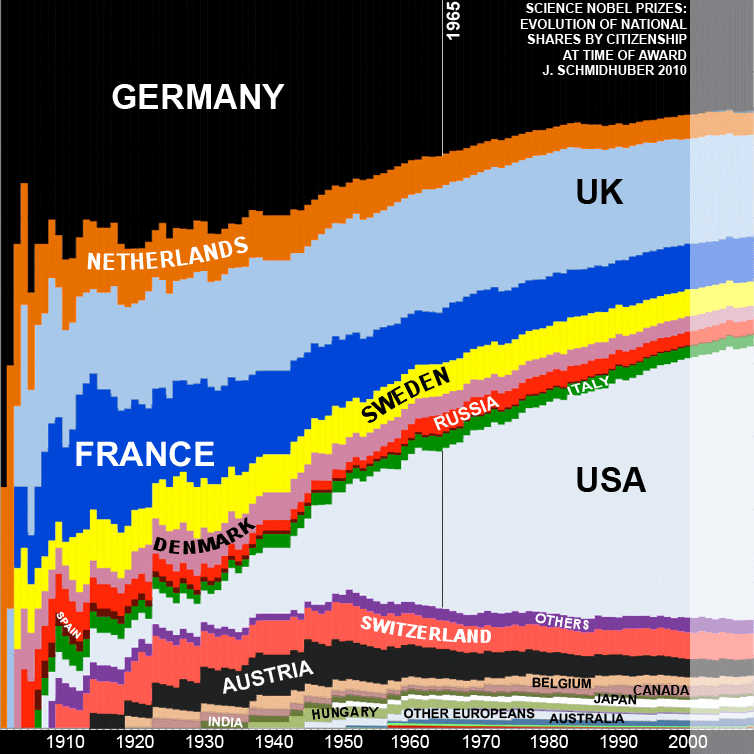
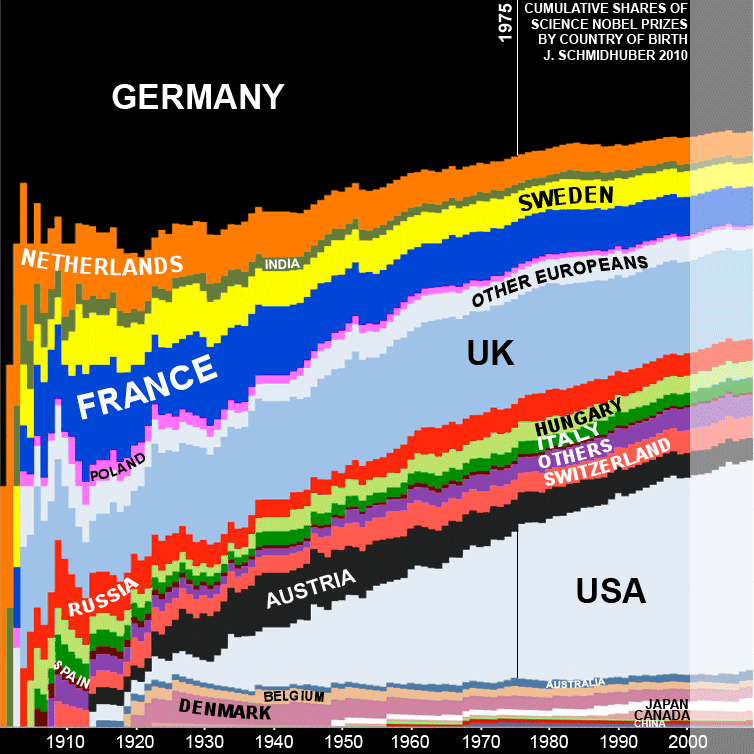
Methodology. For any Nobel laureate with nationalities we add his/her award fraction (1, 1/2, 1/3, or 1/4) to the corresponding national counts.111That is, we do not multiply the award fraction by , which would ensure that all prizes of all nations add up correctly. The graphs would hardly change though if we did, because according to the Nobel Foundation, only few laureates—mostly in the US and the UK—had more than one nationality when they got their award. Prizes for organizations are treated like those for individuals. We combine prizes of laureates from Russia and the USSR. We do not include the “Sveriges Riksbank Prize in Economic Sciences in Memory of Alfred Nobel” handed out since 1969 together with the original prizes.222 The prize of the Swedish bank is not an official Nobel Prize, although the popular press often calls it that—the Nobel Foundation carefully sets it apart from the others. Since it did not even exist for more than two thirds of the century, its inclusion would also somewhat distort the graphs, although the broad overall picture would not change much. In Figures 1-14, countries are ordered from upper left to lower right corner by the year their first laureate received a Nobel Prize fraction. For any year the vertical width of some nation’s colored band measures its percentage of Nobel prizes of the given type up to that year (image height 100%). That is, each vertical slice of a given year compactly summarizes the information available to a person living in that year. Color codes of countries are largely consistent across figures, but sometimes adjusted to improve contrast on grey-scale printers.
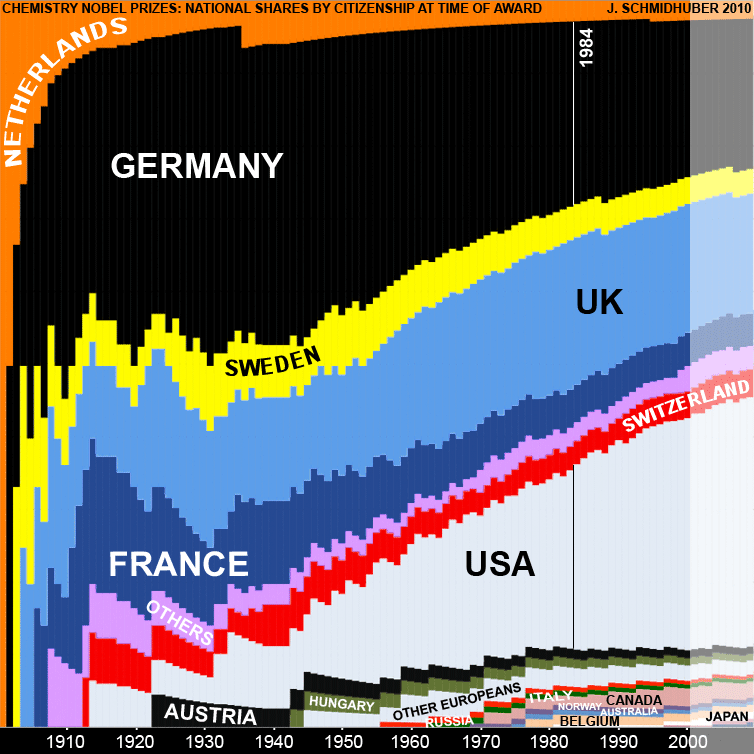
Rankings Based on Citizenship. In 1956, the US started to lead the total Nobel Prize count by citizenship at the moment of the award, taking over from Germany (which shared the lead with the United Kingdom for one year 1904-05; Figure 11). The UK passed France for good in 1934, and Germany in 1974. Considering only Nobel Prizes in the sciences (Figure 13), and ignoring high-variance fluctuations with little statistical significance in the beginning of the century, Germany was ahead until 1964: until 1984 in chemistry (after a quick start by the Netherlands; see Figure 3), until 1953 in medicine (Figure 5), until 1950 in physics (led by the UK in the 1950s; Figure 1). Since 1984, all sciences have been led by the US. Switzerland, US, and UK collected many of the peace prizes (the US has led this category since 1929 although former leader Switzerland briefly caught up again in 1944; see Figure 9). France led the literature count for most of the century (Figure 7).
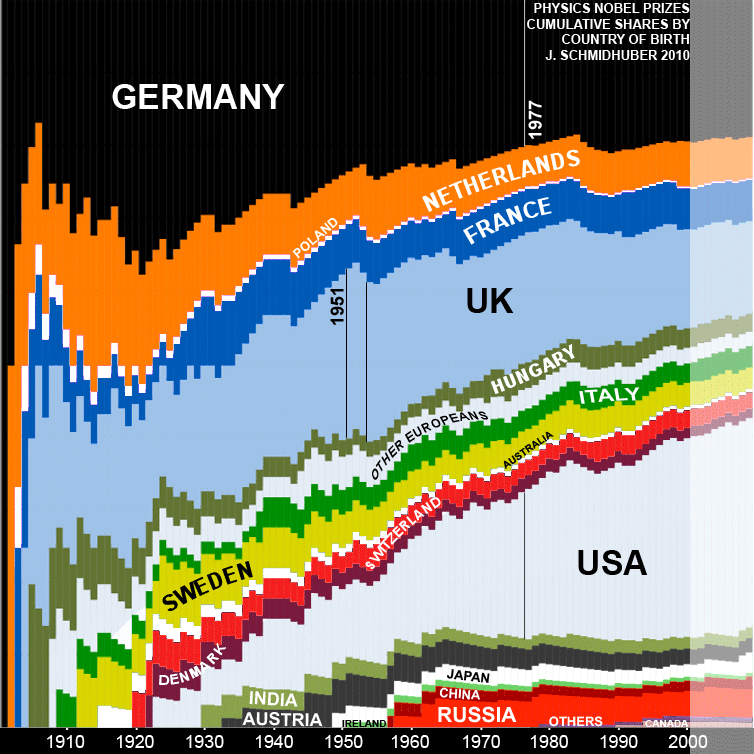
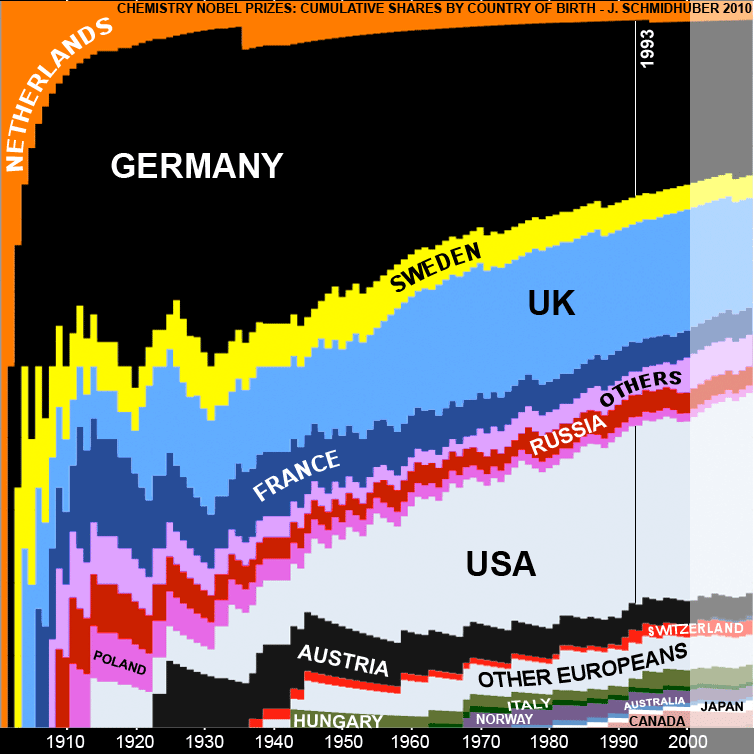
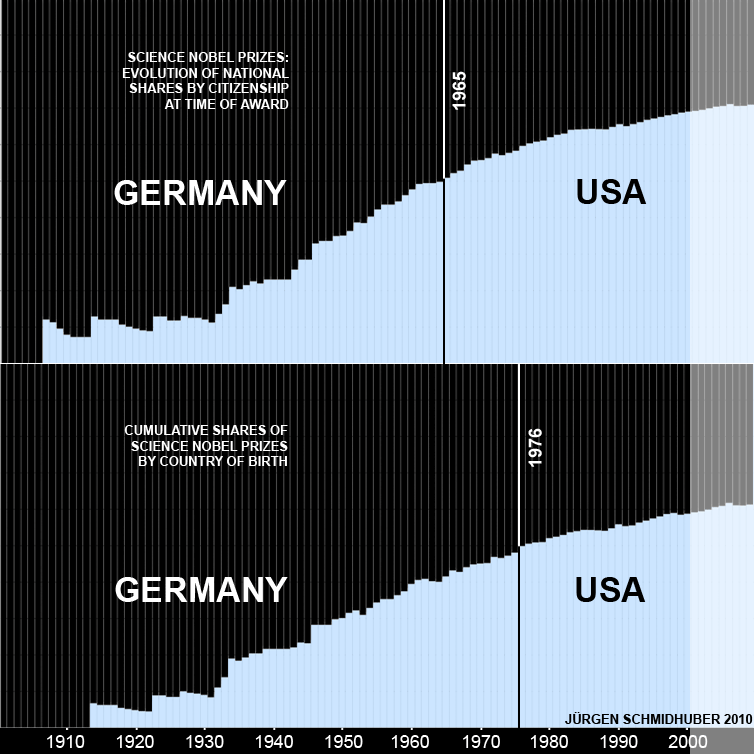
Rankings Based on Birthplace. Graphs based on the laureates’ countries of birth are visibly different, since many laureates were not born in the country whose citizenship they had when they received their prize. US-born laureates started to lead the birth-based total Nobel Prize count in 1965 (Figure 12), roughly a decade after the corresponding citizenship-based date reflecting earlier brain gain. In the sciences (Figure 14), ignoring initial high-variance fluctuations, native Germans led until 1975: until 1993 in chemistry (Figure 4), until 1977 in physics (Figure 2; note the particularly prominent brain drain-caused difference to the citizenship-based ranking of Figure 1), until 1968 in medicine (Figure 6). Since 1993, all sciences have been led by US-born laureates, while the literature count almost always was led by French-born writers (Figure 8). Total birth-based Nobel Prize counts at the end of the century: US 99.58, Germany 62.58, UK 50.33, France 30.5. In the sciences: US 74.08, Germany 51.08, UK 34.33, France 14.5.
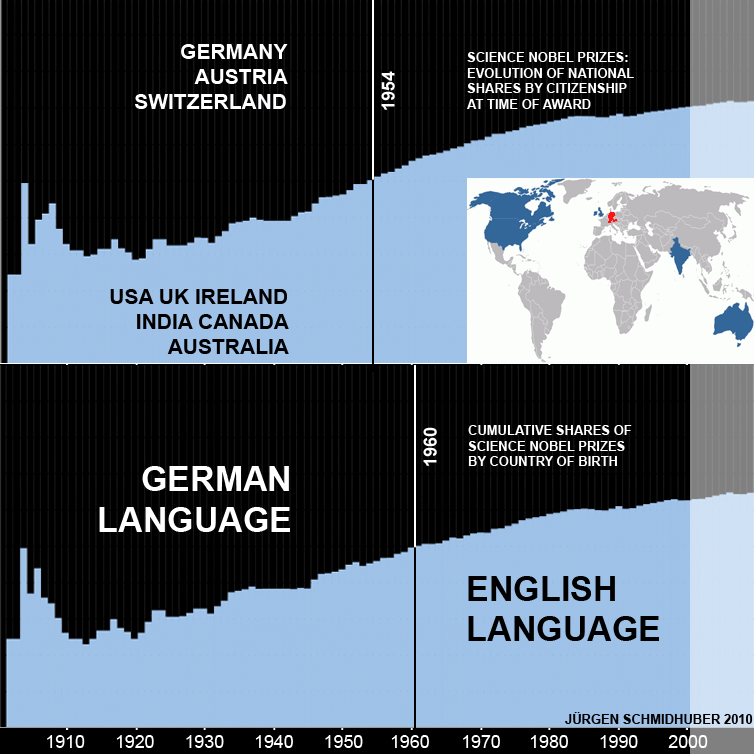
The most obvious geographic shift was the decline of Germany in the wake of World War II, and the symmetric rise of the US, especially in the sciences (Figure 15). Until shortly after the war, Germany still boasted more Nobel Prizes (by citizenship and by birth) than the Allied Powers UK, US, and USSR combined (except for one year 1904-05). During this period, its share actually slightly profited from brain gain, especially in chemistry (Figures 4 & 3) and literature (Figures 8 & 7), not yet suffering from brain drain. Then the picture quickly changed, as English-speaking nations increased their share at the expense of German-speaking and other continental nations (Figure 16). Asian nations also have increased their share. As of 2009, Nobel Prize counts of major players by citizenship are: EU 270, USA 150, Asia 30. Extrapolating current trends, the European share may fall below 50% within a few decades.
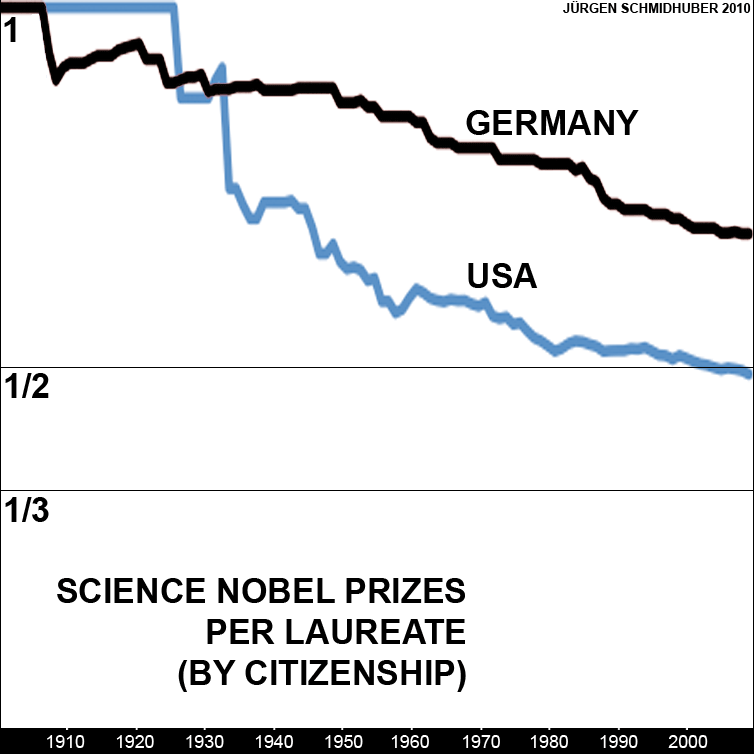
Laureates per Prize. In the beginning of the century most laureates got a full prize; in the end most got just a fraction thereof. This laureate inflation accelerated in the century’s second half, when US and UK were particularly successful. In the 21st century this trend remains unbroken, reflected by the declining average prize fraction per laureate (currently about 0.55 / 0.65 / 0.72 prizes per US / UK / German laureate). Roughly 1 in 4 (mostly younger) US laureates, 1 in 3 UK laureates, and 1 in 2 (mostly older) German laureates got a full prize. In the sciences, the prizes per laureate ratio shrank even more rapidly (currently about 0.49 / 0.69 prizes per US / German laureate; Figure 17). Counting just laureates instead of their prizes would exhibit a strong bias towards more recent decades.
Per Capita Rankings. The population of the US grew from 77m in 1901 to 309m in 2009; Germany’s from 56m to 82m; the UK’s from 38m to 61m; Switzerland’s from 3.3m to 7.5m. Since nations have grown at varying speeds, historic census data should be taken into account to create proper per capita measures and graphs. This was not done here. However, to obtain crude approximate per capita rankings, one could naively divide each nation’s sum of Nobel Prizes by its current population. Considering only nations whose citizens collected Nobel Prizes on a regular basis, the ranking is led by Switzerland, with roughly 3 Nobel Prizes per million capita (NPpmc), followed by Sweden (nearly 2 NPpmc), Denmark (nearly 1.5 NPpmc), Austria (over 1 NPpmc), and the UK (about 1 NPpmc). (We ignore statistical outliers St. Lucia and Iceland, each with 1.0 prizes for one single laureate, according to the Nobel Foundation).
Individuals etc. The most successful Nobel Prize-winning entity so far was the International Committee of the Red Cross (Switzerland, 2.5 prizes for peace). The most successful individual was L. Pauling (US, 2.0 prizes: 1.0 for peace, 1.0 for chemistry). The top science laureates were M. Curie (France, 1.25 prizes: 1.0 for chemistry, 0.25 for physics) and F. Sanger (UK, 1.25 for chemistry). More than 200 of over 700 laureates got exactly 1.0 prize. The only double laureate with less than 1.0 was J. Bardeen (US, 2/3 prizes: twice 1/3 for physics). The most successful family were the Curies (2.5 prizes: M. Curie’s 0.25 for physics, the rest in chemistry: 1.0 for herself, 0.25 for her husband; 0.5 for I. Joliot-Curie, 0.5 for her husband).
Universities. Originally we intended to plot evolving Nobel Prize shares of universities as well. To avoid a misleading university ranking, however, we refrained from doing this—the Nobel Foundation only lists affiliations of laureates at the moment they received their award, although their prize-winning breakthroughs were often achieved elsewhere before the listed university hired them. Additional research is necessary to create fair university rankings taking into account where the distinguished work really took place, and where the laureates received which part of their education.
Summary. We discussed the growing number of laureates per Nobel Prize, and traced patterns of brain drain and brain gain in the 20th century by comparing the temporal evolution of national Nobel Prize shares by country of birth and by citizenship.
Reference: http://nobelprize.org, retrieved March 2010. (For each laureate this web site used to provide prize fraction, nationalities, and country of birth where different from country of citizenship.)
HTML version of this paper: http://www.idsia.ch/~juergen/nobelshare.html