Local helioseismic and spectroscopic analyses of interactions between acoustic waves and a sunspot
Abstract
Using a high cadence imaging spectropolarimetric observation of a sunspot and its surroundings in magnetically sensitive (Fe i 6173 Å ) and insensitive (Fe i 7090 Å ) upper photospheric absorption lines, we map the instantaneous wave phases and helioseismic travel times as a function of observation height and inclination of magnetic field to the vertical. We confirm the magnetic inclination angle dependent transmission of incident acoustic waves into upward propagating waves, and derive (1) proof that helioseismic travel times receive direction dependent contributions from such waves and hence cause errors in conventional flow inferences, (2) evidences for acoustic wave sources beneath the umbral photosphere, and (3) significant differences in travel times measured from the chosen magnetically sensitive and insensitive spectral lines.
1 Introduction
Accounting for directly observable photospheric wave evolution within a sunspot while inferring subsurface conditions is an important and challenging problem in the seismology of sunspots (Bogdan et al., 1998). The characteristic association between non-vertical magnetic fields and acoustic wave propagation at frequencies well below the photospheric acoustic cutoff of 5.2 mHz, observed in sunspot penumbrae (McIntosh & Jefferies, 2006; Rajaguru et al., 2007) as well as in disparate wave dynamical phenomena in the solar atmosphere (De Pontieu et al., 2004, 2005; Jefferies et al., 2006; de Wijn et al., 2009) has further highlighted this problem. Several indirect influences, due to physical (Woodard, 1997; Bogdan et al., 1998) as well as analysis specific reasons (Rajaguru et al., 2006; Parchevsky & Kosovichev, 2007), of p-mode absorption (Braun et al., 1987) per se have been shown to manifest as apparent flow and wave speed signals in local helioseismic measurements; however, there have been none studying the direct contributions of propagating waves. The ”inclined magnetic field effect” in helioseismic signatures (Schunker et al., 2005; Zhao et al., 2006) has indeed been shown to arise from magnetic-field-aligned wave motion caused by an incident acoustic wave, but the interpretations relied on a viewing-angle-dependent geometric relation between the magnetic field and wave motion, whose phase shifts are independent of those arising from wave progression in height. Viewing-angle-dependent changes in observation height too could cause different wave phases at different positions within a sunspot and potentially could be misinterpreted as the above effect, as suggested by Rajaguru et al. (2006).
In this Letter, we derive explicit observational proofs for helioseismic contributions from propagating waves within a sunspot and from acoustic sources located beneath its umbral photosphere. We also show significant differences in travel times measured using velocity data from magnetic and non-magnetic lines.
2 Observations and Analysis Methods
We performed imaging spectropolarimetry using the Interferometric BI-dimensional Spectrometer (IBIS) installed at the Dunn Solar Telescope of the National Solar Observatory, Sac Peak, New Mexico, USA. IBIS has spectral and spatial resolutions of 25 mÅ and 0”.165, respectively, and has a 80” diameter (60 Mm) circular field of view (FOV). We observed a medium sized sunspot (NOAA AR10960, diameter 18 Mm) located close to the disk center (S07W17) on 2007 June 8. Our observations involved scanning and imaging in all the Stokes profiles () of magnetic Fe i 6173.34 Å and in Stokes of non-magnetic Fe i 7090.4 Å , with a cadence of 47.5 s. A 7 hr continuous observation was chosen for our analysis. The spectral images were dark subtracted, flat-fielded, and re-registered to remove atmospheric distortions, which were derived from white-light images recorded simultaneously. The spectral calibration consisted of removing a quadratic center-to-edge wavelength dependence, and correcting for the transmission profiles of the prefilters. Polarization calibration of the magnetic line data was based on the telescope and instrument polarization matrices (Cavallini, 2006).
Similar to Rajaguru et al. (2007), we extract line-of-sight (LOS) velocities of plasma motions within the line forming layers from the Doppler shifts of line bisectors. We use 10 bisector levels with equal spacing in line intensity, ordered from the line core (level 0) to the wings (level 9), and derive 10 velocity data cubes, , for each line. For the magnetic line, we use the average of bisector velocities from the left () and right () circular polarization (CP) profiles (Sankarasubramanian & Rimmele, 2002; del Toro Iniesta, 2003) and those from the profile for the non-magnetic line. The 10 bisector levels span the height range within the line formation region in an unique one-to-one way. Based on the Maltby-M umbral model atmosphere (Maltby et al., 1986), the Fe i 6173.34 Å line formation is reported to span a height range of 20 km (wings) to 270 km (line core) above continuum optical depth =1 level (Norton et al., 2006), and a very similar range for Fe i 7090.4 Å (Straus et al., 2008). We choose about 1 hr long observation from the best seeing interval (the first 3 hr), and do Milne-Eddington (M-E) inversions of the (temporal) average of Stokes profiles of the magnetic line to obtain magnetic field , its LOS inclination and azimuth (Skumanich & Lites, 1987). Because of low polarization signals, the above inverted quantities are noisy outside of the sunspot (see Figure 1), and we cut out only the spot region for use in our analysis.
2.1 Instantaneous Wave Phases and Helioseismic Travel Times
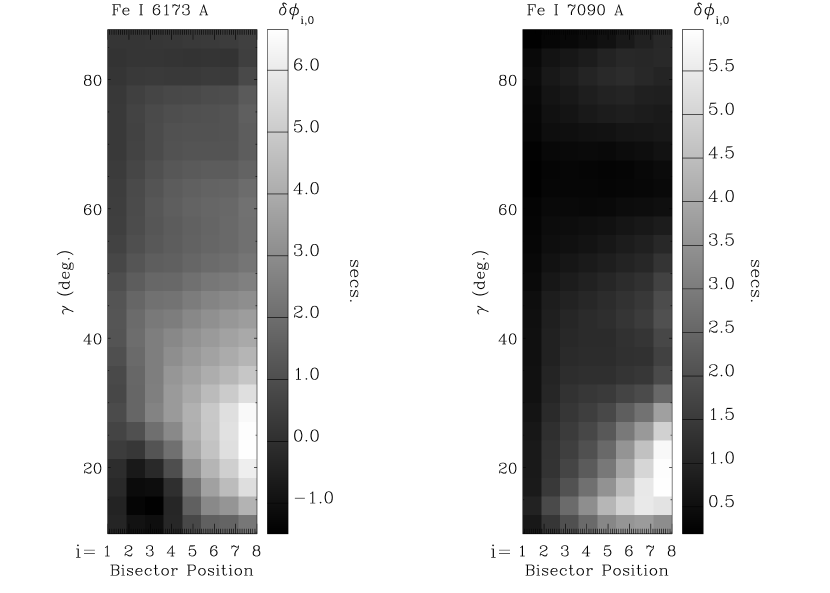
Instantaneous wave phases in the form of phase shifts =Phase[], where is the cyclic frequency of a wave and is the Fourier transform of , due to wave progression between two heights corresponding to any one of the bisector levels and level (the top most layer) are calculated (Rajaguru et al., 2007). Since we want to study mainly the -modes and compare with helioseismic travel times, we filter out the -mode. We take median values of over the -mode band (2 - 5 mHz) or over bands of 1 mHz full width at half-maximum (FWHM) centered at every 0.25 mHz (to study any frequency dependence). Signals over space are studied using or LOS magnetic field . For this work we focus on studying the dependence of and use 3∘ bins in (see Section 2.2 below).
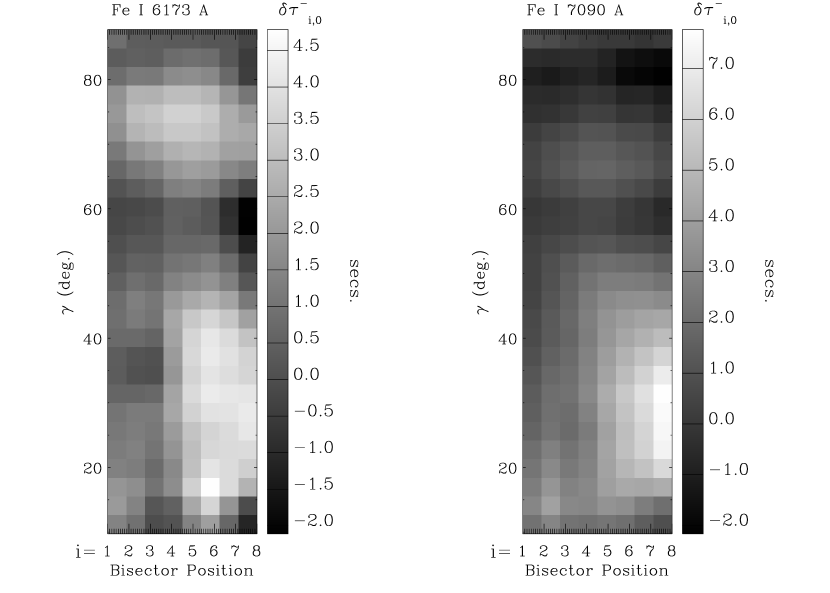
The 10 different data cubes from each line are run through a standard -mode time-distance analysis procedure in center-annulus geometry (Rajaguru et al., 2004). In addition, we apply frequency filters the same way as for . Travel time maps are calculated for five travel distances and Mm (see Couvidat & Birch (2009) for details on phase speed filters). For this Letter, we focus on analyzing the results for Mm, because, given the sizes of observed region (radius 29 Mm) and the spot (radius 9 Mm), this is the optimum that facilitates distinguishing clearly the ingoing and outgoing waves in the sense of their interactions with the spot. We also perform a double-skip annulus-annulus geometry measurement, for Mm, which avoids use of oscillation signals within the sunspot, for the diagnostic checks presented in Section 4. Height dependent contributions to outgoing and ingoing phase travel times and from within the line forming layers are determined using (). To facilitate comparisons with , we average too over 3∘ bins of . All pixels outside of 10 Mm radius centered on the spot, for convenience (in Figures 2 - 4), are assigned a value of 90∘; all wave quantities averaged over these set of pixels are taken as that of ’quiet-Sun’, and a subscript is used, where necessary, to identify them explicitly.
2.2 Error Analysis
The oscillation signals are inherently stochastic due to such nature of acoustic sources and that of the background medium. A typical measurement of a wave quantity, hence, here either in or , carries a random error. Assuming that all pixels with the same or within a small range of comprise independent measurements of the same and , we take the mean over these pixels as our best estimate and study its variation against . Error estimates for from M-E inversions fall in the range of 0∘.85 - 2∘, with mean values of 1.5∘ over the umbra and 1∘ over the penumbra. A bin size of 3∘ in , referred to in previous subsection, is found to be optimal to accumulate a statistical sample of measurements while being small enough to not bias them through their variation against itself. So, error estimates for the means or are their standard errors given by , where is the standard deviation in number of measurements (i.e. pixels falling within a given bin in ).
3 Origin and Seismic Contributions of Propagating Waves
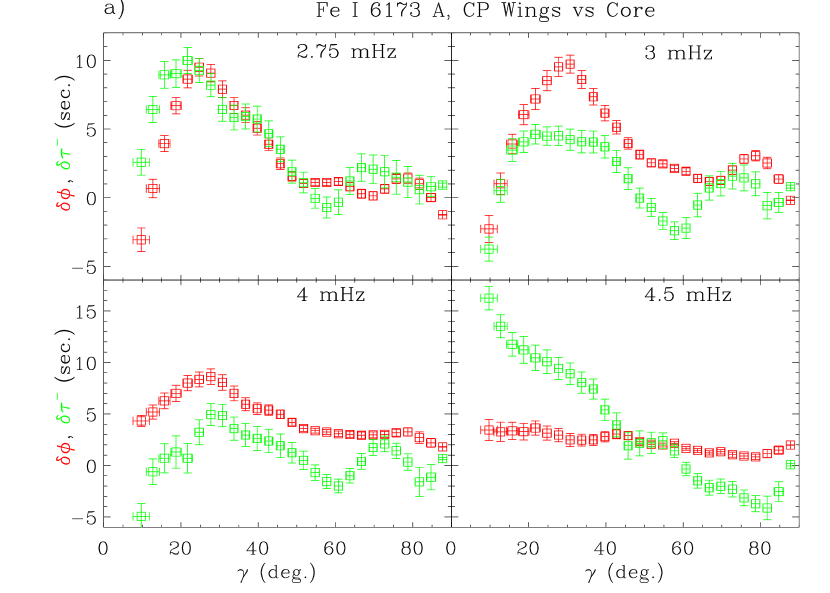
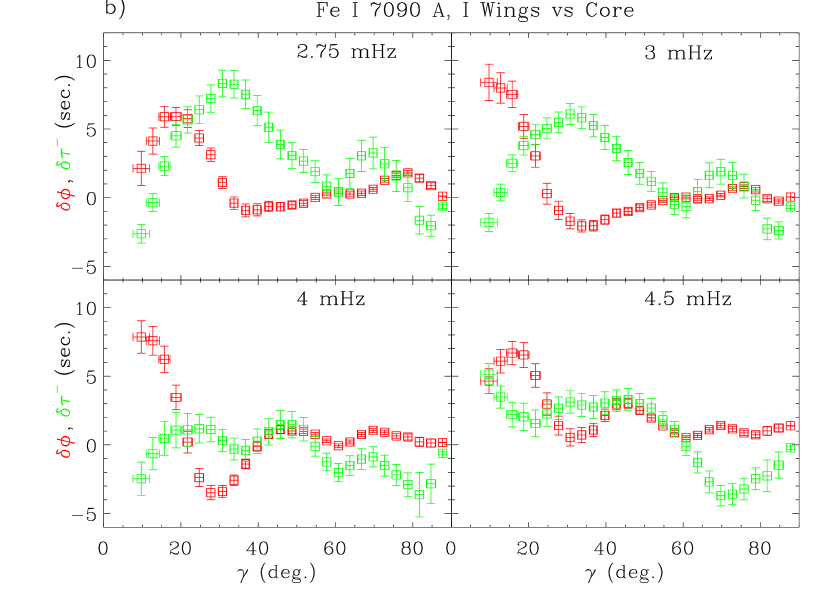
Oscillation signals in photospheric Doppler velocities, in general, would consist of evanescent waves caused by the -modes trapped below it and various propagating waves traveling in different directions. The arise only due to the latter propagating waves. The surface- (-mode) and atmospheric-gravity waves also show vertical phase propagation in the photospheric layers, but we have filtered them out here in our analysis. In general, should receive contributions from waves locally generated and those generated elsewhere (e.g., from the quiet-Sun) but get ”converted” by the magnetic field to propagate upwards upon incident on it. On the other hand, the ingoing travel times get contributions solely from the latter helioseismic ones, which in our current analysis case are those traveling from a distance of 16.95 Mm in regions surrounding the spot. We show in Figure 2 and , due to wave evolution within the region bounded by the wing (level 8) and core (level 0) formation heights, against . The values marked in the panels of Figure 2 are the central frequencies of 1 mHz band filters used. Keeping in mind that have contributions from a larger set of waves (as discussed above), results in Figure 2(a) for the magnetic line show a surprising amount of correlation between the two measurements, and moreover exhibit a strikingly similar dependence. These results immediately reveal several interesting aspects of magnetic field - acoustic wave interactions: (1) first of all they confirm that helioseismic waves incident on the sunspot see themselves through to higher layers of its atmosphere with a striking dependence on : a coherent transmission of incident waves happen, peaking around 30∘, maintaining a smooth evolution of time-distance correlations; (2) remembering that CP profiles of the magnetic line have maximum sensitivities for velocities within vertical magnetic field, it is seen that a large fraction of waves propagating upward within such field are due to helioseismic waves originating at distant locations; and, (3) provide direct evidences that ingoing wave travel times would cause observing height dependent signals in flow inferences from travel time differences. The non-magnetic line (Figure 2(b)) yields very little correlations between and ; however, the helioseismic measurements agree well with that in Figure2(a), except at high , thus reinforcing inferences (1) and (3). We speculate that there are substantial wave motions, locally generated, perhaps within the non-magnetic gaps or weakly magnetized penumbral region, whose signatures are missed in the CP profiles of the magnetic line. At 4 mHz, helioseismic signatures within the sunspot get markedly different in magnetic and non-magnetic lines.
To affirm the reader that the signals analyzed in Figure 2 (as well as other Figures) are due to the height evolution of wave phases and not due to any other wave correlations, random or spurious, in Figure 5 we show maps of and for the full -mode band (2 - 5 mHz), whose variations against are in the -direction of the maps. The gradual increase in the values of and with that in height separation is obvious in this figure. We further note that halving the bin size in to 1.5∘ changes negligibly the mean values and and their variation against studied in this work, but increases their error estimates by roughly times.
4 Wave Sources Beneath Umbral Photosphere
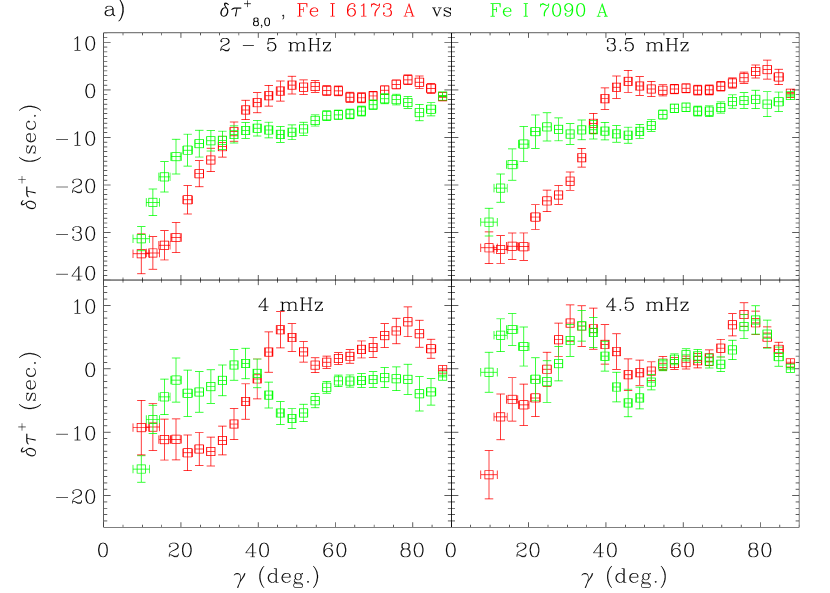
Outgoing waves at a given measurement location, in general, would consist of those locally generated and those generated elsewhere undergoing reflection at the photosphere directly below it. These latter component would be seen in neither nor , as they are evanescent at the observing height. For locally generated waves, circular wavefronts from a source, while their upward propagating parts see themselves up through the magnetic field, would cause outgoing wave correlations yielding distinct signatures in (see Figure 3(b)). Results in Figure 3(a), for from both the magnetic and non-magnetic lines, do indeed provide such a diagnostic: outgoing waves starting at higher height (line core) within the sunspot atmosphere and reaching the quiet-Sun at the chosen have shorter travel times than those starting at a lower height (line wings) and reaching the same quiet-Sun location; since this is simply not possible, the only explanation for this observation is the one contained in our previous sentence and illustrated in Figure 3(b), viz., outgoing wave time-distance correlations are predominantly due to waves directly from sources just beneath the sunspot photosphere when oscillations observed within it are used. We also note the different dependence of , as compared to that of , possibly due to circular wavefronts from local sources having a range of incident angles with the magnetic field.
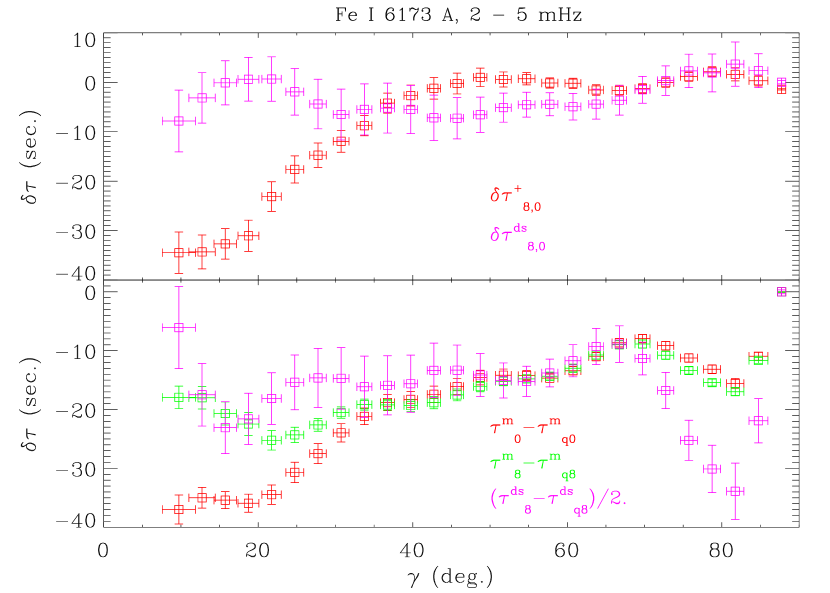
To confirm the above and to check the extent of contributions from magnetic patches surrounding the spot, we measured travel times in double-skip annulus-annulus geometry that avoids waves observed within the sunspot. Here, diametrically opposite points on the annulus are correlated and azimuthally averaged; hence only the mean travel times are measured and assigned to the center points, directly beneath which the waves reflect between their two skips. The results in Figure 4 show that are indeed small, compared to . Hence, the small scale magnetic patches surrounding the spot do not contribute much to and hence to too, validating our inferences above and in Section 3. As to magnitudes of (Figures 3a and 4), it is interesting to note that they are about thrice those of (Figure 2) (in the main -mode band of 2 - 4 mHz). This difference could arise from non-circular expansion of wavefronts possibly due to two causes: (1) the differences in physical conditions, due to material flows as well as sound speed, in the wave path regions Hc-Hw and H-H (refer to Figure 3(b)), and (2) the motion of the sources beneath the umbral photosphere. In the lower panel of Figure 4, we compare mean travel time perturbations measured from line core and wing bisector velocities, - and -, with those of half the double-skip travel times, (-)/2, from wing bisector velocities. Interestingly, almost all the differences between double- and single-skip travel times appear to come from the line formation layers, and hence are observation height dependent. These results also show that height difference between the source location and the wave reflection layer beneath the spot are very small.
5 Discussions and conclusion
Almost all time-distance helioseismic analyses proceed under the working assumption that wave signals at observation heights are evanescent and hence oppositely directed wave paths involving photospheric reflections at two separated points are of identical path length. This assumption is basic to the inferences on flows and wave speed from travel time differences and mean, respectively. In an early theoretical study, accompanied by attempts to model the helioseismic observations of Braun (1997), Bogdan et al. (1998) showed the influences of both the -mode forcing of, and spontaneous emissions by, sunspots on acoustic wave travel times. Our analyses here have yielded transparent observational proofs for both effects, for the first time, with important new perspectives: (1) the process of transformation of incident acoustic waves into propagating (magneto)-acoustic waves up through the magnetic field happen in a coherent manner allowing a smooth evolution of time-distance correlations and, in agreement with several recent theoretical and numerical studies (Cally, 2005; Crouch & Cally, 2005; Schunker et al., 2006), this process depends on the inclination angle () of magnetic field to the vertical, and (2) outgoing waves from acoustic sources located just beneath the sunspot photosphere add important additional contributions for both mean travel times and differences. Our results have also shown observational prospects for consistently accounting for the above effects in sunspot seismology, viz. the indispensability of imaging spectroscopy to extract wave fields so as to be able to correctly account for the wave evolution within the directly observable layers of sunspot atmosphere. Current limitations in making such observations over large enough FOV do not allow us to perform seismic inversions reliably. However, the analysis methods followed here point ways to a consistent and much improved observational determinations of structure and flows beneath sunspots once our instrumental capabilities improve. These observational avenues also promise a close scrutiny of various theoretical ideas and models of acoustic wave - magnetic field interactions and those of the associated MHD waves and their propagation characteristics.
References
- Bogdan et al. (1998) Bogdan, T.J., Braun, D.C., Lites, B.W., & Thomas, J.H. 1998, ApJ, 492, 379
- Braun (1997) Braun, D.C. 1997, ApJ, 487, 447
- Braun et al. (1987) Braun, D.C., Duvall, T.L., Jr., & LaBonte, B.J. 1987, ApJ, 319, L27
- Cally (2005) Cally, P.S. 2005, MNRAS, 358, 353
- Cavallini (2006) Cavallini, F. 2006, Sol. Phys., 236, 415
- Couvidat & Birch (2009) Couvidat, S. & Birch, A.C. 2009, Sol. Phys., 257, 217
- Crouch & Cally (2005) Crouch, A.D. & Cally, P.S. 2005, Sol. Phys., 227, 1
- del Toro Iniesta (2003) del Toro Iniesta, J. C. 2003, Introduction to Spectropolarimetry, Cambridge Univ. Press, p.149-164, Cambridge
- De Pontieu et al. (2004) De Pontieu, B., Erdelyi, R., & James, Stewart P. 2004, Nature, 430, 536
- De Pontieu et al. (2005) De Pontieu, B., Erdelyi, R., & De Moortel, I. 2005, ApJ, 624, L61
- de Wijn et al. (2009) de Wijn, A.G., McIntosh, S.W., & De Pontieu, B. 2009, ApJ, 702, L168
- Jefferies et al. (2006) Jefferies, J. et al. 2006, ApJ, 648, L151
- Maltby et al. (1986) Maltby, P. et al. 1986, ApJ, 306, 284
- McIntosh & Jefferies (2006) McIntosh, S.W. & Jefferies, S.M. 2006, ApJ, 647, L77
- Norton et al. (2006) Norton, A.A. et al. 2006, Sol. Phys., 239, 69
- Parchevsky & Kosovichev (2007) Parchevsky, K. & Kosovichev, A.G. 2007, ApJ, 666, L53
- Rajaguru et al. (2004) Rajaguru, S.P., Hughes, S.J. & Thompson, M.J. 2004, Sol. Phys., 220, 381
- Rajaguru et al. (2006) Rajaguru, S.P., Birch, A.C., Duvall, T.L., Jr., Thompson, M.J., & Zhao, J. 2006, ApJ, 646, 543
- Rajaguru et al. (2007) Rajaguru, S.P., Sankarasubramanian, K., Wachter, R. & Scherrer, P.H. 2007, ApJ, 654, L175
- Sankarasubramanian & Rimmele (2002) Sankarasubramanian, K. & Rimmele, T. 2002, ApJ, 576, 1048
- Schunker et al. (2005) Schunker, H., Braun, D.C., Cally, P.S., & Lindsey, C. 2005, ApJ, 621, L149
- Schunker et al. (2006) Schunker, H., & Cally, P.S. 2006, MNRAS, 372, 551
- Skumanich & Lites (1987) Skumanich, A., & Lites, B. W. 1987, ApJ, 322, 473
- Straus et al. (2008) Straus, T. et al. 2008, ApJ, 681, L125
- Woodard (1997) Woodard, M.F. 1997, ApJ, 485, 890
- Zhao et al. (2006) Zhao, J., & Kosovichev, A.G. 2006, ApJ, 643, 1317