11email: annan@astro.uni.torun.pl 22institutetext: Department of Physics and Astronomy, MSC07 4220, University of New Mexico, Albuquerque, NM 87131, USA 33institutetext: National Radio Astronomy Observatory, 1003 Lopezville Road, Socorro, NM 87801, USA 44institutetext: Joint Institute for VLBI in Europe, Postbus 2, 7990 AA Dwingeloo, The Netherlands 55institutetext: Sterrewacht Leiden, Leiden University, Postbus 9513, 2300 RA Leiden, The Netherlands 66institutetext: Max-Planck-Insitut für Radioastronomie, Auf dem Hügel 69, 53121 Bonn, Germany 77institutetext: Harvard-Smithsonian Center for Astrophysics, 60 Garden Street, Cambridge, MA 02138, USA
VLA observations of water masers towards 6.7 GHz methanol maser sources
Abstract
Context. 22 GHz water and 6.7 GHz methanol masers are usually thought as signposts of early stages of high-mass star formation but little is known about their associations and the physical environments they occur in.
Aims. To obtain accurate positions and morphologies of the water maser emission and relate them to the methanol maser emission recently mapped with Very Long Baseline Interferometry.
Methods. A sample of 31 methanol maser sources was searched for 22 GHz water masers using the VLA and observed in the 6.7 GHz methanol maser line with the 32 m Torun dish simultaneously.
Results. Water maser clusters were detected towards 27 sites finding 15 new sources. The detection rate of water maser emission associated with methanol sources was as high as 71%. In a large number of objects (18/21) the structure of water maser is well aligned with that of the extended emission at 4.5 m confirming the origin of water emission from outflows. The sources with methanol emission with ring-like morphologies, which likely trace a circumstellar disk/torus, either do not show associated water masers or the distribution of water maser spots is orthogonal to the major axis of the ring.
Conclusions. The two maser species are generally powered by the same high-mass young stellar object but probe different parts of its environment. The morphology of water and methanol maser emission in a minority of sources is consistent with a scenario that 6.7 GHz methanol masers trace a disc/torus around a protostar while the associated 22 GHz water masers arise in outflows. The majority of sources in which methanol maser emission is associated with the water maser appears to trace outflows. The two types of associations might be related to different evolutionary phases.
Key Words.:
stars: formation – ISM: molecules – masers – techniques: interferometric1 Introduction
Studies of high-mass star forming regions (HMSFRs) are difficult but important in astrophysics as they are responsible for many of the energetic phenomena we see in galaxies. However, their large distances, heavy obscuration and rapidity of evolution make observations challenging. Maser emission has become a unique tool to study massive star formation. Methanol masers at 6.7 GHz as well as water masers at 22 GHz have been recognized as tracers of massive star formation (e.g., Caswell et al. caswell95 (1995); Menten menten91 (1991); Sridharan et al. sridharan02 (2002); Urquhart et al. urquhart10 (2010)). Moreover, both maser species are found associated with the very early stage of a protostar, when it still accretes and before it begins to ionise the surrounding medium. These masers are often detectable before an ultra–compact H II region is seen at cm wavelengths.
Studies of maser emission at milliarcsecond scale, using Very Long Baseline Interferometry (VLBI) techniques, reveal a wide range of morphologies of 6.7 GHz methanol masers. They can form simple structures (a single spot), lie in linear structures or arcs, or are distributed randomly without any apparent regularity (e.g., Minier et al. minier00 (2000); Norris et al. norris98 (1998); Phillips et al. phillips98 (1998); Walsh et al. walsh98 (1998)). However, it is still unclear where and how they are produced. Are they related with disks/tori around young massive protostars or found in outflows or shocks? (e.g., Dodson et al. dodson04 (2004); Minier et al. minier00 (2000); Walsh et al. walsh98 (1998)). Detailed studies of particular sources reveal further clues to the origin of methanol masers. Unfortunately, they are not always consistent with one scenario. High angular resolution mid-infrared (MIR) observations by De Buizer & Minier (debuizer05m (2005)) revealed that the outflow scenario is more plausible in the case of NGC 7538 IRS 1, where the linear structure of methanol masers had been suggested as originating in an edge-on Keplerian disc (Pestalozzi et al. pestalozzi04 (2004)). On the other hand, van der Walt et al. (walt07 (2007)) argued that a simple Keplerian-like disc model was more consistent with the observed kinematics of methanol maser spots in linear structures than the shock model proposed by Dodson et al. (dodson04 (2004)).
A relatively high detection rate of water masers toward methanol masers is confirmed with single-dish studies. Szymczak et al. (szymczak05 (2005)) observed 79 targets with 6.7 GHz methanol maser emission and detected the 22 GHz water line in 52% cases. Similarly, Sridharan et al. (sridharan02 (2002)) reported a detection rate of 42% for the sample of 69 HMSFRs. In interferometric investigations Beuther et al. (beuther02 (2002)) obtained a 62% detection rate of water masers toward methanol masers. Recently, Breen et al. (breen10 (2010)) searched 379 water masers and found methanol emission in % of the sources. Although different excitation conditions are required for both molecules, their origin is in some sense dependent and likely related to the same powering source.
There are few HMSFRs with detailed studies of methanol–water maser associations. For example Pillai et al. (pillai06 (2006)) observed the HMSFR G11.110.12 over a wide wavelength range. They reported that methanol masers were associated with an accretion disc driving an outflow traced by water maser emission. Moscadelli et al. (moscadelli07 (2007)) explored HMSFR G24.780.08 and showed that water masers trace a fast expanding shell closely surrounding a hyper-compact H II region. Methanol masers were proposed to have emerged in a rotating toroid lying radially outward of the H II region. However, there is a lack of data for a large sample of methanol and water masers at high angular resolution with a few mJy sensitivity to get better statistics on the two types of associations.
We have recently completed a survey of 31 sources at 6.7 GHz using the European VLBI Network (EVN) (Bartkiewicz et al. bartkiewicz09 (2009)). Due to the high angular and spectral resolution as well as the high sensitivity we have discovered nine sources (29% of the sample) with ring-like maser distributions (with a typical major axis of 019). These ring-like structures strongly suggest the existence of a central object, and could provide a clue to its nature. Each source with ring-like morphology coincides within 1″ with a MIR object (from the GLIMPSE survey) that has an excess of 4.5 m emission, which is evidence for shocked regions (e.g., Cyganowski et al. 2008). This suggests that even ring-like structures can arise due to shock waves or in outflows. In order to answer the question what are these structures?, we initiated wide and detailed studies of that sample of methanol maser sources. Here, we present the first results of our investigation of the presence, position, and distribution of water maser emission toward 6.7 GHz methanol maser emission. We used the NRAO Very Large Array (VLA) to search for water masers near the locations of 6.7 GHz methanol masers and, if detected, to compare the positions of the two masing species.
2 Observations and data reduction
2.1 VLA observations
To investigate the relationship between water and methanol masers in HMSFRs, our sample of 31 methanol maser sources (Table 1) was observed at 22.23508 GHz using the VLA in CnB configuration in two 12 h runs on 2009 June 4 and 5 (the project AB1324). A spectral line mode with a single IF and 6.25 MHz bandwidth divided into 128 spectral channels was used, yielding a velocity coverage of 84 km s-1 and a channel spacing of 0.65 km s-1. The pointing positions were defined as the coordinates of the brightest 6.7 GHz methanol maser component (Table 1) and the bandpass was centred at the methanol maser peak velocity taken from Bartkiewicz et al. (bartkiewicz09 (2009), their Table 5). 3C 286 was used as the primary flux density calibrator for all targets. We used two secondary calibrators (J18510035 and J18321035) to monitor changes in interferometer amplitude and phase; these were selected from the VLA calibrator catalog to be near the targets (Table 1). We allocated 50 s for observation of the secondary calibrator, followed by 250 s for the maser source. These times included slew and on-source integration times. In total each target was observed for 35 min, resulting in about 29 min on-source integration time.
The data reduction was carried out following the standard recipes recommended in Appendix B of the AIPS cookbook111See http://www.nrao.edu/aips/coobook.html. The amplitude and phase errors of 3C 286 were corrected using the default source model and 3C 286 was subsequently used to derive the secondary-calibrator flux densities. The antenna gains were calibrated using the secondary-calibrator data. A few bad data points were flagged and images (512512 pixels with pixel size of 015) were created using natural weighting. The noise levels in the maps and the synthesized beams are listed in Table 1. The analysis of maser properties was carried out using maps centred on the position of the brightest water maser spots.
We estimate that, with the relatively stable weather conditions during our observations, position errors of water maser spots are dominated by the errors of the secondary-calibrator positions, which could be as large as 015 for these two calibrators. However, the relative position uncertainties are much better (10 mas).
2.2 32 m dish observations
The same sample was observed in the 6.7 GHz methanol maser line using the Torun 32 m telescope over 20 days in June 2009 nearly simultaneously with the VLA H2O observations. The telescope characteristics and calibration procedures were described in Szymczak et al. (szymczak02 (2002)). The spectra were taken in frequency switching mode with a resulting spectral channel spacing of 0.04 km s-1 and sensitivity of 0.6 Jy (3). The accuracy of the absolute flux density calibration was better than 15%.
| Source∗ | Position of 6.7 GHz masers | Vp | Secondary calibrator | Synthesized beam | Rms noise | |
|---|---|---|---|---|---|---|
| Gll.lllbb.bbb | RA(h m s) | Dec(° ′ ″) | (km s-1) | calibrator | maj, min; PA (″, ″;o) | per channel (mJy beam-1) |
| G21.40700.254 | 18 31 06.33794 | 10 21 37.4108 | 89.0 | J18321035 | 1.19, 0.49;61 | 2 |
| G22.33500.155 | 18 32 29.40704 | 09 29 29.6840 | 35.6 | J18321035 | 1.07, 0.72;48 | 4 |
| G22.35700.066 | 18 31 44.12055 | 09 22 12.3129 | 79.7 | J18321035 | 1.36, 0.73;39 | 3 |
| G23.20700.377 | 18 34 55.21212 | 08 49 14.8926 | 77.1 | J18321035 | 1.05, 0.85;2 | 4 |
| G23.38900.185 | 18 33 14.32477 | 08 23 57.4723 | 75.4 | J18321035 | 0.88, 0.84;83 | 3 |
| G23.65700.127 | 18 34 51.56482 | 08 18 21.3045 | 82.6 | J18321035 | 1.03, 0.55;77.5 | 3 |
| G23.70700.198 | 18 35 12.36600 | 08 17 39.3577 | 79.2 | J18321035 | 1.22, 0.84;37 | 4 |
| G23.96600.109 | 18 35 22.21469 | 08 01 22.4698 | 70.9 | J18321035 | 1.70, 0.72;44 | 5 |
| G24.14800.009 | 18 35 20.94266 | 07 48 55.6745 | 17.8 | J18321035 | 1.65, 0.52;60 | 4 |
| G24.54100.312 | 18 34 55.72152 | 07 19 06.6504 | 105.7 | J18321035 | 1.89, 0.74;48 | 6 |
| G24.63400.324 | 18 37 22.71271 | 07 31 42.1439 | 35.4 | J18321035 | 2.82, 0.60;42 | 3 |
| G25.41100.105 | 18 37 16.92106 | 06 38 30.5017 | 97.3 | J18321035 | 0.35, 0.35;45 | 3 |
| G26.59800.024 | 18 39 55.92567 | 05 38 44.6424 | 24.2 | J18321035 | 3.38, 0.65;46 | 3 |
| G27.22100.136 | 18 40 30.54608 | 05 01 05.3947 | 118.8 | J18321035 | 1.20, 0.89;47 | 5 |
| G28.81700.365 | 18 42 37.34797 | 03 29 40.9216 | 90.7 | J18510035 | 4.56, 0.62;41 | 4 |
| G30.31800.070 | 18 46 25.02621 | 02 17 40.7539 | 36.1 | J18510035 | 1.48, 0.71;38 | 3 |
| G30.40000.296 | 18 47 52.29976 | 02 23 16.0539 | 98.5 | J18510035 | 1.36, 0.64;45 | 4 |
| G31.04700.356 | 18 46 43.85506 | 01 30 54.1551 | 80.7 | J18510035 | 1.02, 0.82;44 | 3 |
| G31.58100.077 | 18 48 41.94108 | 01 10 02.5281 | 95.6 | J18510035 | 0.96, 0.88;50 | 2 |
| G32.99200.034 | 18 51 25.58288 | 00 04 08.3330 | 91.8 | J18510035 | 0.92, 0.82;39 | 3 |
| G33.64100.228 | 18 53 32.563 | 00 31 39.180 | 58.8 | J18510035 | 1.01, 0.83;57 | 5 |
| G33.98000.019 | 18 53 25.01833 | 00 55 25.9760 | 58.9 | J18510035 | 1.03, 0.80;58 | 4 |
| G34.75100.093 | 18 55 05.22296 | 01 34 36.2612 | 52.7 | J18510035 | 1.02, 0.81;60 | 5 |
| G35.79300.175 | 18 57 16.894 | 02 27 57.910 | 60.7 | J18510035 | 1.15, 0.80;53 | 4 |
| G36.11500.552 | 18 55 16.79345 | 03 05 05.4140 | 73.0 | J18510035 | 1.46, 0.70;51 | 5 |
| G36.70500.096 | 18 57 59.12288 | 03 24 06.1124 | 53.1 | J18510035 | 2.09, 0.65;48 | 3 |
| G37.03000.039 | 18 59 03.64233 | 03 37 45.0861 | 78.6 | J18510035 | 2.05, 0.72;42 | 6 |
| G37.59800.425 | 18 58 26.79772 | 04 20 45.4570 | 85.8 | J18510035 | 2.36, 0.64;42 | 6 |
| G38.03800.300 | 19 01 50.46947 | 04 24 18.9559 | 55.7 | J18510035 | 2.74, 0.65;48 | 5 |
| G38.20300.067 | 19 01 18.73235 | 04 39 34.2938 | 79.6 | J18510035 | 2.11, 0.78;47 | 10 |
| G39.10000.491 | 19 00 58.04036 | 05 42 43.9214 | 15.3 | J18510035 | 2.24, 0.77;46 | 11 |
| ∗ The Galactic coordinates of the brightest 6.7 GHz methanol maser spots (Bartkiewicz et al. bartkiewicz09 (2009)) | ||||||
3 Results
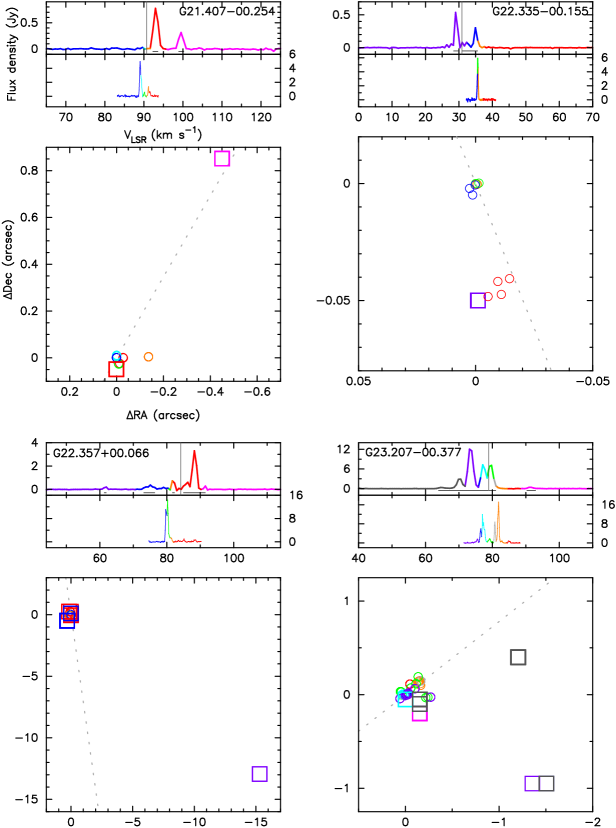
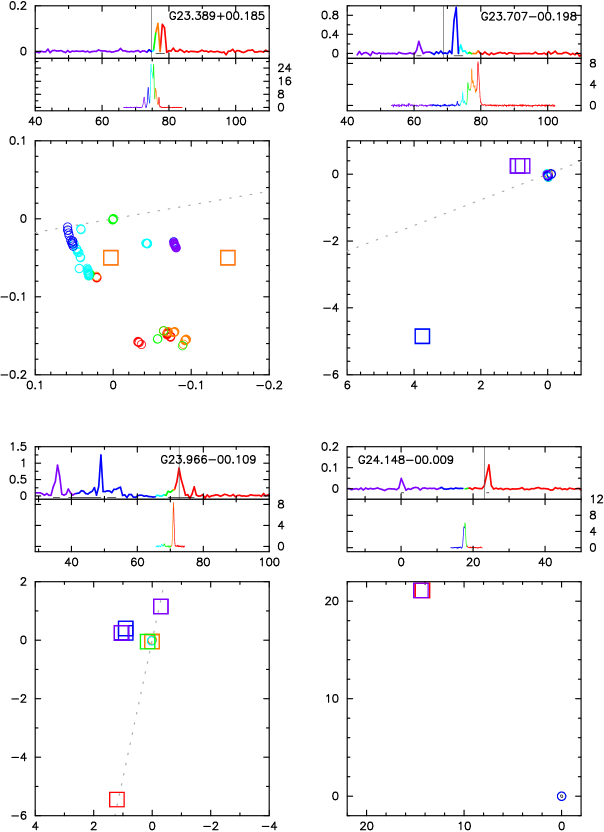
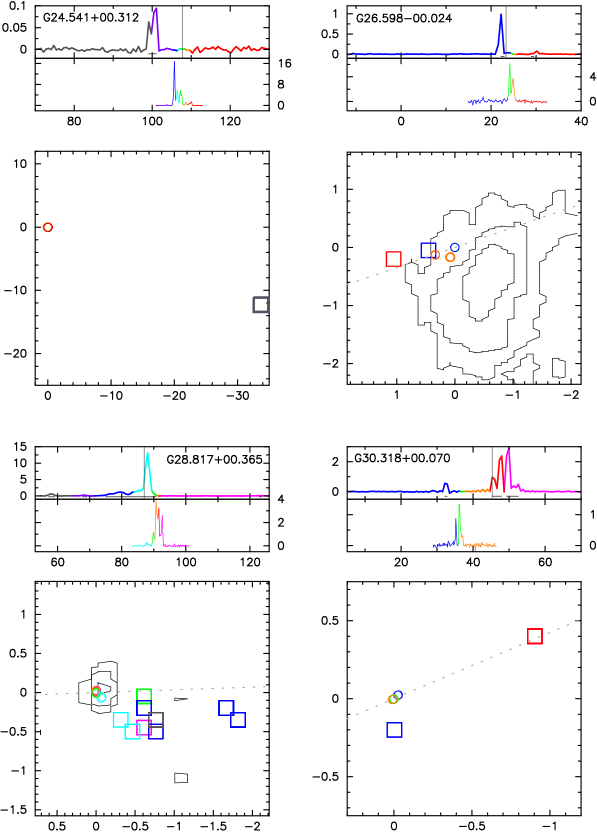
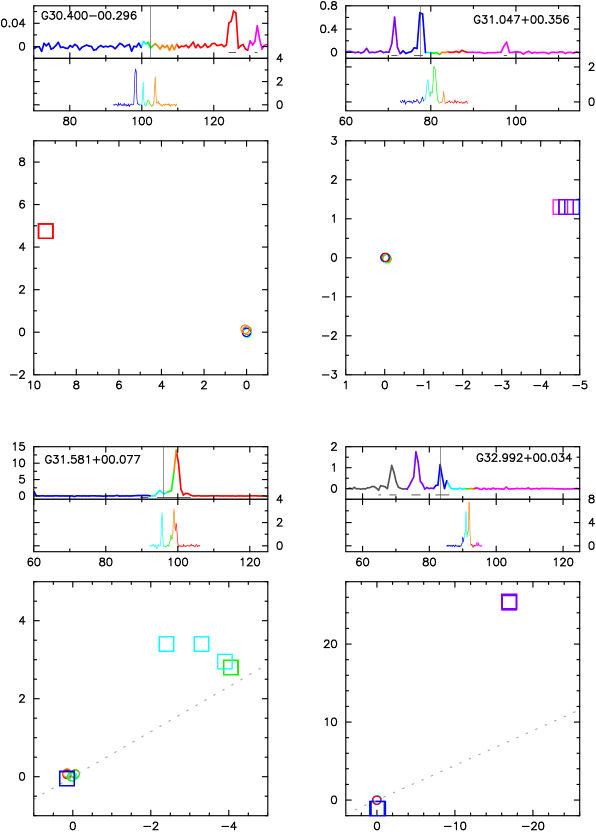
The observational results are summarized in Table 2 and Figure 1. Table 2 lists the coordinates of the brightest water maser spot in each target, the LSR velocity (Vp), and the intensity (Sp) as well as the velocity extent of the water emission (V) and the integrated flux density (Sint). In most cases the Galactic names of the water maser sources are the same as those of the methanol masers in Bartkiewicz et al. (bartkiewicz09 (2009)). However, for five water maser sources the names are updated (marked by 1) as their positions differ by more than 36 (0001) from the methanol maser positions. The two columns of Table 2, , give the angular separation of two nearest spots of both species and the corresponding difference in velocity. The last two columns, PA and PAMIR, list position angles of water maser emission and MIR counterpart if it exists (Sect. 3.3). PA is defined as East of North in the whole paper.
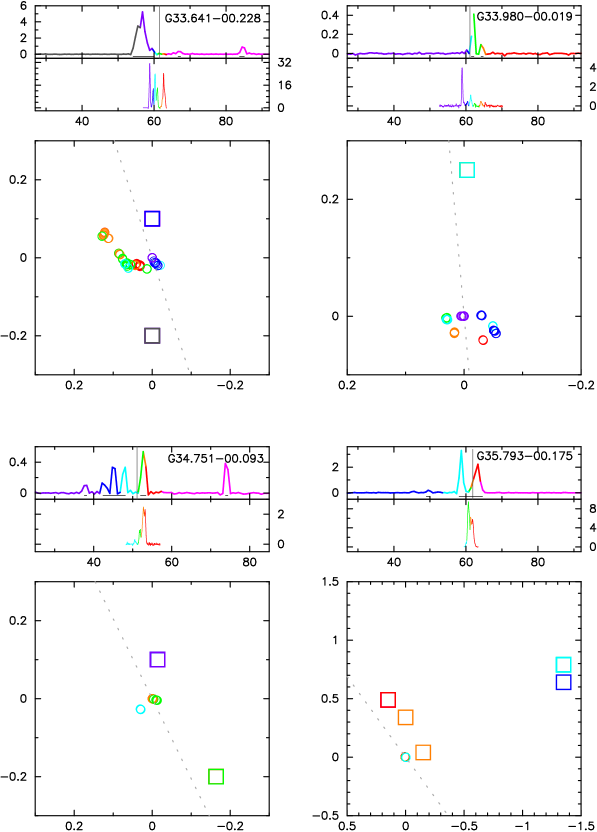
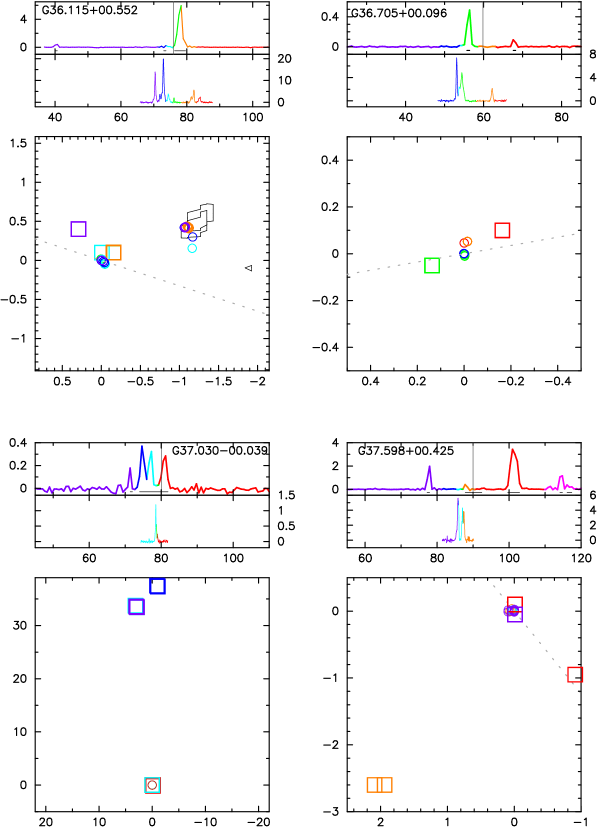
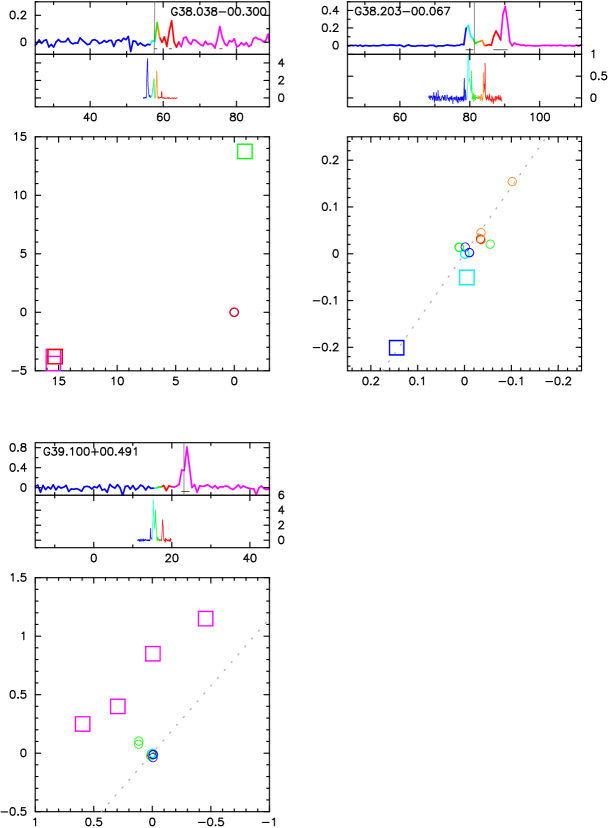
In Figure 1, we present the spectra and angular distributions of the water maser emission for the detected sources. The spectra were extracted from the map data cubes using the AIPS task ISPEC and represent the total flux density of maser emission measured in the maps. All spots detected in each of the individual channel maps are shown. Overlaid are the spectra and distributions of the 6.7 GHz methanol masers as obtained with the EVN (Bartkiewicz et al. bartkiewicz09 (2009)). The parameters of all detected water maser spots of each source are listed in Table 3. Specifically, the position (RA, Dec) relative to the brightest 6.7 GHz methanol maser spot (as listed in Table 1), the LSR velocity (VLSR) and the intensity (S) of the maser spots are given.
Due to the relatively poor spectral resolution of 0.65 km s-1 of our water maser spectra we postpone an analysis of line profiles until follow up VLBI observations when a higher spectral resolution will be used.
| RA(J2000) | Dec(J2000) | Vp | V | Sp | Sint | PA | PAMIR | |||
| Gll.lllbb.bbb | (h m s) | (°′″) | (km s-1) | (km s-1) | (Jy b-1) | (Jy km s-1) | (″) | (km s-1) | (°) | (°) |
| G21.40700.2542 | 18 31 06.3380 | 10 21 37.460 | 92.9 | 7.9 | 0.68 | 1.57 | 0.03 | 2.2 | 27 | 30 |
| G22.33500.1552 | 18 32 29.4070 | 09 29 29.734 | 29.0 | 7.2 | 0.76 | 1.12 | 0.01 | 2.6 | 12 | 22 |
| G22.35700.066 | 18 31 44.1210 | 09 22 12.362 | 88.3 | 30.2 | 3.14 | 7.75 | 0.04 | 1.5 | 29 | 8 |
| G23.20700.377 | 18 34 55.2019 | 08 49 14.943 | 73.2 | 29.0 | 11.46 | 55.8 | 0.06 | 1.2 | 57 | 52 |
| G23.38900.185 | 18 33 14.3250 | 08 23 57.522 | 78.0 | 2.6 | 0.15 | 0.28 | 0.03 | 0.9 | 90 | 80 |
| G23.65700.127 | 0.015 | |||||||||
| G23.70700.1982 | 18 35 12.4165 | 08 17 39.108 | 72.6 | 13.8 | 0.91 | 0.57 | 0.77 | 1.3 | 64 | 69 |
| G23.96600.109 | 18 35 22.2150 | 08 01 22.520 | 48.9 | 42.7 | 1.12 | 5.98 | 0.03 | 1.8 | 13 | 12 |
| G24.15500.0101,2 | 18 35 21.9019 | 07 48 34.575 | 24.4 | 24.4 | 0.17 | 0.20 | 25.5 | 5.3 | ||
| G24.53400.3191 | 18 34 53.4636 | 07 19 19.000 | 101.1 | 2.0 | 0.19 | 0.18 | 35.8 | 2.7 | ||
| G24.63400.324 | 0.015 | |||||||||
| G25.41100.105 | 0.015 | |||||||||
| G26.59800.024 | 18 39 55.9561 | 05 38 44.692 | 22.2 | 7.3 | 1.09 | 0.54 | 0.14 | 3.7 | 76 | 71 |
| G27.22100.136 | 0.025 | |||||||||
| G28.81700.365 | 18 42 37.2368 | 03 29 41.121 | 88.1 | 66.5 | 13.07 | 34.76 | 0.37 | 2.7 | 89 | 88 |
| G30.31800.070 | 18 46 25.0260 | 02 17 40.954 | 49.9 | 20.4 | 2.81 | 9.99 | 0.20 | 4.2 | 56 | 67 |
| G30.40300.2971,2 | 18 47 52.9295 | 02 23 11.303 | 125.5 | 7.9 | 0.08 | 0.17 | 10.5 | 19.8 | ||
| G31.04700.3571,2 | 18 46 43.5549 | 01 30 52.855 | 77.4 | 27.0 | 0.67 | 1.89 | 4.64 | 14.8 | ||
| G31.58100.0772 | 18 48 41.9510 | 01 10 02.578 | 99.5 | 13.8 | 12.55 | 2.22 | 0.11 | 1.8 | 53 | 60 |
| G32.99200.0342 | 18 51 25.5820 | 00 04 07.233 | 76.0 | 20.4 | 1.61 | 0.54 | 1.06 | 3.8 | 90 | 66 |
| G33.64100.228 | 18 53 32.5630 | 00 31 39.130 | 56.8 | 30.9 | 5.12 | 15.4 | 0.10 | 0.7 | 0 | 18 |
| G33.98000.0192 | 18 53 25.0180 | 00 55 26.076 | 62.2 | 3.3 | 0.40 | 0.49 | 0.25 | 2.6 | 1 | 5 |
| G34.75100.0932 | 18 55 05.2220 | 01 34 36.361 | 52.7 | 36.8 | 0.53 | 2.51 | 0.10 | 4.6 | 27 | 26 |
| G35.79300.1752 | 18 57 16.8840 | 02 27 57.950 | 58.7 | 15.1 | 2.39 | 3.53 | 0.16 | 1.3 | 35 | 36 |
| G36.11500.552 | 18 55 16.7830 | 03 05 05.514 | 78.3 | 39.5 | 4.91 | 10.24 | 0.09 | 2.1 | 57 | 72 |
| G36.70500.0962 | 18 57 59.1320 | 03 24 06.062 | 56.4 | 12.5 | 0.55 | 0.71 | 0.15 | 0.9 | 64 | 80 |
| G37.03000.0392 | 18 59 03.6420 | 03 37 45.086 | 81.2 | 10.5 | 0.27 | 0.78 | 0.01 | 1.3 | ||
| G37.59800.425 | 18 58 26.7970 | 04 20 45.407 | 100.9 | 40.2 | 2.91 | 11.69 | 0.05 | 13.9 | 42 | 39 |
| G38.04100.2981,2 | 19 01 50.4088 | 04 24 32.705 | 62.3 | 17.8 | 0.15 | 0.28 | 13.8 | 2.6 | ||
| G38.20300.0672 | 19 01 18.7320 | 04 39 34.243 | 90.1 | 11.9 | 0.63 | 1.54 | 0.05 | 0.7 | 45 | 35 |
| G39.10000.491 | 19 00 58.0601 | 05 42 44.321 | 23.9 | 2.0 | 0.64 | 1.32 | 0.35 | 8.6 | 48 | 41 |
| 1 The position of the H2O maser differs by more than 36 from that of CH3OH maser (Bartkiewicz et al. bartkiewicz09 (2009)) and its name is updated. | ||||||||||
| 2 New detection. | ||||||||||
3.1 Association of water and methanol masers
In the VLA cubes of size 7777, water masers were detected in 27 out of 31 cases, out of which 15 are new detections. A total of 339 distinct maser spots were detected. To define the detection rate of water masers actually associated with the methanol masers, we need to determine their relative separation in physical coordinates. The near-far distance ambiguity is not well resolved for our sources, but it has been argued that the near kinematic distances are more likely (Szymczak et al. szymczak05 (2005)). Recent measurements of trigonometric parallaxes of several methanol sources (Reid et al. reid09 (2009); Rygl et al. rygl10 (2010)) strongly support this assumption. In the following we therefore use only the near kinematic distance estimates, and we calculated them following the prescription given by Reid et al. (reid09 (2009)). The systemic velocities, Vsys, were taken either from the observations of optically thin thermal lines (Szymczak et al. szymczak07 (2007)) or from the mid-range velocity of methanol maser features (Bartkiewicz et al. bartkiewicz09 (2009)). The projected linear separation, (pc), between the nearest spots of the water and methanol emission were then calculated using the angular separation from Table 2. The near kinematic distances for all 31 objects and the linear separations are listed in Table 4.
| Source | Vsys | Dnear | log()a,b | log()c | log() | Class1 | |
| Gll.lllbb.bbb | (km s-1) | (kpc) | (pc) | () | () | () | |
| G21.40700.254 | 90.7 | 5.12 | 0.00074 | 6.02 | 5.34 | C | |
| G22.33500.155 | 30.9 | 2.47 | 0.00012 | 6.79 | 6.04 | L | |
| G22.35700.066 | 84.2 | 4.86 | 0.00094 | 5.37 | 7.03 | 5.58 | C |
| G23.20700.377 | 78.9 | 4.63 | 0.00135 | 4.56 | 5.05 | R | |
| G23.38900.185 | 74.8 | 4.47 | 0.00065 | 6.89 | 5.14 | R | |
| G23.65700.127 | 82.4 | 3.192 | 8.15 | 5.60 | R | ||
| G23.70700.198 | 68.9 | 4.22 | 0.01575 | 6.63 | 6.34 | 5.13 | A |
| G23.96600.109 | 72.7 | 4.37 | 0.00063 | 5.57 | 5.74 | L | |
| G24.14800.009 | 23.1 | 1.92 | 0.23736 | 8.22 | 7.77 | 7.23 | L |
| G24.54100.312 | 107.8 | 5.70 | 0.98931 | 8.30 | 6.92 | 5.17 | A |
| G24.63400.324 | 42.7 | 3.00 | 8.22 | 6.48 | R | ||
| G25.41100.105 | 96.0 | 5.25 | 7.70 | 5.70 | R | ||
| G26.59800.024 | 23.3 | 1.85 | 0.00126 | 7.42 | 6.54 | R | |
| G27.22100.136 | 112.6 | 6.04 | 7.40 | 5.21 | C | ||
| G28.81700.365 | 87.0 | 4.90 | 0.00879 | 4.72 | 6.34 | A/R | |
| G30.31800.070 | 45.3 | 2.97 | 0.00288 | 5.74 | 6.77 | L | |
| G30.40000.296 | 102.4 | 5.76 | 0.29322 | 8.30 | 6.89 | 5.80 | C/R |
| G31.04700.356 | 77.6 | 4.51 | 0.10145 | 6.05 | 6.16 | R | |
| G31.58100.077 | 96.0 | 5.49 | 0.00293 | 4.70 | 5.82 | A/R | |
| G32.99200.034 | 83.4 | 4.88 | 0.02508 | 6.53 | 5.44 | 5.75 | C |
| G33.64100.228 | 61.5 | 3.77 | 0.00183 | 5.30 | 4.88 | A | |
| G33.98000.019 | 61.1 | 3.75 | 0.00455 | 6.80 | 6.35 | R | |
| G34.75100.093 | 51.1 | 3.24 | 0.00157 | 6.22 | 6.35 | R | |
| G35.79300.175 | 61.9 | 3.83 | 0.00297 | 5.56 | 5.53 | L | |
| G36.11500.552 | 76.0 | 4.66 | 0.00203 | 5.29 | 5.29 | P | |
| G36.70500.096 | 59.8 | 3.75 | 0.00273 | 6.64 | 6.40 | C | |
| G37.03000.039 | 80.1 | 5.02 | 0.00024 | 6.34 | 6.30 | 5.47 | S |
| G37.59800.425 | 90.0 | 6.36 | 0.00154 | 4.96 | 6.51 | 5.26 | C |
| G38.03800.300 | 57.5 | 3.66 | 0.24487 | 8.00 | 7.47; 7.10 | 5.96 | C |
| G38.20300.067 | 81.3 | 5.31 | 0.00129 | 6.00 | 5.66 | C | |
| G39.10000.491 | 23.1 | 1.70 | 0.00288 | 7.06 | 6.29 | C | |
| 1 Class of morphology of methanol masers: S – simple, L – linear, R – ring, C – complex, A – arched, | |||||||
| P -pair (Bartkiewicz et al. bartkiewicz09 (2009)). | |||||||
| 2 Distance based on the trigonometric parallax (Bartkiewicz et al. bartkiewicz08 (2008)). | |||||||
| a Luminosity of water maser associated with the methanol source. In a few cases (e.g., G22.35700.066) | |||||||
| only some spots lie in close surrounding of methanol emission (Fig. 1). | |||||||
| b The upper limit is marked by symbol . It means we did not register the water maser spots coinciding | |||||||
| with methanol masers. | |||||||
| c Luminosity of water maser unassociated or likely unassociated with methanol source. | |||||||

For the majority of the detections (22 of 27), the methanol emission is displaced by less than 0.026 pc with a median value of 0.0017 pc (Table 4, Fig. 2). In these sources the velocity difference between the nearest spots of both masers ranges from 0.7 to 13.9 km s-1, with a median value of 1.95 km s-1. The intrinsic separation of the water and methanol spots may be slightly different because the position uncertainty of 015 results in 0.0020.005 pc displacement for our sources and there is likely an additional spatial offset along the line of sight not accounted for using only the projected separation. It is striking that the largest linear separation of 0.026 pc, for the objects considered to have associated methanol and water masers, is consistent with the mean separation of 0.03 pc between the stellar objects observed in the Orion Nebula Cluster (McCaughrean & Stauffer mccaughrean94 (1994)) while the median separation of 0.0017 pc well agrees with mean separation of 0.002 pc between protostellar objects predicted by the merging model of massive star formation (Stahler et al. stahler00 (2000)). Those above suggest an association of water and methanol masing regions with the same protostellar object in 22 sources. The emissions of both maser species for the remaining five sources shows a separation 0.1 pc (see Table 4, Fig. 2), suggesting the two species are associated with separate young stellar objects within a cluster.
We conclude that at least 71% (22/31) methanol maser sources in the sample have associated water masers. This can be explained that both maser species being excited by the same underlying central object or closely associated objects. This detection rate is higher than the 52% inferred from the 100 m dish observation of a much larger sample (Szymczak et al. szymczak05 (2005)). However, we note that the 100 m dish survey was about 60 times less sensitive than the VLA observations. Considering the VLA data above a flux of 0.45 Jy (the mean rms noise value of observations using the Effelsberg antenna) we obtain a detection rate of 55%. Our analysis demonstrating an intrinsic association of both methanol and water masers with the same underlying object or closely projected objects suggests that the two maser species share a common stage in the early evolution of massive star.
An inspection of the water and methanol maser spectra for the 22
objects (Fig. 1), for which both types of masers are excited
by the same underlying central star, reveals that in about two-thirds of the
sources the water emission does not appear at the same velocities as
the methanol emission. In G22.3350.155, G23.2070.377,
G23.3890.185, G31.5810.077, G34.475
0.093,
G38.0380.300, G38.2030.067 only a few features of both maser
species coincide in velocity. Furthermore, the velocity spread of the
water masers is 215 times larger than that of the methanol masers
with the exception of G23.3890.185, G23.70700.198,
G33.98000.019, G36.7050.096, G39.100
00.491. That was also
found in a larger sample observed using ATCA by Breen et al.
(breen10 (2010)). This implies
that the water and methanol masers emerge from different portions of
the gas surrounding the protostar. It is consistent with theoretical
models which propose that radiative pumping of CH3OH molecule
occurs at temperatures less than 150 K and density less than
108 cm-3 (e.g., Cragg et al. cragg05 (2005) and references
therein), but the collisional pumping of H2O molecules occurs in
dense (108 cm-3) and hot (400 K) shocked gas (Elitzur et
al. elitzur89 (1989)).
3.2 Methanol sources without water emission
Towards four sources, G23.6570.127, G24.6340.324, G25.4110.105, G27.2210.136, no water emission was detected above a 5 level of 1525 mJy (Table 2). Three of them (G23.6570.127, G24.6340.324 and G25.4110.105) show a ring-like structure of the 6.7 GHz methanol maser emission (Bartkiewicz et al. bartkiewicz09 (2009)). Such morphologies have been found recently in at least nine out 31 sources (Bartkiewicz et al. bartkiewicz09 (2009)) and was the reason for these follow-up observations. In addition there are five methanol sources (G24.14800.009, G24.54100.312, G30.40000.296, G31.04700.356 and G38.03800.300) where the water masers seem to be unassociated since the linear distance between both masers is above 0.1 pc (Table 4). Their methanol masers have linear, arched, complex/ring, ring and complex structures, respectively (Bartkiewicz et al. bartkiewicz09 (2009)). For the clarity we list the morphological classification of all methanol masers in the last column in Table 4. It is interesting that towards G38.0380.300 two distinct water masers were detected, but both were offset about 15”, corresponding to 0.2 pc separation for the near kinematic distance.
We note that emission from the 22 GHz water transition often exhibits significant temporal variability on time scales of a few months (Brand et al. brand03 (2003)). Therefore we may expect that a number of non-detections in our sample can be different at other epoch. However, our non-detections were also not detected by the single dish study (Szymczak et al. szymczak05 (2005)), when observed with a sensitivity of 1.5 Jy. Thus, the water emission in these sources may be relatively weak if present at all.
3.3 Maser luminosity

We have calculated the maser luminosities using the VLA data for the water maser emission and the 32 m dish observations for the methanol maser emission (Table 4). They were observed almost simultaneously (Sect. 2.2). In our sample, the isotropic water maser luminosity ranges from 10-7.4 to 10. The median luminosity for the whole sample is 10. We note, that all but one, G23.20700.377, sources with the ring morphology of methanol emission have water maser luminosities lower than 10 (Fig. 3). This suggests that these sources are associated with young massive stellar objects, in which water masers are less luminous than in the methanol sources of other morphology.
The water masers detected in our survey that are not associated with methanol masers have a median H2O maser luminosity of 10 (Fig. 3). Thus they do not significantly differ from the luminosity of water masers that are associated with methanol sources. The median luminosity of methanol maser emission, estimated from single dish data, is 10, somewhat higher than that of the water maser emission (Fig. 3). We relate this difference to the extremely high sensitivity of the VLA observations, about 60 times better than that reported in Szymczak et al. (szymczak05 (2005)). We do not notice any correlation between luminosities of methanol and water masers. Xu et al. (xu08 (2008)) found a correlation between these both values, however they claimed that since there were no physical connections between both lines, it might be a distance squared effect, as suggested by Palla et al. (palla91 (1991)). The two maser species require different excitation conditions and, even if they are related to the same YSO (Sect. 3.1), may arise in different subregions such as discs and outflows. Further, Xu et al. (xu08 (2008)) found water maser luminosities were higher than the methanol maser luminosities, a finding that is not supported by our data.
4 Discussion
4.1 Morphologies of masers and MIR counterparts
We are interested in studying the morphology of the masers in relation to that of the dust. So, we searched for mid-infrared (MIR) emission toward the detected water masers using the Spitzer IRAC maps222http://irsa.ipac.caltech.edu/. In total we found that 21 out 27 sources of water maser emission have MIR counterparts within 12 arcseconds on the sky (Table 2). To clarify the nature of the studied sources we compare the morphology of the water maser and MIR emission from maps at 4.5 m of pixel size of 06 (Fazio et al. fazio04 (2004)). The position angle of water maser clusters associated with the methanol source, PA, was determined using a least square fit to the maser spot distribution. For sources with a single water maser cluster the PA was assumed to be a position angle of the direction between the water maser cluster and the flux-weighted centre of the 6.7 GHz methanol maser distribution observed with the EVN (Bartkiewicz et al. bartkiewicz09 (2009)). The PAMIR was estimated using 4.5 m emission maps and by fitting two-dimensional Gaussian components. For several objects these estimates are very uncertain, and instead we used the maps of the 4.5 m3.6 m excess. The values of PA and PAMIR are listed in the two last columns of Table 2. The entries with an error of about 1015° are given in italic. For the remaining sources errors in PAMIR and PA are smaller than 6° and 3°, respectively.
Fig. 4 shows the distribution of the position angle differences. In 18 out of 21 sources the water maser structure is aligned within less than 20° with the extended emission at 4.5 m. For the remaining sources the position angle differences are less than 47°. As the 4.5 m emission is interpreted as tracer of shocked H2 in the outflow (Smith et al. smith06 (2006); Davis et al. davis07 (2007); Cyganowski et al. cyganowski08 (2008, 2009), and references therein) our finding of tight alignment of the spatial extent of these two tracers strongly suggests that the H2O masers originate in outflows. It is fully consistent with the theoretical model that H2O masers are excited due to collisional pumping with H2 molecules in shocks associated with outflows (Elitzur et al. elitzur89 (1989)).

Comparison of the H2O maser morphology taken with the VLA-CnB with that of 6.7 GHz CH3OH maser seen with the EVN (Bartkiewicz et al. bartkiewicz09 (2009)) is difficult because of larger positional uncertainty in the VLA 22 GHz data, and because a significant fraction of the 6.7 GHz flux may be missed in the milliarcsecond (mas) resolution observations. The case of G39.100+0.491 is instructive in this context; this relatively nearby source (distance 1.7 kpc) observed at 6.7 GHz with the 515 mas2 EVN beam appeared as an irregular cluster of size of 018004 (Bartkiewicz et al. bartkiewicz09 (2009)). However, using the 2413 VLA beam, a much richer structure of methanol maser emission was revealed: two bright clusters separated by 07 at PA of 50° and diffuse emission between them (Cyganowski et al. cyganowski09 (2009)). The 6.7 GHz maser emission is clearly extended along the same position angle as the 4.5 m emission in the Spitzer maps, as well as the H2O maser emission observed here.
However, for sources with a ring-like distribution of 6.7 GHz maser emission seen at mas resolution, the comparison with the structure of water emission obtained with arcsecond resolution is still useful. In four out of five rings, where a methanol-water maser association exists, the major axis of the methanol ring is crudely orthogonal to the main axis of the water maser structure. G23.2070.377 is likely the best example. The part of methanol masers form a ring-like structure with the PA of the major axis of 60, and with a velocity range of 13.20 km s-1, the rest likely trace an outflow (Bartkiewicz et al. bartkiewicz09 (2009)). The water maser emission is distributed over a region of 1515 and with the wider velocity range of 29 km s-1. The linear size of water maser is 0.04 pc, while the methanol ring has diameter of only 0.006 pc. As the methanol emission in ring-like structure likely traces a disc or torus around a massive stellar object (Bartkiewicz et al. bartkiewicz09 (2009)) the water maser emission along the normal to the disc implies the outflow. This is supported by MIR counterpart which shows PA of 52 (Table 2). The other three sources, G23.3890.185, G33.9800.019 and G34.7510.093 are possible cases with a similar scenario.
We conclude that the water masers in our sample generally coincide with the MIR counterpart sources. The majority of the sources show a water maser structure aligned with the extension direction of the 4.5 m emission, while in particular for some of the objects, where the methanol masers are tracing circumstellar discs/tori, the water masers appear in the orthogonal direction. In general this is consistent with previous observations showing that MIR emission is indeed associated with water masers, and their relative distributions indicate that water masers originate in outflows (e.g., De Buizer et al. debuizer05 (2005)).
Assuming that the methanol emission arises close to the protostar, while H2O masers trace outflows further from the central object, the size of the outflows can be estimated in the case of 22 sources where a methanol–water maser association exists. Our data imply size scales for the outflows from 0.0006 to 0.13 pc with a median and mean values of 0.01 and 0.022 pc, respectively. We note, that three sources: G22.3350.155, G30.4000.296 and G33.98000.019 are unresolved with a 1408 beam. Their velocity extents are from 3.3 to 7.9 km s-1 (Table 3). That also may suggest the presence of outflows along the line of sight. However, we need to verify that hypothesis with VLBI observations.
4.2 Signposts of multiple active centres
Towards 12 of the methanol targets, water maser emission was detected in distinct clusters separated from methanol maser spots by 0.1 pc. In two objects, G37.03000.039 and G38.03800.300, even two water clusters significantly displaced were seen. Therefore, in total 14 water maser clusters were found in our sample lying significantly further from methanol maser spots (Table 5). Such characteristic was also noticed in studies by Breen et al. (breen10 (2010)) using ATCA.
For these objects we also inspected Spitzer IRAC maps to search for MIR counterparts of the water maser clusters. The results are summarized in Table 5. We found that 10 of the 14 clusters have MIR counterparts which, within measurement uncertainty, do not coincide with the methanol maser clusters and their MIR counterparts that were reported in Bartkiewicz et al. (bartkiewicz09 (2009)). Therefore, we conclude that in these 10 cases both masers, methanol and water, are not associated with the same MIR object. It is possible that both masers are associated with the same molecular cloud where star formation takes place, but do not trace the environment of the same protostar. They likely trace different protostars as most of them have MIR properties typical of embedded young massive objects and show a 4.5 m3.6 m excess that is an indicator of shocked material in outflows (e.g., Cyganowski et al. cyganowski08 (2008)). The remaining four water maser clusters lying 0.1–0.3 pc from the methanol maser spots (G23.96600.109, G31.58100.077, G37.59800.425 and tentatively G31.04700.356) (Table 5) are likely associated with the same MIR objects as the methanol emission.
| CH3OH source | H2O emission | Vmin | Vmax | MIR source | (MIRH2O) | ||
| Gll.lllbb.bbb | Gll.lllbb.bbb | (arcsec) | (pc) | (km s-1) | (km s-1) | (arcsec) | |
| G22.35700.066 | G22.3510.068 | 20.05 | 0.47 | 22.3 | 22.9 | G022.3506+00.0678 | 3.22 |
| G23.70700.198 | G23.7060.200 | 6.13 | 0.13 | 3.1 | 5.0 | G023.7057-00.1999 | 1.32 |
| G23.96600.109 | G23.9650.110 | 5.58 | 0.12 | 4.5∗ | G023.9649-00.1104 | 0.62 | |
| G24.14800.009 | G24.1550.010 | 25.48 | 0.24 | 0.6 | 23.1 | G024.1550-00.0119 | 7.34 |
| G24.54100.312 | G24.5340.319 | 35.90 | 0.99 | 6.7 | 8.7 | G024.5351+00.3190 | 5.13 |
| G30.40000.296 | G30.4030.297 | 10.57 | 0.29 | 21.8 | 29.7 | G030.4010-00.2960 | 7.92 |
| G31.04700.356 | G31.0470.357 | 6.91 | 0.11 | 0.2 | 20.2 | G031.0467+00.3574 | 5 |
| G31.58100.077 | G31.5810.078 | 4.92 | 0.13 | 1.7 | 4.9 | G031.5813+00.0788 | 2.31 |
| G32.99200.034 | G32.9960.041 | 30.58 | 0.72 | 0.2 | 17.9 | G032.9962+00.0414 | 0.32 |
| G37.03000.039 | G37.0390.035 | 33.73 | 0.82 | 2.8 | 8.7 | G037.0385-00.0350 | 1.62 |
| G37.0390.034 | 37.36 | 0.91 | 4.8 | 6.1 | G037.0385-00.0350 | 6.12 | |
| G37.59800.425 | G37.5970.424 | 3.34 | 0.10 | 1.6 | 2.2 | G037.5978+00.4253 | 4.11 |
| G38.03800.300 | G38.0380.305 | 16.06 | 0.28 | 4.1 | 18.6 | G038.0384-00.3042 | 1.62 |
| G38.0410.298 | 13.78 | 0.24 | 0.8∗ | G038.0409-00.2968 | 5.22 | ||
| 1 H2O maser emission is associated with the same MIR source as CH3OH maser emission. | |||||||
| 2 H2O maser emission is not associated with the same MIR source as CH3OH maser emission. | |||||||
| 3 H2O maser emission is not associated with the same MIR source as CH3OH maser emission, instead it lies in a cluster of three MIR sources. | |||||||
| 4 H2O maser emission is likely not associated with the same MIR source as CH3OH maser emission but with MIR object in the region | |||||||
| of diffuse (10″) excess of 4.5 m emission seen in the IRAC Spitzer maps. | |||||||
| The name of the strongest MIR counterpart is given. | |||||||
| 5 H2O maser emission is tentatively associated with the same MIR source as CH3OH maser emission, laying at edge of diffuse excess of | |||||||
| 4.5 m emission from possible cluster of MIR sources. | |||||||
| ∗ When single maser spot was observed only Vmin is given. | |||||||
4.3 Association and non-association with H II regions
In our previous VLA project we searched for the 8.4 GHz continuum emission
toward the presented methanol masers with the sensitivity level of 0.15 mJy beam-1
(Bartkiewicz et al. bartkiewicz09 (2009)). In total, we detected eight
sources toward the sample. Only in four cases the continuum emission was
associated with the methanol sources. Concerning the project presented in this paper we note that
in three of these four objects the methanol structures are also associated with the distribution
of water masers (Fig. 1). Therefore, both masers are likely physically
connected with radio continuum emission. One example is G28.8170.365
where methanol spots are distributed along a PA
of 45. They are projected on the central part
of a H II region. Water
masers are distributed along a PA of 89 and are spread in the SW
direction from the radio continuum source. Such a
distribution of masers may indicate an outflow scenario for both masers. But
proper motion studies are needed to verify that scenario as for example
presented for 12 GHz methanol masers
in Moscadelli et al. (moscadelli02 (2002)). We note that the MIR
counterpart is aligned with PA of 88 (Table 2) and
supports the outflow hypothesis.
Two other sources with detected H II regions, G26.59800.024 and
G36.11500.552, show similar characteristic. Here, the overall distributions of
methanol and water masers are crudely aligned in
the same direction as the MIR counterparts (Table 2).
In these cases masers are displaced from the centres of the radio continuum
sources by 0.007 and 0.02 pc, respectively. We suggest that these three
objects support the hypothesis that we have HMSFRs at
different evolutionary stage in our sample. Beuther & Shepherd
(beuther05 (2005)) presented a scenario for the evolution of massive outflows.
When a B star forms via accretion through a disk and the H II region
is not yet formed, the disk-outflow interaction produces a collimated outflow.
With time a hyper-compact H II region forms and the wind from the
massive young star produces a less collimated outflow. The disk begins to be
destroyed and
an outflow with a small degree of collimation dominates the system. In
sources with methanol maser rings, we either did not detected water maser
emission or relatively weak one. In sources with H II counterparts
the methanol maser morphology is less regular (although G26.59800.024 was
classified as ring, we note it consists only three cluster of masers),
and water-methanol maser spot distributions can also be
consistent with an outflow scenario (Fig. 1).
In eight out nine objects, where no water was found (Sect. 3.2), no continuum emission at 8.4 GHz above 0.15 mJy beam-1 was detected. The one exception is G24.14800.009 which has weak and compact emission (Sp=1.05 mJy beam-1; Sint=1 mJy; Bartkiewicz et al. bartkiewicz09 (2009)). We also note, that towards that source we did not detect any water maser within 0.24 pc. That is opposite to the result obtained by Beuther et al. (beuther02 (2002)), where methanol masers are associated with cm emission only if there are nearby water masers. However, as noted by these authors, in the archetypical star forming region W3(OH) a situation similar to that of G24.14800.009 exists, where the methanol masers are associated with an ultracompact H II region and the water masers are offset significantly and associated with a different young star (Menten menten96 (1996)).
The absence of continuum emission and water masers may lend support to the hypothesis that 6.7 GHz methanol masers trace an earlier evolutionary phase than water masers where no outflows have started yet (e.g., Ellingsen et al. ellingsen07 (2007)). For the (50% of) methanol masers not associated with H II regions (and water emission) that show ring-like structures, we suggest that they trace circumstellar discs/tori, probably at an early stage of evolution. A less regular methanol morphology would appear in later stages and could be related with outflows traced by water masers. Comparative studies of water and methanol masers in the giant molecular cloud G333.60.2 have suggested a similar conclusion that 6.7 GHz methanol masers trace an earlier evolutionary phase of high-mass star formation than do luminous water masers (Breen et al. breen07 (2007); Ellingsen et al. ellingsen07 (2007)). It is interesting that in four of five ring-like methanol sources, the associated water masers are weaker than the methanol masers. This supports the above mentioned scenario about an early evolutionary stage for these sources, as they may be examples where the outflows have just begun. Only one ring-like source (G23.2070.377) does not follow this trend, since its methanol emission is much weaker than the water emission. However, we note that in the distribution of methanol maser spots in this source one can see components that may belong to the outflow part traced also by water emission (Fig. 1). Therefore, that object is likely more evolved. We present this source in more details in Sect. 3.4.
The aforementioned interpretation of evolutionary stage relies basically on the lack of detectable continuum at centimeter wavelengths. This may be misleading since only the most compact continuum emission was mapped. We note, that in a case of G22.3570.066 observations with the VLA at 8.4 GHz with a synthesized beam of 23 and a sensitivity of 0.3 mJy beam-1, revealed a complex and extended source with a peak flux of 1.02 mJy beam-1 which is 3 detection (van der Walt et al. walt03 (2003)). However, no emission was found at the same frequency with a beam of 035025 and a sensitivity of 0.15 mJy beam-1 (Bartkiewicz et al. bartkiewicz09 (2009)). The methanol emission is offset by 15″ from the radio continuum peak, corresponding to a projected linear distance of 0.35 pc. We therefore suggest that further sensitive searches for millimeter and centimeter continuum counterparts of ring-like methanol sources will be important to understand their nature.
5 Conclusions
High sensitivity VLA observations of the 22 GHz water maser line towards 31 methanol maser objects have yielded 27 detections, out of which 15 were detected for the first time. Most (71%) of the methanol sources have water masers with a projected separation of less than 0.026 pc. They are either excited by the same underlying central object or come from different, but closely projected YSOs. We identified MIR counterparts of 21 water masers from Spitzer IRAC maps. The water maser structures are well aligned with the extended emission at 4.5 m for a large fraction (18/21) of the studied objects. This confirms that the water masers originate in outflows.
A distinct group of sources with ring-like methanol maser distribution, likely tracing circumstellar disc/torus around high-mass young stellar objects, show either no associated water masers at all (4 out 9), or a water maser distribution which is orthogonal to the major axis of the methanol ring (4 out 9). Moreover, the majority of this group of objects (8 out 9) does not show detectable continuum emission at 8.4 GHz and may represent an early phase of evolution. One methanol ring, G26.59800.024, lies at the edge of a H II region and is aligned with associated water masers. Both masers water and methanol masers likely form in outflows.
We suggest that massive star forming regions that contain methanol masers with ring-like morphologies are at the earliest evolutionary states when the young star is still forming, possibly via accretion through a disk. When winds begin to dominate, the regular ring-like structure is destroyed and methanol and water masers appear to be associated with the outflow. Further deep observations of these sources in the radio continuum as well as in the infrared range are required to explain their nature.
Acknowledgements.
A.B. and M.S. acknowledge support by the Polish Ministry of Science and Higher Education through grant N N203 386937. A.B. acknowledges support by the Nicolaus Copernicus University grant 364-A (2009).The Very Large Array (VLA) of the National Radio Astronomy Observatory is a facility of the National Science Foundation operated under cooperative agreement by Associated Universities, Inc. This research has made use of the NASA/IPAC Infrared Science Archive, which is operated by the Jet Propulsion Laboratory, California Institute of Technology, under contract with the National Aeronautics and Space Administration.
References
- (1) Bartkiewicz, A., Szymczak, M., van Langevelde, H.J., Richards, A.M.S, & Pihlström, Y.M. 2009, A&A, 502, 155
- (2) Bartkiewicz, Brunthaler, A., Szymczak, M., van Langevelde, H.J., & Reid, M.J. 2008, A&A, 490, 787
- (3) Beuther, H., Walsh, A., Schilke, P., & et al. 2002, A&A, 390, 289
- (4) Beuther, H., & Shepherd, D. 2005, arXiv:astro-ph/0502214v1
- (5) Brand J., Cesaroni R., Comoretto G., et al. 2003, A&A, 407, 573
- (6) Breen, S.L., Ellingsen, S.P., Johnston-Hollitt, M., & et al. 2007, MNRAS, 377, 491
- (7) Breen, S.L., Caswell, J.L., Ellingsen, S.P., & Phillips, C.J. 2010, arXiv:astro-ph/1004.1060v1
- (8) Caswell, J.L., Vaile, R.A., Ellingsen, S.P., Whiteoak, J.B., & Norris, R.P. 1995, MNRAS, 272, 96
- (9) Cragg, D.M., Sobolev, A.M., & Godfrey, P.D. 2005, MNRAS, 360, 533
- (10) Cyganowski, C.J., Whitney, B.A., Holden, E., & et al. 2008, AJ, 136, 2391
- (11) Cyganowski, C.J., Brogan, C.L., Hunter, T.R., & Churchwell, E. 2009, ApJ, 702, 1615
- (12) De Buizer, J.M., & Minier, V. 2005, ApJ, 628, L151
- (13) De Buizer, J.M., Radomski, J.T., Telesco, C.M., & Piña, R.K. 2005, ApJSS, 156, 179
- (14) Davis, C.J., Kumar, M.S.N., Sandell, G., & et al. 2007, MNRAS, 374, 29
- (15) Dodson, R., Ojha, R., Ellingsen, S.P. 2004, MNRAS, 351, 779
- (16) Ellingsen, S. P., Voronkov, M. A., Cragg, D. M., & et al. 2007, IAU Symp. 242, Astrophysical Masers and their Environments, ed. J. M. Chapman & W. A. Baan (Cambridge: Cambridge Univ. Press), 213
- (17) Elitzur, M., Hollenbach, D.J., & McKee, C.F. 1989, ApJ, 346, 983
- (18) Fazio, G.G., Hora, J.L., Allen, L.E., & et al. 2004, ApJS, 154, 10
- (19) McCaughrean, M., & Stauffer, J. 1994, AJ, 108, 1382
- (20) Menten, K.M. 1991, ApJ, 380, L75
- (21) Menten, K. 1996, in IAU Symps., 178, ed.Ẽ. van Dishoek, 163
- (22) Minier, V., Booth, R.S., & Conway, J.E. 2000, A&A, 362, 1093
- (23) Moscadelli, L., Menten, K.M., Walmsley, C.M., & Reid, M.J. 2002, ApJ, 564, 813
- (24) Moscadelli, L., Goddi, C., Cesaroni, R., Beltrán, M.T., & Furuya, R.S. 2007, A&A, 472, 867
- (25) Norris, R.P., Byleveld, S.E., Diamond, P.J., & et al. 1998, ApJ, 508, 275
- (26) Pestalozzi, M.R., Elitzur, M., Conway, J.E., & Booth, R.S. 2004, ApJ, 603, L113
- (27) Palla, F., Brand, J., Cesaroni, R., et al. 1991, A&A, 246, 249
- (28) Philips, C.J., Norris, R.P., Ellingsen, S.P, & McCulloch, P.M. 1998, MNRAS, 300, 1131
- (29) Pillai, T., Wyrowski, F., Menten, K.M., & Krügel, E., 2006, A&A, 447, 929
- (30) Reid, M.J., Menten, K.M., Zheng, X.W., & et al. 2009, ApJ, 700, 137
- (31) Rygl, K.L.J., Brunthaler, A., Reid, M.J., & et al. 2010, A&A, 511, A2
- (32) Smith, H.A., Hora, J.L., Marengo, M., & Pipher, J.L. 2006, ApJ, 645, 1264
- (33) Stahler, S., Palla, F., & Ho, P. 2000, in Protostars & Planets IV (The University of Arizona Press)
- (34) Sridharan, T.K., Beuther, H., Schilke, P., Menten, K.M., & Wyrowski, F. 2002, ApJ, 566, 931
- (35) Szymczak, M., Kus, A.J., Hrynek, G., Kepa, A., & Pazderski, E., 2002, A&A, 392, 277
- (36) Szymczak, M., Pillai, T., & Menten, K.M. 2005, A&A, 434, 613
- (37) Szymczak, M., Bartkiewicz, A., & Richards, A.M.S. 2007, A&A, 468, 617
- (38) Urquhart, J.S., Hoare, M.G., Lumsden, S.L., & et al. 2010, A&A, 507, 795
- (39) Walsh A.J., Burton, M.G., Hyland, A.R., & Robinson, G. 1998, MNRAS, 301, 640
- (40) van der Walt, D.J., Churchwell, E., Gaylard, M.J., & Goedhart, S. 2003, MNRAS, 341, 270
- (41) van der Walt, D.J., Sobolev, A.M., & Butner, H. 2007, A&A, 464, 1015
- (42) Xu,Y., Li, J.J., Hachisuka, K, & et al. 2008, A&A, 485, 729
| RA | Dec | VLSR | S |
| (″) | (″) | (km s-1) | (mJy beam-1) |
| G21.40700.254 | |||
| -0.450 | 0.851 | 100.2 | 151.470 |
| -0.450 | 0.851 | 99.5 | 290.950 |
| -0.450 | 0.851 | 98.9 | 170.910 |
| 0.001 | -0.049 | 93.6 | 457.630 |
| 0.001 | -0.049 | 92.9 | 681.440 |
| 0.001 | -0.049 | 92.3 | 319.830 |
| G22.33500.155 | |||
| -0.001 | -0.050 | 35.6 | 169.200 |
| -0.001 | -0.050 | 34.9 | 425.210 |
| -0.001 | -0.050 | 32.3 | 112.560 |
| -0.001 | -0.050 | 31.0 | 112.750 |
| -0.001 | -0.050 | 29.7 | 402.000 |
| -0.001 | -0.050 | 29.0 | 764.310 |
| -0.001 | -0.050 | 28.4 | 55.741 |
| G22.35700.066 | |||
| 0.007 | 0.101 | 91.5 | 268.630 |
| 0.007 | 0.101 | 89.6 | 97.639 |
| 0.157 | 0.251 | 88.9 | 1935.500 |
| 0.007 | 0.251 | 88.3 | 3136.500 |
| 0.007 | 0.101 | 87.6 | 1570.100 |
| 0.157 | 0.251 | 86.9 | 248.040 |
| 0.007 | 0.101 | 86.3 | 578.120 |
| 0.007 | 0.101 | 85.6 | 364.780 |
| 0.007 | 0.101 | 85.0 | 255.620 |
| 0.007 | -0.049 | 82.3 | 488.520 |
| 0.007 | -0.049 | 81.7 | 688.760 |
| 0.007 | 0.101 | 79.0 | 130.260 |
| 0.307 | -0.499 | 76.4 | 170.050 |
| 0.307 | -0.499 | 75.8 | 206.370 |
| 0.307 | -0.499 | 75.1 | 350.030 |
| 0.307 | -0.499 | 74.4 | 200.560 |
| 0.307 | -0.499 | 73.8 | 179.130 |
| 0.307 | -0.499 | 73.1 | 141.600 |
| -15.309 | -12.949 | 61.9 | 154.000 |
| -15.309 | -12.949 | 61.3 | 108.320 |
| G23.20700.377 | |||
| -0.152 | -0.200 | 92.9 | 61.702 |
| -0.152 | -0.200 | 92.2 | 173.440 |
| -0.152 | -0.200 | 91.6 | 398.600 |
| -0.152 | -0.200 | 90.9 | 357.690 |
| -0.152 | -0.200 | 90.3 | 109.160 |
| -0.152 | -0.050 | 81.0 | 799.230 |
| -0.152 | -0.050 | 80.4 | 3030.800 |
| -0.152 | -0.050 | 79.7 | 6738.300 |
| -0.152 | -0.050 | 79.1 | 6281.900 |
| -0.002 | -0.050 | 78.4 | 3056.700 |
| -0.152 | -0.050 | 77.8 | 5250.100 |
| -0.002 | -0.050 | 77.1 | 6920.800 |
| -0.152 | -0.050 | 76.4 | 3010.400 |
| -1.505 | -0.950 | 75.8 | 172.700 |
| -0.152 | -0.050 | 75.8 | 217.300 |
| -0.152 | -0.050 | 75.1 | 1007.800 |
| -1.355 | -0.950 | 75.1 | 126.090 |
| -0.152 | -0.050 | 74.5 | 5069.900 |
| -0.152 | -0.050 | 73.8 | 10909.000 |
| -0.152 | -0.050 | 73.2 | 11463.000 |
| -0.152 | -0.050 | 72.5 | 5021.200 |
| -0.152 | -0.100 | 71.8 | 518.040 |
| -0.152 | -0.050 | 71.2 | 867.870 |
| -0.152 | -0.050 | 70.5 | 2283.600 |
| -0.152 | -0.050 | 69.9 | 2145.600 |
| -0.152 | -0.050 | 69.2 | 725.110 |
| RA | Dec | VLSR | S |
| (″) | (″) | (km s-1) | (mJy beam-1) |
| G23.20700.377 cont. | |||
| -1.505 | -0.950 | 69.2 | 203.670 |
| -0.152 | -0.100 | 68.5 | 136.810 |
| -1.204 | 0.400 | 68.5 | 153.120 |
| -1.505 | -0.950 | 68.5 | 79.018 |
| -1.204 | 0.400 | 67.9 | 93.406 |
| -1.204 | 0.400 | 67.2 | 60.951 |
| -0.152 | -0.050 | 66.6 | 62.789 |
| -1.204 | 0.400 | 65.9 | 93.942 |
| -0.152 | -0.050 | 65.9 | 82.876 |
| -1.204 | 0.400 | 65.3 | 238.600 |
| -1.204 | 0.400 | 64.6 | 298.590 |
| -1.204 | 0.400 | 63.9 | 164.130 |
| G23.38900.185 | |||
| 0.003 | -0.050 | 78.7 | 127.570 |
| -0.147 | -0.050 | 78.0 | 145.710 |
| -0.147 | -0.050 | 76.7 | 141.910 |
| 0.003 | -0.050 | 76.1 | 92.012 |
| G23.70700.198 | |||
| 0.901 | 0.250 | 74.6 | 155.380 |
| 0.751 | 0.250 | 73.9 | 97.242 |
| 3.753 | -4.850 | 73.9 | 67.946 |
| 3.753 | -4.850 | 72.6 | 914.740 |
| 3.753 | -4.850 | 72.0 | 682.860 |
| 0.901 | 0.250 | 62.1 | 131.370 |
| 0.901 | 0.250 | 61.4 | 278.160 |
| 0.751 | 0.250 | 60.8 | 89.936 |
| G23.96600.109 | |||
| 1.205 | -5.450 | 77.2 | 163.090 |
| 1.055 | 0.250 | 73.9 | 214.070 |
| 1.055 | 0.250 | 73.3 | 352.120 |
| 0.005 | -0.050 | 72.6 | 774.970 |
| 0.005 | -0.050 | 72.0 | 385.730 |
| 0.005 | -0.050 | 71.3 | 177.550 |
| 0.005 | -0.050 | 70.7 | 119.670 |
| 0.005 | -0.050 | 70.0 | 143.980 |
| 0.155 | -0.050 | 69.3 | 111.070 |
| 1.055 | 0.250 | 54.9 | 221.190 |
| 1.055 | 0.250 | 54.2 | 193.970 |
| 1.055 | 0.250 | 53.5 | 106.160 |
| 1.055 | 0.250 | 52.9 | 129.560 |
| 1.055 | 0.250 | 51.6 | 104.080 |
| 0.905 | 0.400 | 50.9 | 122.790 |
| 1.055 | 0.250 | 48.9 | 1120.800 |
| 1.055 | 0.250 | 48.3 | 255.340 |
| 1.055 | 0.250 | 47.0 | 209.790 |
| 1.055 | 0.250 | 46.3 | 110.470 |
| 1.055 | 0.250 | 45.6 | 73.665 |
| 0.905 | 0.400 | 44.3 | 91.386 |
| 1.055 | 0.250 | 43.7 | 138.280 |
| 0.905 | 0.250 | 43.0 | 130.530 |
| 1.055 | 0.250 | 42.4 | 106.440 |
| 1.055 | 0.250 | 39.7 | 111.540 |
| 1.055 | 0.250 | 39.1 | 180.410 |
| -0.295 | 1.150 | 36.4 | 514.030 |
| -0.295 | 1.150 | 35.8 | 851.210 |
| -0.295 | 1.150 | 35.1 | 407.550 |
| -0.295 | 1.150 | 34.5 | 233.570 |
| G24.14800.009 | |||
| 14.281 | 21.100 | 24.4 | 166.490 |
| 14.281 | 21.100 | 23.7 | 94.306 |
| 14.432 | 21.100 | 0.03 | 75.532 |
| RA | Dec | VLSR | S |
| (″) | (″) | (km s-1) | (mJy beam-1) |
| G24.54100.312 | |||
| -33.616 | -12.350 | 101.1 | 188.720 |
| -33.766 | -12.200 | 100.4 | 166.820 |
| -33.766 | -12.200 | 99.8 | 71.283 |
| -33.616 | -12.350 | 99.1 | 126.840 |
| G26.59800.024 | |||
| 0.455 | -0.050 | 22.2 | 1088.200 |
| 1.056 | -0.200 | 29.5 | 75.790 |
| G28.81700.365 | |||
| -0.615 | -0.449 | 123.6 | 73.343 |
| -0.615 | -0.449 | 123.0 | 74.491 |
| -0.615 | -0.049 | 90.7 | 232.440 |
| -0.615 | -0.049 | 90.0 | 606.260 |
| -0.615 | -0.049 | 89.4 | 1469.100 |
| -0.615 | -0.049 | 88.7 | 7338.900 |
| -0.615 | -0.049 | 88.1 | 13070.000 |
| -0.615 | -0.049 | 87.4 | 8506.800 |
| -0.615 | -0.049 | 86.8 | 2023.100 |
| -0.465 | -0.499 | 86.1 | 893.090 |
| -1.665 | -0.199 | 86.1 | 354.630 |
| -0.315 | -0.349 | 85.4 | 1251.800 |
| -1.665 | -0.199 | 85.4 | 285.680 |
| -0.465 | -0.499 | 84.8 | 1088.800 |
| -0.465 | -0.499 | 84.1 | 955.240 |
| -0.465 | -0.499 | 83.5 | 763.940 |
| -1.665 | -0.199 | 83.5 | 387.630 |
| -0.615 | -0.199 | 82.8 | 335.700 |
| -1.665 | -0.199 | 82.8 | 407.980 |
| -1.665 | -0.199 | 82.1 | 328.380 |
| -1.665 | -0.199 | 82.8 | 407.980 |
| -0.615 | -0.199 | 82.8 | 335.700 |
| -1.665 | -0.199 | 82.1 | 328.380 |
| -0.765 | -0.499 | 81.5 | 282.630 |
| -1.665 | -0.199 | 81.5 | 231.990 |
| -0.765 | -0.499 | 80.8 | 641.910 |
| -1.665 | -0.199 | 80.8 | 196.730 |
| -0.765 | -0.499 | 80.2 | 630.590 |
| -1.665 | -0.199 | 80.2 | 446.670 |
| -1.815 | -0.349 | 79.5 | 806.980 |
| -0.615 | -0.199 | 79.5 | 280.910 |
| -1.815 | -0.349 | 78.9 | 914.610 |
| -1.815 | -0.349 | 78.2 | 691.990 |
| -1.815 | -0.349 | 77.5 | 454.190 |
| -1.815 | -0.349 | 76.9 | 430.300 |
| -1.815 | -0.349 | 76.2 | 375.960 |
| -0.615 | -0.199 | 76.2 | 228.730 |
| -0.615 | -0.199 | 75.6 | 261.780 |
| -0.615 | -0.199 | 74.9 | 202.850 |
| -0.765 | -0.349 | 69.0 | 140.150 |
| -0.765 | -0.349 | 68.3 | 218.480 |
| -0.765 | -0.349 | 67.7 | 180.120 |
| -0.765 | -0.349 | 59.1 | 209.740 |
| -0.765 | -0.349 | 58.4 | 510.720 |
| -0.765 | -0.349 | 57.8 | 558.730 |
| -0.765 | -0.349 | 57.1 | 282.790 |
| G30.31800.070 | |||
| -0.903 | 0.400 | 52.6 | 474.730 |
| -0.903 | 0.400 | 51.9 | 291.770 |
| -0.903 | 0.400 | 51.2 | 384.570 |
| -0.903 | 0.400 | 50.6 | 235.530 |
| -0.903 | 0.400 | 49.9 | 2807.700 |
| -0.903 | 0.400 | 49.3 | 2283.700 |
| -0.903 | 0.400 | 47.9 | 2274.500 |
| -0.903 | 0.400 | 47.3 | 2013.200 |
| -0.903 | 0.400 | 46.6 | 224.420 |
| -0.903 | 0.400 | 46.0 | 878.560 |
| -0.903 | 0.400 | 45.3 | 925.040 |
| -0.003 | -0.200 | 32.8 | 511.840 |
| -0.003 | -0.200 | 32.2 | 554.200 |
| RA | Dec | VLSR | S |
| (″) | (″) | (km s-1) | (mJy beam-1) |
| G30.40000.296 | |||
| 9.441 | 4.751 | 132.1 | 46.758 |
| 9.441 | 4.751 | 126.1 | 68.852 |
| 9.441 | 4.751 | 125.5 | 77.645 |
| 9.441 | 4.751 | 124.8 | 53.516 |
| 9.441 | 4.751 | 124.2 | 52.276 |
| G31.04700.356 | |||
| -4.502 | 1.300 | 97.8 | 173.050 |
| -4.802 | 1.300 | 78.1 | 629.490 |
| -4.802 | 1.300 | 77.4 | 669.660 |
| -4.652 | 1.300 | 76.8 | 66.542 |
| -4.652 | 1.300 | 76.1 | 91.005 |
| -4.652 | 1.300 | 72.1 | 79.039 |
| -4.652 | 1.300 | 71.5 | 558.540 |
| -4.652 | 1.300 | 70.8 | 140.980 |
| G31.58100.077 | |||
| 0.149 | -0.050 | 103.5 | 239.060 |
| 0.149 | -0.050 | 102.8 | 621.510 |
| 0.149 | -0.050 | 102.2 | 711.120 |
| 0.149 | -0.050 | 101.5 | 350.840 |
| -4.051 | 2.800 | 100.9 | 1698.600 |
| -4.051 | 2.800 | 100.2 | 9004.900 |
| -4.051 | 2.800 | 99.5 | 12545.000 |
| -4.051 | 2.800 | 98.9 | 6135.200 |
| -4.051 | 2.800 | 98.2 | 1318.600 |
| -4.051 | 2.800 | 97.6 | 827.400 |
| -3.301 | 3.400 | 96.9 | 536.440 |
| -3.901 | 2.950 | 96.9 | 486.450 |
| -3.301 | 3.400 | 96.3 | 275.000 |
| -2.401 | 3.400 | 95.6 | 951.870 |
| -2.401 | 3.400 | 94.9 | 1602.100 |
| -2.401 | 3.400 | 94.3 | 789.870 |
| 0.149 | -0.050 | 91.7 | 135.530 |
| 0.149 | -0.050 | 91.0 | 136.240 |
| 0.149 | -0.050 | 90.3 | 124.820 |
| 0.149 | -0.050 | 89.7 | 121.650 |
| G32.99200.034 | |||
| -0.013 | -1.100 | 85.9 | 172.460 |
| -0.013 | -1.100 | 85.2 | 366.940 |
| -0.163 | -1.100 | 83.9 | 162.740 |
| -16.963 | 25.450 | 83.9 | 500.950 |
| -16.963 | 25.450 | 83.2 | 1070.200 |
| -16.963 | 25.450 | 82.6 | 164.750 |
| -16.963 | 25.450 | 81.9 | 135.560 |
| -16.963 | 25.450 | 77.3 | 337.560 |
| -16.963 | 25.450 | 76.7 | 1214.400 |
| -16.963 | 25.450 | 76.0 | 1606.000 |
| -16.963 | 25.450 | 75.3 | 532.860 |
| -16.963 | 25.300 | 74.7 | 329.590 |
| -16.963 | 25.450 | 70.1 | 324.050 |
| -16.963 | 25.450 | 69.4 | 621.300 |
| -16.963 | 25.450 | 68.8 | 1049.600 |
| -16.963 | 25.450 | 68.1 | 537.610 |
| -16.963 | 25.450 | 65.5 | 146.450 |
| G33.64100.228 | |||
| 0.000 | 0.100 | 85.1 | 767.180 |
| 0.000 | 0.100 | 84.5 | 892.410 |
| 0.000 | 0.100 | 83.8 | 211.630 |
| 0.000 | 0.100 | 67.4 | 316.000 |
| 0.000 | 0.100 | 66.7 | 318.810 |
| 0.000 | 0.100 | 60.1 | 274.990 |
| 0.000 | 0.100 | 59.5 | 705.260 |
| 0.000 | -0.200 | 58.8 | 471.010 |
| 0.000 | -0.200 | 58.1 | 1393.500 |
| 0.000 | -0.200 | 57.5 | 2696.100 |
| 0.000 | -0.200 | 56.8 | 5117.600 |
| 0.000 | -0.200 | 56.2 | 3317.100 |
| 0.000 | -0.200 | 55.5 | 3500.900 |
| 0.000 | -0.200 | 54.9 | 21800.300 |
| 0.000 | -0.200 | 54.2 | 745.680 |
| RA | Dec | VLSR | S |
| (″) | (″) | (km s-1) | (mJy beam-1) |
| G33.98000.019 | |||
| -0.005 | 0.250 | 64.8 | 56.244 |
| -0.005 | 0.250 | 64.2 | 90.924 |
| -0.005 | 0.250 | 62.2 | 398.350 |
| -0.005 | 0.250 | 61.5 | 181.850 |
| G34.75100.093 | |||
| -0.014 | 0.100 | 74.4 | 293.360 |
| -0.014 | 0.100 | 73.8 | 379.520 |
| -0.164 | -0.200 | 53.4 | 344.340 |
| -0.164 | -0.200 | 52.7 | 525.630 |
| -0.164 | -0.200 | 52.0 | 200.420 |
| -0.014 | 0.100 | 48.1 | 333.880 |
| -0.014 | 0.100 | 47.4 | 249.800 |
| -0.014 | 0.100 | 45.5 | 306.860 |
| -0.014 | 0.100 | 44.8 | 331.100 |
| -0.014 | 0.100 | 42.8 | 102.260 |
| -0.014 | 0.100 | 42.2 | 123.410 |
| -0.014 | 0.100 | 38.2 | 89.800 |
| -0.014 | 0.100 | 37.6 | 97.497 |
| G35.79300.175 | |||
| 0.150 | 0.490 | 64.6 | 170.640 |
| 0.150 | 0.490 | 64.0 | 641.760 |
| 0.150 | 0.490 | 63.3 | 1645.500 |
| 0.150 | 0.490 | 62.7 | 1090.200 |
| -0.150 | 0.040 | 62.0 | 637.780 |
| 0.000 | 0.340 | 61.4 | 205.560 |
| -1.350 | .790 | 60.7 | 67.977 |
| -1.350 | .790 | 59.4 | 571.250 |
| -1.350 | .790 | 58.7 | 2388.400 |
| -1.350 | .790 | 58.1 | 729.820 |
| -1.350 | .640 | 49.5 | 181.000 |
| G36.11500.552 | |||
| -0.157 | 0.100 | 79.6 | 606.160 |
| -0.157 | 0.100 | 78.9 | 1175.100 |
| -0.157 | 0.100 | 78.3 | 4908.200 |
| -0.157 | 0.100 | 77.6 | 38430.600 |
| -0.157 | 0.100 | 76.9 | 1576.100 |
| -0.157 | 0.100 | 76.3 | 260.940 |
| -0.007 | 0.100 | 73.7 | 185.700 |
| 0.293 | 0.400 | 40.7 | 351.430 |
| 0.293 | 0.400 | 40.1 | 379.110 |
| G36.70500.096 | |||
| -0.163 | 0.100 | 68.2 | 54.737 |
| -0.163 | 0.100 | 67.6 | 106.380 |
| 0.137 | -0.050 | 56.4 | 548.860 |
| 0.137 | -0.050 | 55.7 | 332.540 |
| G37.03000.039 | |||
| -0.155 | -0.150 | 81.9 | 74.981 |
| -0.005 | 0.000 | 81.2 | 266.990 |
| -0.155 | 0.000 | 80.6 | 194.320 |
| -0.155 | 0.000 | 79.9 | 87.324 |
| -0.005 | 0.000 | 77.3 | 122.670 |
| 2.847 | 33.450 | 77.3 | 122.910 |
| -0.005 | 0.000 | 76.6 | 212.280 |
| 3.147 | 33.750 | 76.6 | 111.340 |
| 2.997 | 33.600 | 76.0 | 102.090 |
| 2.997 | 33.600 | 75.3 | 85.365 |
| -0.906 | 37.500 | 75.3 | 79.832 |
| -1.056 | 37.350 | 74.7 | 260.000 |
| -1.056 | 37.350 | 74.0 | 96.094 |
| 2.847 | 33.450 | 72.0 | 46.063 |
| 2.997 | 33.600 | 71.4 | 88.134 |
| RA | Dec | VLSR | S |
| (″) | (″) | (km s-1) | (mJy beam-1) |
| G37.59800.425 | |||
| -0.011 | 0.100 | 117.4 | 219.240 |
| -0.011 | 0.100 | 116.7 | 242.660 |
| -0.011 | 0.100 | 116.1 | 318.110 |
| -0.011 | 0.100 | 114.8 | 1031.300 |
| -0.011 | 0.100 | 114.1 | 1030.300 |
| -0.011 | 0.100 | 102.9 | 498.890 |
| -0.011 | 0.100 | 102.3 | 2173.000 |
| -0.011 | 0.100 | 101.6 | 2605.600 |
| -0.011 | 0.100 | 100.9 | 2909.000 |
| -0.011 | 0.100 | 100.3 | 1711.500 |
| -0.011 | -0.050 | 99.6 | 295.040 |
| -0.911 | -0.950 | 92.4 | 106.880 |
| 1.940 | -2.600 | 88.4 | 173.860 |
| 2.090 | -2.600 | 87.8 | 372.810 |
| -0.011 | -0.050 | 77.9 | 1780.700 |
| -0.011 | -0.050 | 77.2 | 761.960 |
| G38.03800.300 | |||
| 15.451 | -3.801 | 76.1 | 69.425 |
| 15.451 | -4.401 | 75.4 | 108.680 |
| 15.301 | -3.801 | 62.3 | 149.360 |
| 15.301 | -3.801 | 61.6 | 79.108 |
| -0.908 | 13.749 | 58.3 | 141.580 |
| G38.20300.067 | |||
| -0.005 | -0.051 | 90.8 | 390.370 |
| -0.005 | -0.051 | 90.1 | 628.690 |
| 0.145 | -0.201 | 89.5 | 510.060 |
| -0.005 | -0.051 | 88.2 | 158.110 |
| -0.005 | -0.051 | 87.5 | 235.350 |
| -0.005 | -0.051 | 86.8 | 154.100 |
| -0.005 | -0.051 | 80.9 | 120.230 |
| -0.005 | -0.051 | 80.3 | 161.100 |
| 0.145 | -0.201 | 79.6 | 331.320 |
| 0.145 | -0.201 | 78.9 | 275.340 |
| G39.10000.491 | |||
| 0.295 | 0.400 | 24.5 | 255.050 |
| 0.595 | 0.250 | 23.9 | 637.950 |
| -0.005 | 0.850 | 23.2 | 223.880 |
| -0.456 | 1.150 | 22.5 | 289.050 |