A Study of Differential Rotation on II Pegasi via Photometric Starspot Imaging
Abstract
We present the results of a study of differential rotation on the K2 IV primary of the RS CVn binary II Pegasi (HD 224085) performed by inverting light curves to produce images of the dark starspots on its surface. The data were obtained in the standard Johnson and filter passbands via the Tennessee State University T3 0.4-m Automated Photometric Telescope from JD 2447115.8086 to 2454136.6221 (1987 November 16 to 2007 February 5). The observations were subdivided into 68 data sets consisting of pairs of and light curves, which were then inverted using a constrained non-linear inversion algorithm that makes no a priori assumptions regarding the number of spots or their shapes. The resulting surface images were then assigned to 21 groups corresponding to time intervals over which we could observe the evolution of a given group of spots (except for three groups consisting of single data sets). Of these 21 groups, six showed convincing evidence of differential rotation over time intervals of several months. For the others, the spot configuration was such that differential rotation was neither exhibited nor contraindicated. The differential rotation we infer is in the same sense as that on the Sun: lower latitudes have shorter rotation periods. From plots of the range in longitude spanned by the spotted regions vs. time, we obtain estimates of the differential rotation coefficient defined in earlier work by Henry et al., and show that our results for its value are consistent with the value obtained therein.
1 Introduction
II Pegasi is an SB1 binary system for which the primary component was determined to be of spectral class K2-3 IV-V by Rucinski (1977). It was classified as an RS CVn system by Vogt (1981a). The first photometric light curves were obtained by Chugainov (1976), who found variability with a period of approximately 6.75 d and interpreted the asymmetric light curve in terms of rotational modulation due to large, cool starspots. In 1986 September, the difference between maximum and minimum light for the filter reached 0.5 mag, implying a projected spot area coverage of the visible hemisphere at minimum light on the order of 50% (Doyle et al., 1989).
On the basis of high-quality radial velocity measurements, Berdyugina et al. (1998a) determined the revolution period of the binary to be d. The same authors performed a detailed model atmosphere analysis of high-resolution and high signal-to-noise CCD spectra, obtaining values for the photospheric temperature and surface gravity of the primary star of K and , with expressed in cgs units. These values correspond to a K2 IV star of mass . They estimated the radius of the primary as and the inclination to be on the assumption that the rotational axis is perpendicular to the orbital plane. Based on the fact that the secondary star is unseen at all wavelengths and thus has luminosity at least 100 times smaller than that of the primary, they estimated the secondary to be an M0-M3 red dwarf.
II Peg is among the most active RS CVn systems, and it is one of a small number of binaries in which the H line is always seen in emission (Nations & Ramsey, 1981). Recently, Frasca et al. (2008) reported on contemporaneous photometric and spectroscopic observations of II Peg, finding that the H emission and photometric intensity are strongly anticorrelated, suggesting that regions of high chromospheric activity are physically associated with the spots. This conclusion was corroborated by a rotational modulation of the intensity of the He I D3 line. Based on an estimated radius of and , they estimated the inclination between the rotation axis and the line of sight to be . Messina (2008) confirmed via long-term monitoring of as well as the and colors that II Peg is redder when it is dimmer, as would be expected if the dimming is caused by cool spots.
A number of studies have attempted to determine the spot temperatures. Vogt (1981b) modeled light and color curves obtained in 1977 with a single circular spot, finding a spot temperature of . Nations & Ramsey (1981) obtained from observations in the Fall of 1979; Poe & Eaton (1985) obtained for Fall 1980; Rodonò et al. (1986) obtained for Fall 1981; Byrne & Marang (1987) obtained for Fall 1986; and Boyd et al. (1987) obtained for 1986–1987. By modeling the strengths of TiO absorption bands, O’Neal, Saar, & Neff (1998) found evidence for multiple spot temperatures, finding to vary between and as the star was observed through slightly less than one rotational period. More recently, from a spot model applied to contemporaneous photometry and spectroscopy, Frasca et al. (2008) obtained .
Henry et al. (1995) used a simple analytic two-spot model to fit photoelectric light curves of four chromospherically active binaries: And, Gem, V711 Tau, and II Peg. The II Peg data were acquired from 1973–1992, and subdivided into 37 individual light curves. They plotted “migration curves” for twelve long-lived spots they identified in the data from the times of minimum light obtained via the spot-model curve fits. A migration curve shows the variation in the phase of minimum light with time, where the phase was computed using the orbital ephemeris and represents the fractional part of the number of rotation periods since an arbitrary starting time. Assuming tidal locking and no differential rotation, a given spot would always cross the central meridian of the stellar disc as seen from Earth once per revolution period and thus always at the same phase. However, if the star exhibits latitude-dependent differential rotation, we would expect to see a given spot progressively advanced or retarded in phase relative to the orbital ephemeris. A plot of the phase of minimum light versus time for a given spot should then be a straight line with slope determined by the difference in the rotation period of the latitude of the spot and the revolution period. This was precisely what Henry et al. observed in the data, for II Peg and the other stars. The plots for different spots had different slopes, demonstrating latitude-dependent differential rotation. The degree of differential rotation was specified in terms of the differential rotation coefficient, , defined for the Sun by fitting the rotation period as a function of latitude with the relation
| (1) |
where is the rotation period for latitude and is the rotation period at the equator. For the Sun, . If the differential rotation of other stars has the same functional form as for the Sun, and if the rotation periods for spots sampling a range of latitudes are determined for a star, then the coefficient is given by
| (2) |
where , , and are the maximum, minimum, and average observed periods, and is a distribution function which relates the the total range in rotational period sampled to the number of spots for which the period has been determined (Hall & Henry, 1994). The value of ranges from 0.5 for two spots to over 0.9 when the number of spots exceeds six. Henry et al. (1995) used eight of the twelve spots they observed on II Peg (four spots were observed over intervals too short to allow their periods to be obtained reliably) to determine using equation (2), with the result .
Rodonò et al. (2000) performed an analysis similar to the present study, inverting light curves acquired between 1974 and 1998 to produce images of the stellar surface. In contrast to the smoothing function used here (see §2 and in particular equation (12)), they used maximum entropy and Tikhonov regularization. They concluded that the distribution of spots on II Peg consists of a component distributed uniformly in longitude which does not rotationally modulate the light curve (but does produce a secular variation in the mean intensity), plus an unevenly distributed component responsible for the rotational modulation. Their analysis indicated that the uniformly distributed component varied in total area with a period of . They determined the unevenly distributed component to be concentrated around three active longitudes, one of these having an essentially permanent presence but a cycle in spot area with period . They found the activity of the other two active longitudes to switch back and forth, with one active while the other is inactive, with a period of . However, there is an interval of before the switch in which both longitudes are active. There is thus a period of during which only one of the two longitudes engaged in the “flip-flop” behavior is active, which agrees with the switching period deduced by Berdyugina & Tuominen (1998) from the times of light minima.
From a periodogram analysis, Henry et al. (1995) found periodicities in the mean magnitudes for the spot-model fits of their 37 light curves of and . They interpreted the 4.4-yr period as reflecting the average lifetime of the spots and the 11-yr period as representing a different timescale. Rodonò et al. interpreted the 4.7-yr periodicity arising in their analysis as corresponding to the 4.4-yr period obtained by Henry et al., while they interpreted the 9.5-yr period they saw in the total area of the spot component which is unevenly distributed in longitude as corresponding to the 11-yr period found by Henry et al.
Henry et al. noted that their two-spot model, which assumed circular spots varying only in radius over time, was not fully adequate to explain the variations with time of the II Peg light curve. In particular, when the amplitude of the rotational modulation due to spots they designated G and H was diminishing, the mean brightness of the star stayed roughly constant. Similar behavior was seen for another pair of spots, which they designated J and K. If the decrease in amplitude were due simply to a decrease in the spot radii, the mean brightness of the star should have increased (assuming no change in the brightness of the photosphere outside the spots). On the other hand, if instead the spots were being drawn out in longitude by differential rotation while maintaining nearly constant area, then the amplitude would decrease while the mean brightness stayed constant, as observed.
The present study is suited to look for evidence for such drawing out (or compression) in longitude of active regions by differential rotation, as we produce images of the active regions and observe changes in them over periods of several months. By simultaneously inverting contemporaneous and light curves, we exploit differences in the limb darkening as seen through the two filters to achieve significantly better latitude resolution than is possible when using light curves obtained through only a single filter (Harmon & Crews, 2000), thereby allowing us to directly detect differential rotation in our images. It should be noted, however, that we do not claim to obtain accurate spot latitudes from our two-filter inversions; nonetheless, simulations like those detailed in Harmon & Crews show that relative spot latitudes can be obtained with good reliability, i.e., when two spots are present, the one at the lower latitude is rendered as such. In this regard our approach differs from that of Rodonò et al., who used their -filter surface imagery just to derive quantities that they claim are independent of the regularization criterion, such as the distributions of the spots versus longitude, the changes in the distribution over time, and the variations of the total area covered by spots.
In §2, we discuss the method used to invert the light curves so as to produce these images. In §3, we discuss the division of the over nineteen years worth of and light curves into separate data sets and the procedure used to process them for inversion. In §4, we discuss in detail the results for the six intervals over which we saw good evidence in our images for alteration of the active region configuration by latitude-dependent differential rotation. Finally, in §5, we show that our results are consistent with the result for the value of the differential rotation coefficient for II Peg inferred by Henry et al. (1995) based on longer-term monitoring of the times of minimum light due to individual spots using their two-spot model rather than surface imaging.
2 The Light-curve Inversion Algorithm
Light-curve Inversion (LI) is a photometric imaging technique which produces a map of a star’s surface based on the brightness variations produced as dark (or possibly bright) starspots are carried into and out of view of Earth by the star’s rotation. It makes no a priori assumptions regarding the number of spots on the surface or their shapes. The details regarding the implementation of the algorithm are presented in Harmon & Crews (2000), along with the results of extensive tests in which artificial stellar surfaces were used to create light curves, which were then inverted. In Harmon & Crews, the technique is called “Matrix Light-curve Inversion,” because it evolved from the original formulation described in Wild (1989) and called by that name. However, because the formulation described in Harmon & Crews (2000) and as modified in the present work no longer uses matrices, we shortened the name. Here we outline the method, and refer the reader to Harmon & Crews for more details.
The stellar surface is subdivided into bands in latitude of equal angular widths . Each latitude band is further subdivided into patches which are all “spherical rectangles” of equal widths in longitude , where is the number of patches in the latitude band. The are chosen to be proportional to the cosine of the latitude (to within the constraint that the must be integers) so that the areas of all the patches are nearly equal. The visible pole is defined to be the north pole, with latitude , while the hidden south pole has latitude . The patch in the latitude band is designated patch . The first patch in each latitude band, patch , straddles the meridian with longitude , defined to be the one which intersects the equator on the approaching limb of the star at an arbitrarily chosen reference time . Longitude increases in the direction of the star’s rotation, so the sub-observer longitude at is thus . In the absence of interstellar absorption, at the time of observation number through filter , the intensity observed at Earth is (in the limit that the number of patches is large)
| (3) |
where is the number of filters, is the number of observations through filter , is the specific intensity (W m-2 sr-1) along the outward normal of patch integrated over the passband of filter , is the solid angle of patch as seen from Earth at time (we set if the patch is on the far side of the star), is the factor by which the specific intensity emitted in the direction of Earth is attenuated by limb darkening compared to that emitted along the outward normal (so that is the specific intensity emitted along the line of sight to Earth), and is the index of the southernmost latitude band which is visible from Earth.
The goal of LI is to find a set of computed patch intensities that mimics the actual variations of surface brightness across the stellar surface as closely as possible. (We use a caret over a quantity to indicate that it represents a value as computed by the LI algorithm.) Since we generally do not know the actual radius and distance of the star very precisely, we content ourselves with finding only the relative brightnesses of the patches to one another. To this end we simply define the radius of the star to be 1 and use the area of a patch projected onto the plane of the sky as a proxy for the solid angle it subtends at Earth.
We use the limb-darkening coefficients published by Van Hamme (1993) to determine the values of the in equation (3). The benefit of observing through multiple filters is that we can take advantage of the differences in the degree of limb darkening as seen through different filters in order to significantly increase the latitude resolution of the inversions, as explained in Harmon & Crews (2000). In order to take advantage of this information, we must simultaneously invert all of the filter light curves. This in turn requires that we couple together the for different values of the filter index, . To do this, we designate the filter for which the light curve has the lowest noise as the “primary filter” and assign it filter index . For simplicity we assume that the actual stellar surface can be described via a two-component model in which all the spots have the same temperature and thus emit the same specific intensity along the outward normal as seen through filter , which we designate at ; similarly, we assume that all points on the surface outside spots are part of a photosphere of uniform temperature and emitting specific intensity along the outward normal. However, it should be noted that the reconstructed surface created by the inversion of the data does not have the property that the can have only one of two values; they are continuous variables. We then define the intensities of the patches as viewed through filter via the linear scaling
| (4) |
Here is the average value of the , is the estimated value of on the actual stellar surface, and is the estimated value of for the actual stellar surface. We estimate these ratios by calculating the Planck function at the central wavelength of the filter in question at the assumed spot and photosphere temperatures. It would be more accurate to integrate the product of the Planck function and the filter sensitivity functions over their passbands, but typically we do not know the spot and photosphere temperatures with sufficient precision to justify the extra effort. The scaling given in equation (4) from to has the property that when according to our estimate, then as well. We are using as a proxy for , which should be a reasonable approximation as long as the stellar photosphere comprises most of the surface.
Since the patch brightnesses through all the filters in the model are entirely determined in terms of their brightnesses as seen through filter 1, the problem reduces to finding these values, so for notational simplicity we define . As is well known, the problem of determining the is extremely sensitive to the presence of even small amounts of noise in the data. This can be seen by considering the effect on the light curve produced by a myriad of small spots distributed all over the surface. As the star rotated, at any given time nearly equal numbers of spots would be rising over the approaching limb and setting over the receding limb. Thus, the total contribution to the star’s brightness from the spots would be nearly but not exactly constant, so that the effect of the spots would be to impart a small-amplitude, high-frequency ripple on the light curve, very similar to the effect of random noise in the observations. Conversely, if we attempt to fit noisy data, then unless precautions are taken, the resulting model surface will be covered with spurious small spots introduced in order to “explain” the presence of the noise in the signal.
To avoid this dilemma, rather than simply finding the set of that yields the best fit to the light curve data, we determine the by finding the set of them which minimizes the objective function (Twomey, 1977; Craig & Brown, 1986):
| (5) |
Here represents the set of the , while represents the set of observed intensities , i.e., the data light curve. The function expresses the goodness-of-fit of the calculated light curve (with components ) obtained from to the data light curve , such that smaller values of imply a better fit to the data. The smoothing function is defined such that it takes on smaller values for surfaces that are “smoother” in some appropriately defined sense. Finally, is an adjustable Lagrange multiplier called the tradeoff parameter, and is an adjustable parameter called the bias parameter, which is discussed below. Note that as , the first term on the right dominates, so that minimizing is equivalent to minimizing , and we obtain the solution which best fits the light curve data but suffers from the spurious noise artifacts discussed above. On the other hand, as , the second term dominates, so that minimizing produces a very “smooth” surface lacking in noise artifacts, but also producing a very poor fit to the data. Thus, by varying , we adjust the tradeoff between goodness-of-fit and smoothness of the model surface. If we choose such that is equal to a corresponding estimate of the amount of noise in the data, then in a rough sense we can say that by minimizing the objective function, we find the smoothest solution for which the corresponding light curve fits the data light curve to a degree which is as good as but not better than is justified by the noise in the data. In this way, we obtain a model surface which fits the data well, but not so well that it is dominated by noise artifacts.
For the goodness-of-fit function in this study, we use
| (6) |
Here we assume that light curves have been obtained through different photometric filters ( in the present work since we use - and -filter data), and that the magnitudes have been converted to intensities. Since our goal is only to find the relative values of the , it suffices to use relative rather than absolute intensities for the light curve data in the calculation of . The number of observations in the light curve obtained through filter is , while is the total number of data points in all the light curves. The estimated noise variance in the light curve data for filter expressed in magnitudes is . In Harmon & Crews (2000) it is shown that to a good approximation, the true noise variance is given by
| (7) |
where is the true noise-free value of the intensity (which is of course unknown unless one is doing a simulation). If we define to be the true error in the measurement , and to be the deviation between the calculated and true intensities, then with this notation
| (8) |
while
| (9) |
If is a good match to the data , then the and are small quantities, and we can expand the right side of equation (9) as
| (10) |
Then
| (11) | |||||
If the reconstructed intensities perfectly matched the true intensities , and in addition the estimated noise variances were equal to the true noise variance , then we would have all , and so we would have to lowest order in the . For this reason, given the estimates and for a given value of the bias parameter , we vary until the stopping criterion is attained to a predetermined precision.
The smoothing function used in this study is
| (12) |
where if , while if . Thus, patches brighter or darker than average incur a penalty in that they increase the value of (and thus the function to be minimized) by an increasing amount as the deviation from the average increases. Note that satisfies the criterion that it takes on its minimum possible value of zero for a featureless surface which is perfectly “smooth” in that all the patch brightnesses are equal, and that surfaces showing greater deviations about the average are judged as “rougher.” For , the penalty for a patch being brighter than average by a given amount is times larger than for a patch darker than average to the same degree. Thus, biases the solution toward having most patches just slightly brighter than average to represent the stellar photosphere, which is assumed to be almost uniformly bright like the Sun’s, while a smaller number are much darker than average to represent the dark starspots. This is the reason for the name “bias parameter.”
The simulations described in Harmon & Crews (2000) show that as is increased, the ratio decreases, so that the darkest patch becomes darker relative to the average patch brightness. We use this ratio as a proxy for the assumed ratio of the spot and photosphere brightnesses as seen through filter 1. For a given value of the tradeoff parameter , the bias parameter can be varied until , the estimated spot-to-photosphere brightness ratio seen through filter 1, to a predetermined precision. The scaling given by equation (4) ensures that , the estimated spot-to-photosphere brightness ratio for filter .
The procedure for inverting a series of light curves obtained through a set of filter passbands is then as follows. The input parameters are the estimated noise variances of the light curves, the estimated spot and photosphere temperatures and , and the inclination angle of the rotation axis to the line of sight. The in the definition of , , and are used to obtain the values of and (including ) in equation (4), and the inclination is used in finding and in equation (3). As described in Harmon & Crews (2000), two copies of a root-finding subroutine are used in concert so as to find the values of and such that and to the desired precision.
The result is a set of solutions, one for each combination of the input parameters. How we select one of these to represent the “best” solution is described in §3.
3 Data Analysis
The raw data consisted of Johnson and differential magnitudes paired with corresponding heliocentric Modified Julian Dates, acquired from heliocentric MJD 47115.8086 to 54136.6221 (1987 November 16 to 2007 February 5) with the Tennessee State University T3 0.4-m Automated Photometric Telescope at Fairborn Observatory in Arizona (Henry, 1995a, b). The complete and data sets are plotted as the upper and lower panels of Figure 1.


The first task was to convert the Modified Julian Dates to rotational phases. The rotational phase is defined as
| (13) |
where is the time of the observation, is an arbitrary reference time used for all the observations, is the rotational period of the star, and is the greatest integer which is less than or equal to . Thus, represents the fraction of a rotation through which the star has turned relative to the orientation it had at time . On the assumption that the star exhibits differential rotation, there is no such thing as the rotational period, so here represents a suitable average of the rotation period over all latitudes. On the assumption of tidal locking, it is reasonable to use the orbital period for this average. In the present study, d was used based on the orbital period obtained by Berdyugina et al. (1998a), and was chosen as JD 2443033.47, based on the orbital ephemeris of Vogt (1981a), in which represents the time of superior conjunction, when the primary is farthest from the observer.
The next task was to subdivide the data into individual data sets comprised of pairs of and light curves suitable for inversion. Each light curve needed to contain enough data points so as to provided good phase coverage. Ideally this would be achieved using data acquired during a single rotation of the star, since this would minimize the chance that the spot configuration had evolved significantly during the time interval spanned by the data. However, in practice this was not feasible, because the star’s rotation period is too long to allow for continuous monitoring during a single rotation, and because the telescope was not dedicated solely to this study. The desire for good phase coverage is thus in opposition to the desire to minimize the number of stellar rotations covered in any one data set, so some compromises were necessary. If data for different revolutions showed a systematic shift in the magnitudes, it was clear that the stellar surface features had evolved by an unacceptable amount during the interval in question; otherwise, data from additional rotations could be included if needed so as to improve the phase coverage. Several groups of observations were discarded because they were temporally isolated by many rotation periods from the observations nearest them in time and contained an insufficient number of observations to produce good phase coverage. In the end, 68 pairs of and light curves were created that were subsequently inverted to produce the results reported in this study. The mean number of observations per light curve was 22.3, the median was 21.5 and the standard deviation was 6.3, while for the light curves the mean was 22.1, the median was 21 and the standard deviation was 5.9.
The final task before inverting the light curves was to convert the differential magnitudes to relative intensities. The formula used for both the and the passbands was simply
| (14) |
where was the differential magnitude for the observation in question, and the reference magnitude was the smallest value of in the entire data set for the given filter. An intensity of was thus assigned to this observation. For the filter, , while for the filter, . No attempt was made to calibrate the intensities relative to the intensities in an absolute sense, because the LI algorithm neither requires nor would make use of this information, as mentioned in §2.
Berdyugina et al. (1998a) obtained for the inclination of the rotation axis. We performed inversions assuming their nominal value of . We also performed inversions for as well, considering this to be prudent given the considerable uncertainty in the inclination. As will be seen from the discussion of the individual data sets below, the results for both assumed inclinations were generally consistent, increasing our confidence in their validity. While one might argue that we also should have performed inversions for assumed inclinations greater than , say or , simulations like those reported in Harmon & Crews (2000) show that the method works poorly in such circumstances. We thus chose not to do so.
For the spot and photosphere temperatures, we used K since this is compatible with the estimates by other authors mentioned in §1, and K based on the work of Berdyugina et al. (1998a). The estimates of and of appearing in the scaling given by equation (4) were obtained by evaluating the Planck function describing blackbody radiation at the filter effective wavelengths nm and nm.
The photosphere temperature and surface acceleration due to gravity are the input parameters used by Van Hamme (1993) to calculate limb-darkening coefficients based on the ATLAS stellar atmosphere models of Kurucz (1991). We used , which is appropriate for a K2 subgiant (Gray, 1992), and is the value in Van Hamme’s tables which is closest to the result of Berdyugina et al. (1998a). Van Hamme gives coefficients in steps of 250 K for temperatures in the range , so there is no entry for our value of K. We simply substituted the values corresponding to K, the nearest listed temperature to ours, since we do not know or accurately enough to justify interpolating. From Table 2 in Van Hamme’s paper, we find for the filter that
| (15) |
with and , where is the cosine of the angle between the outward normal to the surface and the observer’s line of sight. For the filter
| (16) |
with and . Given the latitude and longitude of patch and the angle of inclination , it is straightforward to compute for the center of the patch at any given observation time and thus to obtain in equation (3).
The next step was to obtain estimates of the noise variances and for each of the 68 light curves for each filter. It is well known that in practice Twomey’s criterion of choosing the tradeoff parameter so that the variance between the data and the reconstruction is equal to the noise variance leads to over-smoothing (Turchin, 1967). In our case this would lead to a loss in resolution of the reconstructed surfaces. However, the technique we use to determine avoids this problem, because we obtain an “effective noise level” rather than using an estimate of the noise variance based on the scatter in the comparison star magnitudes. Harmon & Crews (2000) describes simulations in which an artificial star is used to generate light curves to which random noise of a known variance is added. This allowed the effects of using an underestimate of the noise variance in the goodness-of-fit function to be determined. It was found that for a given light curve, when the ratio falls below a certain value (typically between 0.90 and 0.98), the solution “falls apart” in that it starts to show very obvious noise artifacts. The transition to this behavior is quite sharp in that it takes place over a narrow range of values of this ratio. This gives a practical means to determine how low can be pushed while still yielding acceptable solutions. Thus, we can avoid the over-smoothing associated with the Twomey criterion by performing inversions for a range of values of and then choosing the lowest value which leads to a solution free of obvious noise artifacts. This value is what we call the “effective noise level” for the light curve. Because the transition is not perfectly sharp, the precise choice of is to some extent a judgment call, so we were conservative in our choices.
The first round of inversions was thus a series of single-filter inversions of all 68 and 68 light curves so as to assign an effective noise to each one. The next round was to take each pair of contemporaneous and light curves and invert the pair in combination so as to produce the finished surface map for that pair. A complication is that when using LI to simultaneously invert light curves obtained through several filters, the effective noise levels as determined from single-filter inversions sometimes (but not always) lead to under-smoothed surface images corrupted by noise artifacts. Thus, we used the effective noise levels obtained from the initial round of single-filter inversions as starting points, and ran a series of inversions for each pair of light curves using nearby values of and . The resulting images were inspected to determine the lowest values of and that did not result in obvious noise artifacts; again we were conservative in our judgments.
In general, when simultaneously inverting multiple light curves, the deviation for a given filter between the data and reconstructed light curves differs somewhat from the effective noise. This arises because the convergence criterion for the LI algorithm is based on the overall deviation between the data and reconstructed light curves through the various filters taken together as a whole, rather than on the deviations for the individual filters. This is necessary because the scaling given by equation (4), which defines the patch intensities assigned to the secondary filter(s) in terms of their values as seen through the primary filter, makes it impossible to independently tweak how well the individual reconstructed light curves match the data light curves.
4 Results
Each of the 68 data sets consisting of paired and light curves was inverted according to the procedure outlined in §2. Upon careful examination of the resulting images, the data sets were divided into 21 groups. Each group covers a span of time during which we can see evolution of a particular set of spots, except for three cases in which a group consists of a single data set because it is temporally isolated from the data sets immediately before and after it by long gaps in the data. In six of these groups we saw good evidence for differential rotation, and as looking for such evidence was our primary goal in this work, we present in detail only the results for these six groups here, arranged in chronological order. The time spans corresponding to these six groups are indicated via horizontal bars in the plots of Figure 1. The remainder of our images are presented in Figures 17–33 in the online version of the Journal.
Table 1 summarizes the properties of each of the data sets and groups. The data sets are numbered in chronological order in the first column, with the group to which each set was assigned indicated in the second column. Boldface entries in the first two columns denote the groups for which we present evidence of differential rotation. The starting and ending heliocentric Modified Julian Dates and corresponding UTC calendar dates for the and light curves of each data set are given in the fourth through seventh columns; a blank entry for a light curve indicates that the value is the same as for the light curve from the same set. The number of data points in each data set is shown in the column. The number of rotation periods covered by each data set is listed in the “# Per.” column. The last two columns list the “effective noise” in magnitudes for each inversion, as described in section §3, for the assumed rotation axis inclinations of and . The values in the table are times larger than the actual values, e.g., an entry of “154” means that the effective noise was 0.0154 mag.
| Set | Grp. | Filt. | Start MJD | End MJD | Start Date | End Date | # Per. | |||
|---|---|---|---|---|---|---|---|---|---|---|
| 1 | 1 | 47115.8086 | 47141.7351 | 1987 Nov 16 | 1987 Dec 12 | 15 | 3.86 | 154 | 154 | |
| 17 | 194 | 194 | ||||||||
| 2 | 1 | 47171.6466 | 47198.5822 | 1988 Jan 11 | 1988 Feb 07 | 10 | 4.01 | 138 | 132 | |
| 47199.5824 | 1988 Feb 08 | 12 | 4.15 | 226 | 216 | |||||
| 3 | 2 | 47417.7681 | 47433.8609 | 1988 Sep 13 | 1988 Sep 29 | 20 | 2.39 | 268 | 258 | |
| 47415.8437 | 1988 Sep 11 | 23 | 2.68 | 326 | 326 | |||||
| 4 | 2 | 47434.7230 | 47469.8305 | 1988 Sep 30 | 1988 Nov 04 | 32 | 5.22 | 164 | 158 | |
| 30 | 208 | 200 | ||||||||
| 5 | 2 | 47470.6837 | 47525.6801 | 1988 Nov 05 | 1988 Dec 30 | 31 | 8.18 | 174 | 174 | |
| 28 | 294 | 286 | ||||||||
| 6 | 2 | 47526.5929 | 47556.5813 | 1988 Dec 31 | 1989 Jan 30 | 12 | 4.46 | 144 | 144 | |
| 47549.5824 | 1989 Jan 23 | 13 | 3.42 | 146 | 146 | |||||
| 7 | 3 | 47779.7480 | 47818.8716 | 1989 Sep 10 | 1989 Oct 19 | 35 | 5.82 | 304 | 296 | |
| 33 | 298 | 298 | ||||||||
| 8 | 3 | 47824.6882 | 47850.7976 | 1989 Oct 25 | 1989 Nov 20 | 30 | 3.88 | 392 | 390 | |
| 31 | 410 | 402 | ||||||||
| 9 | 3 | 47853.6658 | 47921.5825 | 1989 Nov 23 | 1990 Jan 30 | 38 | 10.10 | 238 | 214 | |
| 47926.5752 | 1990 Feb 04 | 33 | 10.84 | 238 | 206 | |||||
| 10 | 4 | 48183.8086 | 48236.6947 | 1990 Oct 19 | 1990 Dec 11 | 25 | 7.86 | 278 | 278 | |
| 48235.6694 | 1990 Dec 10 | 25 | 7.71 | 182 | 184 | |||||
| 11 | 5 | 48397.9614 | 48437.9355 | 1991 May 21 | 1991 Jun 30 | 21 | 5.94 | 124 | 118 | |
| 48394.9734 | 1991 May 18 | 27 | 6.39 | 94 | 94 | |||||
| 12 | 6 | 48872.9343 | 48898.8417 | 1992 Sep 07 | 1992 Oct 03 | 17 | 3.85 | 82 | 80 | |
| 17 | 56 | 64 | ||||||||
| 13 | 6 | 48905.7999 | 48945.7709 | 1992 Oct 10 | 1992 Nov 19 | 28 | 5.94 | 200 | 196 | |
| 28 | 196 | 198 | ||||||||
| 14 | 6 | 48951.7163 | 49022.5799 | 1992 Nov 25 | 1993 Feb 04 | 20 | 10.54 | 112 | 106 | |
| 20 | 106 | 106 | ||||||||
| 15 | 7 | 49135.9488 | 49166.9202 | 1993 May 28 | 1993 Jun 28 | 23 | 4.61 | 124 | 128 | |
| 23 | 122 | 118 | ||||||||
| 16 | 7 | 49235.9074 | 49253.7684 | 1993 Sep 05 | 1993 Sep 23 | 15 | 2.66 | 46 | 40 | |
| 15 | 44 | 46 | ||||||||
| 17 | 7 | 49275.8128 | 49340.6260 | 1993 Oct 15 | 1993 Dec 19 | 25 | 9.64 | 144 | 140 | |
| 49282.7438 | 1993 Oct 22 | 26 | 8.61 | 132 | 134 | |||||
| 18 | 7 | 49347.6242 | 49384.5901 | 1993 Dec 26 | 1994 Feb 01 | 17 | 5.50 | 94 | 106 | |
| 49345.6833 | 1993 Dec 24 | 18 | 5.79 | 104 | 116 | |||||
| 19 | 8 | 49638.7416 | 49671.8291 | 1994 Oct 13 | 1994 Nov 15 | 22 | 4.92 | 106 | 110 | |
| 22 | 104 | 108 | ||||||||
| 20 | 8 | 49674.7171 | 49706.6550 | 1994 Nov 18 | 1994 Dec 20 | 17 | 4.75 | 56 | 56 | |
| 18 | 76 | 76 | ||||||||
| 21 | 8 | 49724.6199 | 49757.5937 | 1995 Jan 07 | 1995 Feb 09 | 14 | 4.90 | 70 | 76 | |
| 14 | 86 | 96 | ||||||||
| 22 | 9 | 49873.9567 | 49909.8632 | 1995 Jun 05 | 1995 Jul 11 | 26 | 5.34 | 120 | 116 | |
| 25 | 110 | 114 | ||||||||
| 23 | 10 | 49982.8845 | 50001.9313 | 1995 Sep 22 | 1995 Oct 11 | 27 | 2.83 | 88 | 96 | |
| 28 | 54 | 58 | ||||||||
| 24 | 10 | 50002.7800 | 50033.7425 | 1995 Oct 12 | 1995 Nov 12 | 32 | 4.60 | 88 | 86 | |
| 32 | 82 | 82 | ||||||||
| 25 | 10 | 50037.8137 | 50062.6899 | 1995 Nov 16 | 1995 Dec 11 | 27 | 3.70 | 146 | 140 | |
| 26 | 120 | 116 | ||||||||
| 26 | 10 | 50066.7615 | 50123.5946 | 1995 Dec 15 | 1996 Feb 10 | 30 | 8.45 | 162 | 164 | |
| 50129.5853 | 1996 Feb 16 | 30 | 9.34 | 132 | 132 | |||||
| 27 | 11 | 50391.8348 | 50435.6313 | 1996 Nov 04 | 1996 Dec 18 | 26 | 6.51 | 120 | 124 | |
| 25 | 114 | 104 | ||||||||
| 28 | 11 | 50436.6379 | 50490.5894 | 1996 Dec 19 | 1997 Feb 11 | 26 | 8.02 | 208 | 204 | |
| 50494.5846 | 1997 Feb 15 | 25 | 8.62 | 152 | 140 | |||||
| 29 | 11 | 50590.9563 | 50642.8849 | 1997 May 22 | 1997 Jul 13 | 25 | 7.72 | 116 | 104 | |
| 28 | 108 | 100 | ||||||||
| 30 | 11 | 50714.8051 | 50755.7973 | 1997 Sep 23 | 1997 Nov 03 | 35 | 6.10 | 120 | 120 | |
| 35 | 126 | 108 | ||||||||
| 31 | 11 | 50756.7863 | 50795.6926 | 1997 Nov 04 | 1997 Dec 13 | 23 | 5.79 | 72 | 80 | |
| 21 | 70 | 78 | ||||||||
| 32 | 11 | 50797.6863 | 50837.6257 | 1997 Dec 15 | 1998 Jan 24 | 20 | 5.94 | 124 | 114 | |
| 19 | 118 | 104 | ||||||||
| 33 | 11 | 50838.6203 | 50856.5946 | 1998 Jan 25 | 1998 Feb 12 | 13 | 2.67 | 172 | 180 | |
| 13 | 120 | 128 | ||||||||
| 34 | 12 | 51085.9791 | 51115.7864 | 1998 Sep 29 | 1998 Oct 29 | 25 | 4.43 | 86 | 86 | |
| 51086.7915 | 1998 Sep 30 | 25 | 4.31 | 116 | 96 | |||||
| 35 | 12 | 51116.7725 | 51144.7050 | 1998 Oct 30 | 1998 Nov 27 | 28 | 4.15 | 120 | 122 | |
| 27 | 112 | 108 | ||||||||
| 36 | 12 | 51148.7022 | 51182.6674 | 1998 Dec 01 | 1999 Jan 04 | 24 | 5.05 | 76 | 84 | |
| 24 | 104 | 114 | ||||||||
| 37 | 12 | 51183.6640 | 51224.5942 | 1999 Jan 05 | 1999 Feb 15 | 24 | 6.09 | 172 | 174 | |
| 23 | 162 | 158 | ||||||||
| 38 | 13 | 51429.8915 | 51475.8034 | 1999 Sep 08 | 1999 Oct 24 | 29 | 6.83 | 146 | 146 | |
| 28 | 108 | 108 | ||||||||
| 39 | 13 | 51477.8148 | 51505.7306 | 1999 Oct 26 | 1999 Nov 23 | 27 | 4.15 | 202 | 208 | |
| 24 | 118 | 130 | ||||||||
| 40 | 13 | 51506.7278 | 51535.6724 | 1999 Nov 24 | 1999 Dec 23 | 23 | 4.30 | 94 | 100 | |
| 23 | 76 | 72 | ||||||||
| 41 | 13 | 51537.6574 | 51586.5994 | 1999 Dec 25 | 2000 Feb 12 | 29 | 7.28 | 152 | 138 | |
| 30 | 118 | 126 | ||||||||
| 42 | 14 | 51805.8758 | 51833.8204 | 2000 Sep 18 | 2000 Oct 16 | 17 | 4.16 | 124 | 126 | |
| 18 | 154 | 156 | ||||||||
| 43 | 14 | 51838.8332 | 51879.8006 | 2000 Oct 21 | 2000 Dec 01 | 18 | 6.09 | 80 | 74 | |
| 18 | 94 | 84 | ||||||||
| 44 | 14 | 51884.7888 | 51945.6130 | 2000 Dec 06 | 2001 Feb 05 | 25 | 9.05 | 130 | 136 | |
| 51886.6803 | 51946.6051 | 2000 Dec 08 | 2001 Feb 06 | 21 | 8.91 | 180 | 176 | |||
| 45 | 15 | 52178.8580 | 52214.7927 | 2001 Sep 26 | 2001 Nov 01 | 22 | 5.34 | 152 | 152 | |
| 22 | 128 | 130 | ||||||||
| 46 | 15 | 52216.7903 | 52261.6769 | 2001 Nov 03 | 2001 Dec 18 | 17 | 6.68 | 168 | 150 | |
| 15 | 120 | 118 | ||||||||
| 47 | 15 | 52266.7173 | 52313.6093 | 2001 Dec 23 | 2002 Feb 08 | 16 | 6.97 | 124 | 130 | |
| 52267.6603 | 2001 Dec 24 | 15 | 6.83 | 154 | 130 | |||||
| 48 | 16 | 52539.8107 | 52595.7358 | 2002 Sep 22 | 2002 Nov 17 | 34 | 8.32 | 136 | 140 | |
| 33 | 120 | 118 | ||||||||
| 49 | 16 | 52597.7373 | 52645.6685 | 2002 Nov 19 | 2003 Jan 06 | 29 | 7.13 | 100 | 102 | |
| 30 | 88 | 94 | ||||||||
| 50 | 16 | 52649.6412 | 52677.5907 | 2003 Jan 10 | 2003 Feb 07 | 22 | 4.16 | 134 | 124 | |
| 21 | 80 | 78 | ||||||||
| 51 | 17 | 52894.9328 | 52914.8841 | 2003 Sep 12 | 2003 Oct 02 | 17 | 2.97 | 96 | 94 | |
| 18 | 164 | 188 | ||||||||
| 52 | 17 | 52915.8656 | 52941.8171 | 2003 Oct 03 | 2003 Oct 29 | 19 | 3.86 | 212 | 206 | |
| 52944.8047 | 2003 Nov 01 | 20 | 4.30 | 134 | 132 | |||||
| 53 | 17 | 52947.7834 | 52986.7346 | 2003 Nov 04 | 2003 Dec 13 | 18 | 5.79 | 78 | 62 | |
| 19 | 72 | 70 | ||||||||
| 54 | 17 | 52988.7597 | 53035.6267 | 2003 Dec 15 | 2004 Jan 31 | 21 | 6.97 | 184 | 190 | |
| 20 | 118 | 118 | ||||||||
| 55 | 18 | 53255.8137 | 53284.8259 | 2004 Sep 07 | 2004 Oct 06 | 18 | 4.31 | 104 | 102 | |
| 18 | 54 | 62 | ||||||||
| 56 | 18 | 53285.8297 | 53315.7442 | 2004 Oct 07 | 2004 Nov 06 | 17 | 4.45 | 70 | 70 | |
| 17 | 68 | 62 | ||||||||
| 57 | 18 | 53326.7403 | 53355.6576 | 2004 Nov 17 | 2004 Dec 16 | 17 | 4.30 | 66 | 66 | |
| 18 | 64 | 66 | ||||||||
| 58 | 18 | 53357.6446 | 53405.6231 | 2004 Dec 18 | 2005 Feb 04 | 20 | 7.14 | 114 | 128 | |
| 19 | 146 | 156 | ||||||||
| 59 | 19 | 53521.9609 | 53566.8945 | 2005 May 31 | 2005 Jul 15 | 21 | 6.68 | 136 | 134 | |
| 21 | 124 | 124 | ||||||||
| 60 | 20 | 53627.6919 | 53646.7436 | 2005 Sep 14 | 2005 Oct 03 | 20 | 2.83 | 140 | 142 | |
| 20 | 86 | 88 | ||||||||
| 61 | 20 | 53648.7212 | 53673.7304 | 2005 Oct 05 | 2005 Oct 30 | 16 | 3.72 | 74 | 92 | |
| 16 | 42 | 52 | ||||||||
| 62 | 20 | 53676.7199 | 53704.6848 | 2005 Nov 02 | 2005 Nov 30 | 18 | 4.16 | 116 | 104 | |
| 53677.7290 | 2005 Nov 03 | 14 | 4.01 | 98 | 106 | |||||
| 63 | 20 | 53706.6824 | 53734.6434 | 2005 Dec 02 | 2005 Dec 30 | 13 | 4.16 | 80 | 82 | |
| 14 | 70 | 72 | ||||||||
| 64 | 20 | 53742.6353 | 53773.6036 | 2006 Jan 07 | 2006 Feb 07 | 17 | 4.61 | 62 | 54 | |
| 17 | 86 | 84 | ||||||||
| 65 | 21 | 53875.9673 | 53906.8918 | 2006 May 20 | 2006 Jun 20 | 18 | 4.60 | 72 | 76 | |
| 53873.9700 | 53907.9678 | 2006 May 18 | 2006 Jun 21 | 20 | 5.06 | 90 | 96 | |||
| 66 | 21 | 53995.8552 | 54031.7949 | 2006 Sep 17 | 2006 Oct 23 | 19 | 5.34 | 102 | 96 | |
| 19 | 72 | 60 | ||||||||
| 67 | 21 | 54040.7623 | 54094.6978 | 2006 Nov 01 | 2006 Dec 25 | 26 | 8.02 | 108 | 106 | |
| 25 | 92 | 90 | ||||||||
| 68 | 21 | 54103.6923 | 54136.6221 | 2007 Jan 03 | 2007 Feb 05 | 13 | 4.90 | 110 | 102 | |
| 54134.6225 | 2007 Feb 03 | 12 | 4.60 | 104 | 88 |
Berdyugina et al. (1998b, 1999) produced Doppler images of II Peg for 1992–98 using what they call the “Occamian” approach. We comment here on how their images compare qualitatively to our photometric images obtained at nearly the same time.
First, it should be noted that there is a consistent tendency for corresponding spots to appear at higher latitudes in their Doppler images in comparison to our photometric images. This is likely due to our having only two filter passbands available, and . As shown in Harmon & Crews (2000), having data through four passbands available (e.g., BVRI) significantly enhances the latitude resolution of the photometric inversions compared to when only two are used. Furthermore, a spectral line profile is effectively a one-dimensional image of the stellar surface (Vogt & Penrod, 1983), while the individual data in a light curve are zero-dimensional images in that only the integrated brightness of the surface is indicated by them. Thus, Doppler imaging has intrinsically higher resolution than does photometric imaging, so it is reasonable to presume that the latitudes obtained from the Doppler images are more reliable, and thus we caution the reader that the latitudes of the spots on our photometric images should not be accepted at face value. However, the extensive simulations reported in Harmon & Crews (2000) show that relative spot latitudes can be reliably determined from LI: when two spots at different latitudes are present, the lower-latitude spot is generally rendered as such, even though the individual spot latitudes may not be accurately rendered, particularly when only two-filter data are available. Thus, we should be able to detect differential rotation in our photometric images, though we cannot go as far as to reliably determine the rotational period as a function of latitude on the stellar surface.
The 1992 August image of Berdyugina et al. (1998b) compares favorably to our Data Set 12 (1992 September 7 – October 3) photometric image, though the spot latitudes on the Doppler images are considerably higher. In both images, a large spot has an appendage projecting toward lower longitudes. Their 1993 December image shows two distinct high-latitude spots almost apart, with one moderately larger than the other. Our Set 18 (1993 December 24 – 1994 February 1) image shows what appear to be two widely-separated spots with a “bridge” connecting them. The bridge may be simply an artifact of the inversion, as such bridges are seen in simulations in which two spots close to one another are present on the artificial stellar surface. Their 1994 November and 1995 January images show a pair of spots at higher latitudes than our Group 8 (1994 October 13 – 1995 February 9) images. Our images show a pair of spots connected by a bridge. Their 1995 July image and our Set 22 (1995 June 5 – July 11) image both show a high-latitude feature which extends across a wide range in longitude. Their 1995 October image and our Group 10 (1995 September 22 – 1996 February 16) images show a pair of isolated spots well-separated in longitude, with one larger than the other.
Their Doppler image for 1996 October shows II Peg shortly before one of the time intervals over which we see good evidence for differential rotation, that of Group 11 (1996 November 4 – 1998 February 12), and their images for 1997 June, August, and December show the star during the interval covered by our images. Our results for this interval are described in §4.3 below. Similarly, their Doppler images for 1998 October and November represent the star during another interval over which we saw evidence of differential rotation, that of Group 12 (1998 September 29 – 1999 February 15), which we discuss in §4.4. We defer the comparison of their Doppler and our photometric images for these intervals to those sections.
4.1 Group 2: MJD 47417.7681 – 47556.5813
Figure 2 shows plots of the light curves for the four data sets comprising Group 2, which span the interval from heliocentric MJD 47417.7681 – 47556.5813 (1988 September 11 – 1989 January 30). Also shown in Figure 2 are the reconstructed light curves, i.e., the light curves computed from the stellar surface maps, for the cases in which the assumed inclination of the rotation axis to the line of sight is . The intensities have been normalized such that the brightest datum over the entire data set considered in this study for the given filter is set equal to 1. The quantity on each plot represents the rms deviation expressed in magnitudes between the data light curve and the reconstructed light curve.
Figure 3 shows the reconstructed surfaces obtained from these light curves via the LI procedure, with the results for an assumed axial inclination of shown in the top row, and for shown in the bottom row. Each column of two images consists of the pair of and reconstructions for the date ranges indicated at the top of the column. Note that if we let in the specific intensity distribution , where and are stellar latitude and longitude, and also reverse the direction of stellar rotation, the resulting rotational light curve is unchanged. Thus, based on photometry alone we cannot distinguish between a given brightness distribution and its mirror image. For definiteness, in generating our images we have adopted the convention that the star rotates counterclockwise as viewed from above the visible pole, so that spots would be carried across our view from left to right with the visible pole at the top of the image.


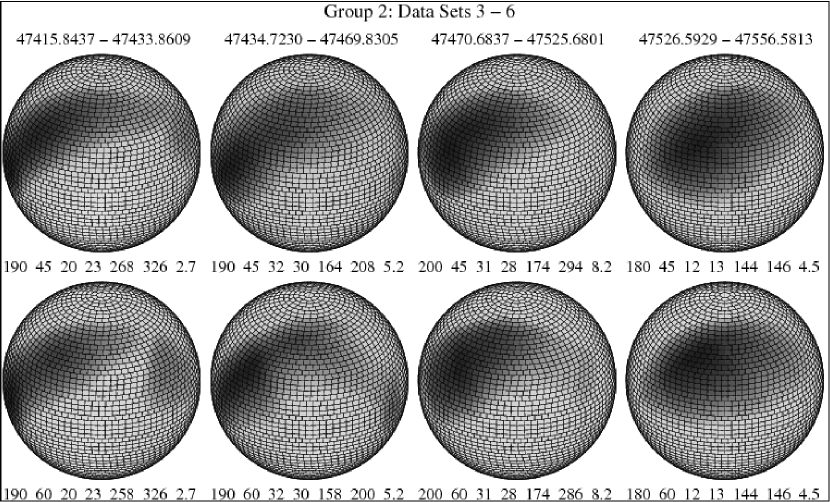
We do not show here the other 64 light curves which we inverted. Figure 2 is included so that the reader may get a sense of the comparison between the data and reconstructed light curves for a typical example. However, information about the characteristics of the source light curves along with the displayed longitude of disc center and assumed axial inclination is provided in the form of six numbers which appear below each of the reconstructed surface images we present. From left to right, these are as follows, using the values for the image at upper left in Figure 3 as examples:
-
•
“190” indicates that the longitude of disc center for the surface as displayed is . This is not to be confused with the actual sub-Earth longitude on the stellar surface, which varies from observation to observation. Unless otherwise indicated, the latitude of disc center for all surface images is , as opposed to the actual sub-Earth latitude of .
-
•
“45” indicates that for the reconstruction.
-
•
“20” and “23” are the number of data points in the and light curves used for the reconstruction, respectively.
-
•
“268” is the “effective rms noise” expressed in magnitudes (see §3) for the -filter light curve, multiplied by , so that the actual effective rms noise is 0.0268 mag in this case. Similarly, “326” indicates that the effective rms noise for the -filter light curve is 0.0326 mag. Since the -filter data were of lower noise in this case, was designated the “primary filter” for this inversion in the sense of the discussion in §2. Note that the effective rms noise used in the inversion differs from actual deviation mag reported in Figure 2 for the light curve of Set 3. The reason for this is discussed at the end of §3.
-
•
“2.7” indicates that light curve data used to create the images span 2.7 revolution periods of the binary, which we assume also to be the rotation period of the star because of tidal locking. (Note that if there is differential rotation, this rotation period can strictly speaking only apply to some particular latitude.)
Before discussing the images, it should be noted that simulations (Harmon & Crews, 2000) show that when two separate circular spots are close together, they may appear in the reconstructions as a single elongated spot because of limitations in the resolution of the method. Indeed, what appears to be a single large spot may in fact be a magnetic active region having complex structure which cannot be resolved. We will thus tend to use “spot” and “active region” somewhat interchangeably, but tending to prefer the latter terminology for a more extensive dark region on an image with a decidedly non-circular appearance. Furthermore, as mentioned above, “bridges” which appear to connect spots together may be artifacts of the inversion procedure.
The Set 3 images for both and appear to show a lower-latitude spot at left and a higher-latitude spot at right connected by a bridge. The persistence of spottedness at high latitudes near the upper center of each image suggests that there is indeed a high-latitude magnetic active region in this location, and that the bridge is not simply an inversion artifact in this case.
If II Peg exhibits differential rotation in the same sense as the Sun in that lower latitudes have higher angular velocities, then we should see the longitude difference between the lower-latitude spot and the other features diminish over time. This does appear to happen as one peruses the images from left to right. In particular, the lower-latitude spot appears to catch up to and move underneath the high-latitude active region. This could represent two separate spots which appear merged in the images due to the limited resolution of the reconstructions, or it could represent a single large active region extended in latitude, which rotates (roughly speaking) about an axis through its center due to shearing by differential rotation carrying its southern end around the star faster than its northern end.
The interpretation of the spot appearing at far right in the Set 3 images is problematic because it clearly appears at a higher latitude than the spot on the left in this pair of images, but in the Set 4 images the spot on the right appears to be at a comparable latitude to the one on the left. This may simply represent a limitation in the latitude discrimination of the spots in the inversions, which certainly isn’t perfect, particularly given that only and light curves were inverted as opposed to having more filter data available. The spot on the right appears in the image for Set 5, but not in the image. In simulations it is seen that a small spot close to a much larger spot may be “masked” by the larger spot, causing the smaller spot not to appear in the reconstruction. That this spot appears in the image suggests that such masking has occurred for the image.
It is important to note that Sets 3 and 4 were acquired over a total span of 7.9 stellar rotations and the corresponding images differ noticeably, while Set 5 by itself spans 8.2 rotations. It is thus likely that there was significant evolution of the spots during the time Set 5 was acquired. In general, all the surface images shown here should be regarded as representing a sort of “average” appearance of the starspots during the interval over which the data were collected.
It should also be noted that only twelve and thirteen observations were available for the Set 6 time span. Thus, some additional caution should be used in interpreting the corresponding images.
Figure 4 shows plots of the total span in longitude of the spotted region versus the heliocentric Modified Julian Date of the midpoint of the time interval over which the data were collected corresponding to each image shown in Figure 3. The plot on the left is for , while the one on the right is for . To obtain , an IDL111IDL is a registered trademark of ITT Visual Information Solutions, Inc. widget which displays the reconstructed image for user-adjusted values of the latitude and longitude of disc center was employed. The stellar equator was placed at disc center, and the longitude of disc center varied so as to determine the longitudes of the easternmost and westernmost dark patches within the spotted region. This is admittedly an imprecise determination, since there is no sharp delineation between what constitutes a “spot patch” versus a “photosphere patch.” Nevertheless, in practice the edges of the spotted regions in the images are reasonably well-defined, as can be seen in Figure 3 and similar figures below. A line was then fitted to the data using a simple unweighted least-squares procedure. The slope of the line represents a measure of the rate at which the longitude span of the spotted region is changing, expressed in degrees per day. There is considerable variation between the results for and , but both plots behave as would be expected if II Peg exhibits differential rotation in the same sense as the Sun: decreases with time, because the trailing region of the active region is at lower latitudes than is the leading region.


4.2 Group 3: MJD 47779.7480 – 47926.5752
Figure 5 shows inversions of Group 3, consisting of three data sets obtained from MJD 47779.7480 – 47926.5752 (1989 September 10 – 1990 February 4), with in the top row and in the bottom row. There are no light curve data for the interval 1989 January 31 – September 9. Thus, no information is available regarding the evolution of the surface between the end of the time span covered in §4.1 and that covered here.
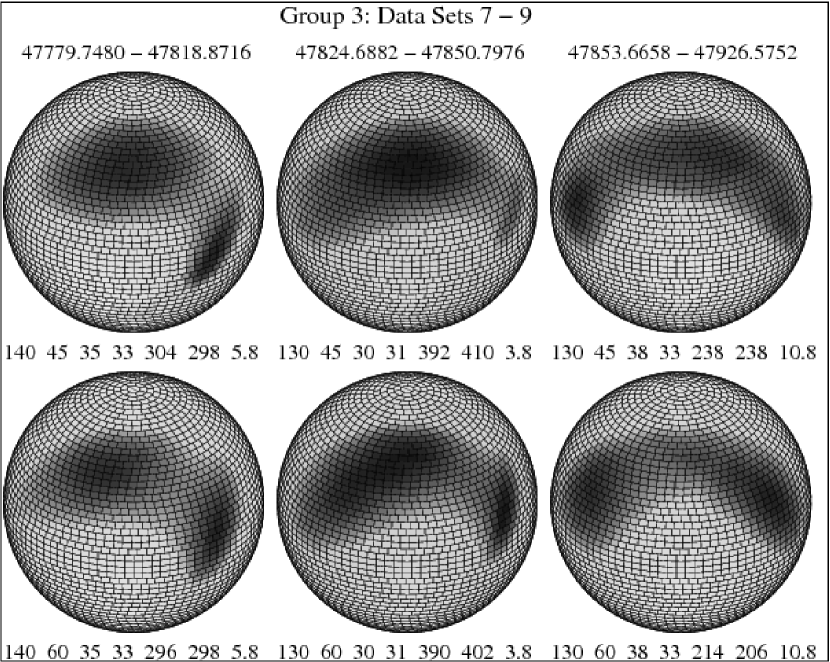
The images in Figure 5 give the distinct impression that the low-latitude spot on the right is moving away from higher-latitude active regions to its right due to differential rotation, though it should be said that the spot at far left in the third column appears to be a new feature which has emerged within the interval covered by these light curves.
An interesting question is whether or not the low-latitude spot at right in the images in Figure 5 is the same as the low-latitude spot at left in the images in Figure 3. If so, then over the combined span MJD 47417.7681 – 47926.5752 (1988 September 11 – 1990 February 4) we see the low-latitude spot go from being well behind the high-latitude spot/active region in longitude to being well ahead of it, and thus a distinctive manifestation of differential rotation.
The images are consistent with this hypothesis. The midpoint of Data Set 7 corresponding to the leftmost images in Figure 5 was at MJD 47798.8, while the midpoint of Data Set 6 corresponding to the rightmost images in Figure 3 was at MJD 47451.1, so that 257.7 days elapsed between the two midpoints. Taking for from Figure 4 as a rough estimate of rate at which the low-latitude spot should separate in longitude from the high-latitude spot/active region near the central meridian of each figure, we would expect the longitude of the low-latitude spot to have increased relative to the high-latitude spot by approximately in this time span. Using for yields a relative increase in longitude of by the low-longitude spot. The actual amount by which the low-latitude spot is ahead of the high-latitude spot in the images for Set 7 is about . If the images for Set 6 in Figure 3 are taken to represent the two spots having approximately equal longitudes, then the low-latitude spot being ahead in Set 7 is within the range of – suggested by the plots in Figure 4.
Figure 6 shows how for the Group 3 data sets varies in time, obtained via the same procedure as the plots in Figure 4. In this case we expect for solar-sense differential rotation, since the low-latitude spot now starts out ahead in longitude. The magnitudes of the slopes are comparable to those in the plots in Figure 4, strengthening the interpretation that we are seeing the effects of differential rotation throughout this data set and that discussed in the preceding section.


4.3 Group 11: MJD 50391.8348 – 50856.5946
Figure 7 shows the inversions of Group 11, consisting of seven data sets obtained from MJD 50391.8348 – 50856.5946 (1996 November 4 – 1998 February 12), all for an assumed inclination of . Figure 8 shows inversions of the same light curves for . The first 4 images (Sets 27 – 30) in both figures appear to show a trailing low-latitude spot at left catching up with and passing under a high-latitude feature near the central meridian, highly suggestive of differential rotation in the same sense as that of the Sun.
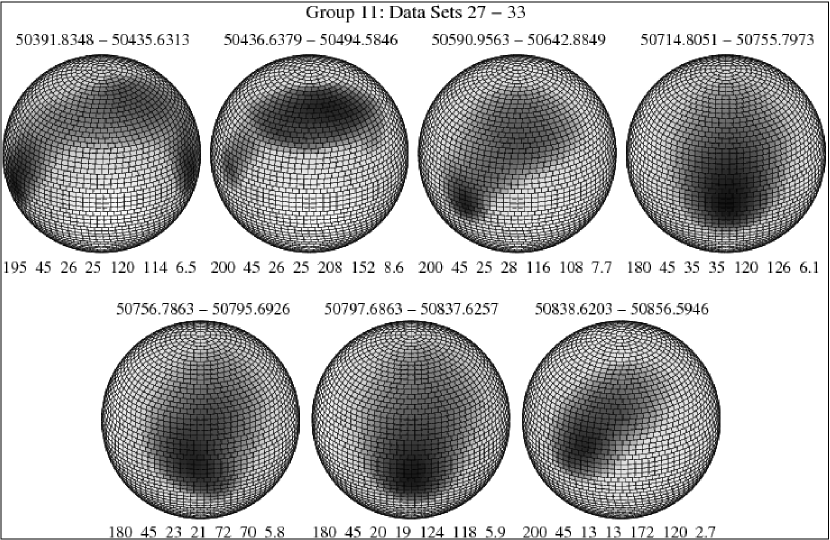
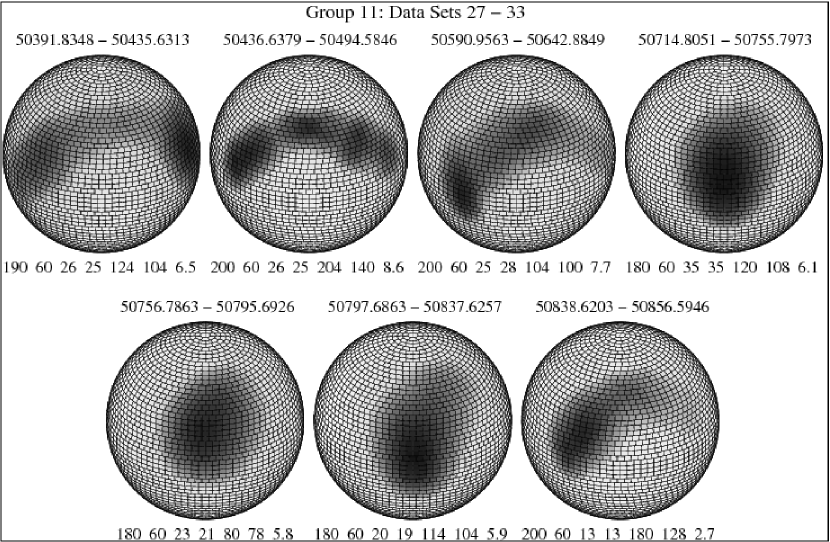
From this we would expect to see the low-latitude spot begin to lead the high-latitude feature and thus appear to the right of it in the next three images (Sets 31 – 33). In the image for Set 31, some hint that this is occurring is seen in the way that the dark southern part of the spotted region is tilted along a diagonal such that its southernmost extension is ahead in longitude. This is not seen in the corresponding image.
The Set 32 images for both inclinations are similar to the Set 30 images. One may speculate that when previously separate large active regions are carried into proximity by differential rotation, they may merge or otherwise interact such that magnetic tension resists deformation or separation by the differential rotation of the surrounding plasma. If so, this would argue against our interpretation that the southern spot in the data set described in §4.2 is the same as that seen in the 4.1 data. However, it may be that whether or not this proposed suppression of differential rotation occurs depends on the details of the magnetic field configuration and the minimum separation achieved.
The Set 33 images show high-latitude activity leading the southern portion of the spotted region in longitude. This gives the appearance of the sense of the differential rotation having reversed, but it should be noted that both the and the light curves inverted to create these images had only 13 data points, which calls the reliability of these images into question. It is also possible that new high-latitude spot activity had simply emerged. This interpretation is supported by the appearance of the images for Set 32, particularly for the inversions. High-latitude activity does seem to be protruding at the northern end of the spotted region, which may represent the beginning of the emergence of new magnetic flux.
Berdyugina et al. (1998b) present Doppler images for 1996 October and 1997 June, August, and December, the first of which shortly precedes and the latter three of which overlap in time with the photometric images discussed in this section. We have no data for 1996 October, but their image gives some indication of the high-latitude region seen in between the two initial spots in our later images. As is typically the case, the spots seen in their Doppler images are at higher latitudes than in our photometric images.
Their 1997 June image shows a large high-latitude active region with a large extent in longitude, along with a pair of lower-latitude spots. In their 1997 August image, the extent in longitude of the large active region has diminished considerably, and it appears that this is largely due to the disappearance of activity at the leading edge of the region. A smaller spot persists on the opposite side of the star. In their 1997 December image, the width in longitude of the large active region has further diminished, but this time it appears that either the activity along the trailing edge has diminished, or that the trailing edge has caught up to other parts of the region. There is a southward projection at the trailing edge which is not present in the 1997 August image.
Our Set 29 (1997 May 22 – July 13) images differ considerably from their 1997 June image. Ours show a spot close to the equator trailing a higher-latitude active region. Our Set 27 (1996 November 4 – December 18) images show the larger low-latitude spot present in their 1997 June image, which appears to fade in our Set 28 (1996 December 19 – 1997 February 15) images. Our Set 30 (1997 September 23 – November 3), Set 31 (1997 November 4 – December 13), and Set 32 (1997 December 15 – 1998 January 24) images are comparable to their 1997 December image in showing a single large active region on one side of the star. The southern protrusion in their image could explain the fact that our images show activity down to near the equator, though in their image the protrusion only extends down to latitude.
Figure 9 shows plots of the variation in with time for the seven data sets in Group 11. The two plots at top include only the results for the first four data sets for each inclination, while the two at bottom include all seven sets. The fits are better for the former two since as discussed above, the trend toward narrowing of the spotted region in longitude ceases for the latter three data sets.


4.4 Group 12: MJD 51085.9791 – 51224.5942
Figure 10 shows inversions for of Group 12, consisting of four data sets obtained from MJD 51085.9791 – 51224.5942 (1998 September 29 – 1999 February 15), while Figure 11 shows the same for . In both figures, the images in the top row have latitude at disc center, while for the images in the bottom row the north (visible) rotation pole is at disc center.
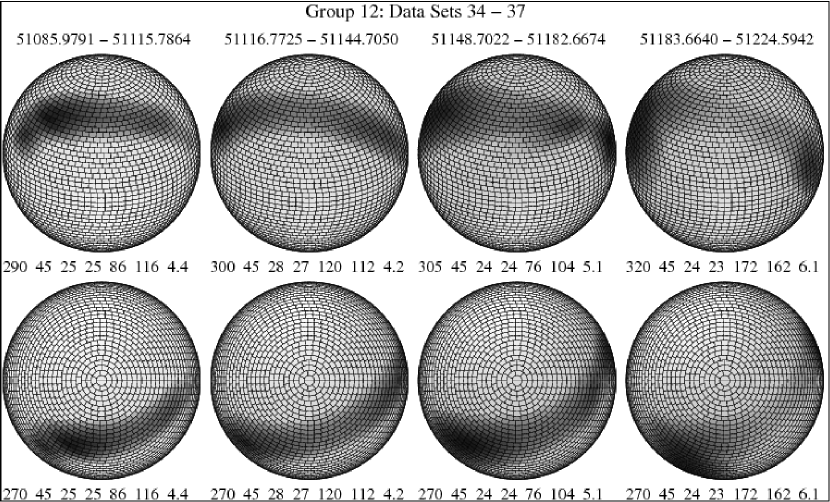
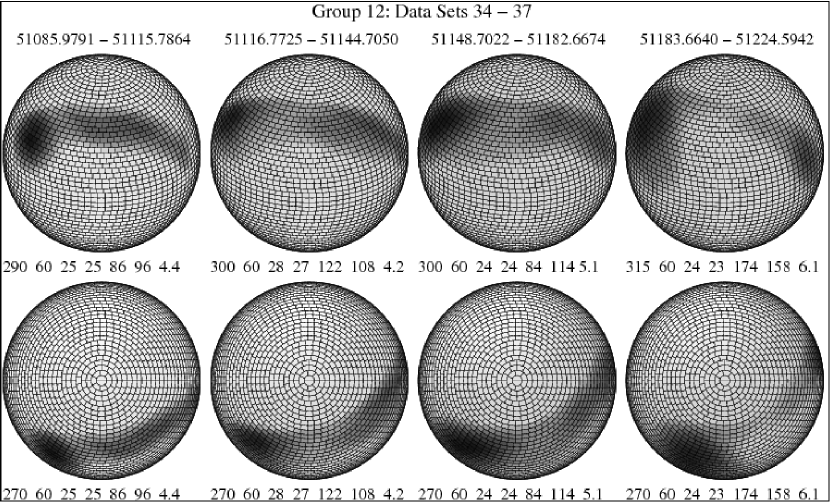
For both assumed inclinations, the images show a leading low-latitude spot or active region at right and a trailing high-latitude spot/active region at left. As time progresses, the separation in longitude between these features increases, just as would be expected if solar-sense differential rotation is carrying the low-latitude feature around the star faster than the high-latitude region. This is most easily seen in the images looking down on the pole.
Note that the degree of magnetic activity appears to increase on both ends of the spotted region during this time span.
Berdyugina et al. (1999) present Doppler images for 1998 October and November which overlap the interval under consideration here. Their 1998 October image shows an active region spread extensively in longitude that is not resolved into separate spots; in the November image, this region appears split into three separate spots. The difference is conceivably due to the variation in the noise artifacts between the two images. Our Data Set 35 (1998 October 30 – November 27) image shows a similar elongated feature, but lacks the southward protrusion seen in the middle region of the active region in the Doppler images.
Figure 12 shows the variation of with time for this time interval. As expected, increases with time, since the low-latitude, faster-moving activity is leading in longitude.


4.5 Group 13: MJD 51429.8915 – 51586.5994
Figure 13 shows inversions of Group 13, composed of four light curves obtained between MJD 51429.8915 – 51586.5994 (1999 September 8 – 2000 February 12), with for the top row and for the bottom row. For both assumed inclinations, the trailing edge of the spotted region appears to be at lower latitudes than the leading edge. This may represent two separate spots which are too close to be resolved, or two spots embedded within an active region.
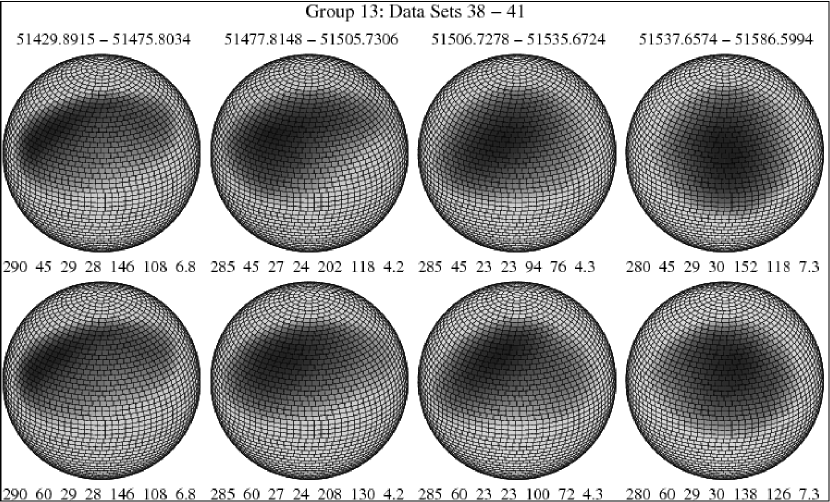
For differential rotation in the same sense as the Sun, we expect that over time the separation in longitude between the leading and trailing edges (or the two spots) should diminish. This is what is seen. The last pair of images appear to show that the low-latitude trailing spot (or extension of the spotted region) has caught and passed underneath higher-latitude activity.
Gu et al. (2003) produced surface maps of II Peg via Doppler imaging for 1999 July – August, 2000 February and 2001 November – December, the first two of which are relevant to the present discussion. Their 1999 July – August image is qualitatively similar to our Set 38 (1999 September 8 – October 24) images, showing a broad region of high-latitude activity with southward projections at its leading and trailing ends, with the trailing end projecting further south. Their 2000 February image primarily gives the appearance that the active region may have simply shrunk in longitude. However, it could also be argued that the trailing edge has caught up to the leading edge.
Figure 14 shows that the the extent in longitude of the spotted region described here diminishes with time, as expected for solar-sense differential rotation.


4.6 Group 14: MJD 51805.8758 – 51946.6051
The final time interval over which we saw good evidence for differential rotation was from MJD 51805.8758 – 51946.6051 (2000 September 18 – 2001 February 6), which we partitioned into three data sets which were assigned to Group 14. Figure 15 shows the corresponding inversions, with assumed inclination for top row and for the bottom row.
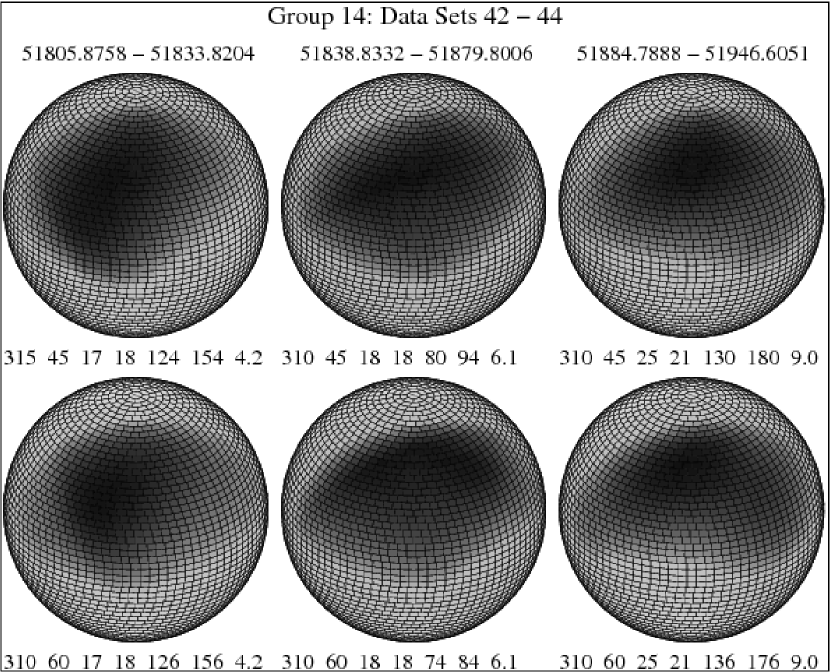
For both values of , a protrusion toward lower latitudes can be seen at the bottom of the spotted region. This protrusion appears to drift toward greater longitudes over the time interval covered by these observations, suggesting that it is a spot being carried around the equator faster than the rest of the spotted region because of differential rotation.
However, we cannot quantify this differential rotation by plotting the variation of with time as for the data groups discussed above, because in this case the total extent in longitude of the active region did not change significantly. The easternmost and westernmost fringes of the active region appear to lie at similar middle latitudes, so that we would not expect to change due to differential rotation here. The longitude of the southward protrusion is within the range of longitudes spanned by the activity to its north, so that its drift in longitude relative to the rest of the spotted region is not manifested in the variation of .
Instead, in Figure 16 we show the variation in longitude of the middle of the southern protrusion with time. This is admittedly a vague conception due to the amorphous nature of the protrusion in these images, which is likely just an artifact of the limitations in the resolution of the inversions. The procedure was to use the same IDL widget used to obtain for other data sets to estimate the longitude of the midpoint of the southern boundary of the protrusion. The same results were obtained for both and . As can be seen in Figure 16, the longitude of the protrusion (or spot) increases approximately linearly with time, as would be expected from differential rotation if the protrusion or spot maintains an essentially fixed latitude.

5 Discussion
In this study, we obtained images of the surface of II Pegasi by inverting data sets consisting of light curves collected over intervals of several months to look for evidence of differential rotation in the changes in the spot configurations. By contrast, Henry et al. (1995) inferred the presence of differential rotation using the very different approach of determining the rotation periods of individual spots observed over spans of several years. It is of interest to ascertain whether or not the results presented here are consistent with the earlier study.
In contrast with the relation used by Henry et al. given by equation (2), in the present study it is more natural to characterize the differential rotation in terms of the rate of change in the difference in longitude between spots at different latitudes in our images.
If for simplicity we express longitudes in a non-rotating frame of reference (rather than in the co-rotating frame used in the rest of this work), the longitude as a function of time for a spot having latitude is just
| (17) |
where is the longitude of the spot at time , and is the angular rotation frequency for latitude , with being the corresponding rotational period. From this the difference in longitude of two spots at latitudes and is simply
| (18) |
where is the separation at and . Thus, a plot of versus will have slope .
In terms of the rotational angular frequency, equation (1) becomes
| (19) |
so that
| (20) |
In principle, then, if we observe two spots at known latitudes and plot versus to find the slope , we can find from equation (20).
In practice, this is not possible because we cannot reliably determine precise spot latitudes from our photometric inversions. However, we can use the plots in Figures 4, 6, 9, 12 and 14 to make reasonable estimates of the value of . In these figures, represents the extent in longitude of an active region rather than the longitude difference between two spots, because the former could be more reliably estimated from our images.
Using the revolution period of the binary as our estimate of , we find . Excluding the plots having seven data points in Figure 9, the slopes obtained from the plots for range from to , with a mean of . If we assume that and (which is almost certainly an overestimate of the spread in latitude responsible for the change in , particularly given the results of Doppler imaging), we obtain a minimum value for of , a maximum value of , and a mean value of . For , from the slopes of the plots (again excluding the seven-data-point plot in Figure 9) ranges from to with a mean of . These yield a minimum value for of , a maximum value of , and a mean of . These results accord well with the value obtained for II Peg by Henry at al., which lends credence to our assertion that our images represent genuine demonstrations of differential rotation, and to the assertion of Henry et al. that stretching of active regions by differential rotation accounts for features of the light curve of II Peg not explainable by their simple two-spot model.
Of course, the values obtained for are increased if the span of latitude is not from pole to equator. The Doppler images of Berdyugina et al. (1998b, 1999) show activity extending from mid-to-high latitudes, but not including any polar spots, so it seems reasonable to use and in our estimates. For , this results in minimum, maximum and mean values for of , , and , respectively. For the corresponding values are , , and . These results do not agree as well with the result of Henry et al., but are certainly of the same order. It should also be noted that Henry et al. assumed that the spots they observed spanned a range in latitude from pole to equator, so that they too would have obtained a larger value of had they assumed a smaller range.
References
- Berdyugina & Tuominen (1998) Berdyugina, S. V., & Tuominen I. 1998, A&A, 336, L25
- Berdyugina et al. (1998a) Berdyugina, S. V., Jankov, S., Ilyin, I., Tuominen, I., & Fekel, F. C. 1998a, A&A, 334, 863
- Berdyugina et al. (1998b) Berdyugina, S. V., Berdyugin, A. V., Ilyin, I., & Tuominen, I. 1998b, A&A, 340, 437
- Berdyugina et al. (1999) Berdyugina, S. V., Berdyugin, A. V., Ilyin, I., & Tuominen, I. 1999, A&A, 350, 626
- Boyd et al. (1987) Boyd, P. T., Garlow, K. R., Guinan, E. F., McCook, G. P., McMullin, J. P., & Wacker, S. W. 1987, Inf. Bull. Var. Stars, No. 3089
- Byrne & Marang (1987) Byrne, P. B., & Marang, F. 1987, Irish Astron. J., 18, 84
- Doyle et al. (1989) Doyle, J. G., Butler, C. J., Byrne, P. B., Rodonò, M., Swank, J., & Fowles, W. 1989, A&A, 223, 219
- Chugainov (1976) Chugainov, P. F. 1976, Iz. Kry. 57, 31
- Craig & Brown (1986) Craig, I. J. D., & Brown, J. C. 1986, Inverse Problems in Astronomy (Boston: A. Hilger)
- Frasca et al. (2008) Frasca, A., Biazzo, K., Taş, G., Evren, S. & Lanzafame, A. C. 2008, A&A, 479, 557
- Gray (1992) Gray, D. F. 1992, The Observation and Analysis of Stellar Photospheres (Cambridge: Cambridge University Press)
- Gu et al. (2003) Gu, S.-H., Tan, H.-S., Wang, X.-B., & Shan, H.-G. 2003, A&A, 405, 763
- Hall & Henry (1994) Hall, D. S., & Henry, G. W. 1994, IAPPP Comm., 55, 51
- Harmon & Crews (2000) Harmon, R. O., & Crews, L. J. 2000, AJ, 120, 3274
- Henry (1995a) Henry, G. W. 1995, in Robotic Telescopes: Current Capabilities, Present Developments, and Future Prospects for Automated Astronomy, ASP Conf. Ser. Vol. 79, eds. G. W. Henry and J. A. Eaton (Provo: Astronomical Society of the Pacific), p. 37
- Henry (1995b) Henry, G. W. 1995, in Robotic Telescopes: Current Capabilities, Present Developments, and Future Prospects for Automated Astronomy, ASP Conf. Ser. Vol. 79, eds. G. W. Henry and J. A. Eaton (Provo: Astronomical Society of the Pacific), p. 44
- Henry et al. (1995) Henry, G. W., Eaton, J. A., Hamer, J., & Hall, D. 1995, ApJS, 97, 513
- Kurucz (1991) Kurucz, R. L. 1991, Harvard Preprint 3348
- Messina (2008) Messina, S. 2008, 480, 495
- Nations & Ramsey (1981) Nations, H. L., & Ramsey, L. W. 1981, AJ, 86, 433
- O’Neal, Saar, & Neff (1998) O’Neal, D., Saar, S. H., & Neff, J. E. 1998, ApJ, 501, L73
- Poe & Eaton (1985) Poe, C. H., & Eaton, J. A. 1985, ApJ, 289, 644
- Rodonò et al. (1986) Rodonò, M. et al. 1986, A&A, 165, 135
- Rodonò et al. (2000) Rodonò, M., Messina, S., Lanza, A. F., Cutispoto, G., and Teriaca, L. 2000, A&A, 358, 624
- Rucinski (1977) Rucisnski, S. M. 1977, PASP, 89, 280
- Thompson & Craig (1992) Thompson, A. M., & Craig, I. J. D. 1992, A&A, 262, 359
- Turchin (1967) Turchin, V. F. 1967, USSR Comput. Math. and Math. Phys., 7, 79
- Twomey (1977) Twomey, S. 1977, Introduction to the Mathematics of Inversion in Remote Sensing and Indirect Measurements (Amsterdam: Elsevier)
- Van Hamme (1993) Van Hamme, W. 1993, AJ, 106, 2096
- Vogt (1981a) Vogt, S. 1981a, ApJ, 247, 975
- Vogt (1981b) Vogt, S. 1981b, ApJ, 250, 327
- Vogt & Penrod (1983) Vogt, S. S., & Penrod, G. D. 1983, PASP, 95, 565
- Wild (1989) Wild, W. J. 1989, PASP, 101, 844