Radius-expansion burst spectra from 4U 172834: an ultracompact binary?
Abstract
Recent theoretical and observational studies have shown that ashes from thermonuclear burning may be ejected during radius-expansion bursts, giving rise to photoionisation edges in the X-ray spectra. We report a search for such features in Chandra spectra observed from the low-mass X-ray binary 4U 1728-34. We analysed the spectra from four radius-expansion bursts detected in 2006 July, and two in 2002 March, but found no evidence for discrete features. We estimate upper limits for the equivalent widths of edges of a few hundred eV, which for the moderate temperatures observed during the bursts, are comparable with the predictions. During the 2006 July observation 4U 172834 exhibited weak, unusually frequent bursts (separated by hr in some cases), with profiles and -values characteristic of hydrogen-poor fuel. Recurrence times as short as those measured are insufficient to exhaust the accreted hydrogen at solar composition, suggesting that the source accretes hydrogen deficient fuel, for example from an evolved donor. The detection for the first time of a 10.77 min periodic signal in the persistent intensity, perhaps arising from orbital modulation, supports this explanation, and suggests that this system is an ultracompact binary similar to 4U 182030.
Subject headings:
stars: neutron — X-rays: binaries — X-rays: bursts — X-rays: individual(4U 1728-34 (catalog ))1. Introduction
One of the highest priorities for observational studies of neutron stars is measurement of the mass and radius, sufficient to constrain the uncertain equation of state (EOS; e.g. Lattimer & Prakash, 2007). A promising avenue to achieve such measurements is to detect surface spectral features from accreting neutron stars, which may preferentially show such features during thermonuclear (type-I) bursts, caused by unstable ignition of accreted H/He on the surface of the neutron star. Identifying such features allows measurement of the surface redshift, and hence the compactness ( ratio), which in turn allows constraints to be placed on the EOS. In recent years, only one claim for such features has been made Cottam et al. (2002), and subsequent efforts have not been able to confirm this result (e.g. Cottam et al., 2008)111Additionally, the case for slow rotation in this system (required to produce lines as narrow as those observed) has weakened, with the detection of burst oscillations at 552 Hz Galloway et al. (2010).. The majority of observational efforts to date have focussed on sources which show frequent bursts, which tend to be faint. Another class of bursts are significantly brighter, since the flux during the burst rise exceeds the Eddington limit (e.g Lewin et al., 1993), at which point the radiation pressure of the burst luminosity exceeds the local gravity. Recent theoretical work suggests that such bursts could drive a wind containing heavy-element ashes from the burning, which would imprint absorption features on the X-ray spectrum at the peak of the burst Weinberg et al. (2006). Observational support for this hypothesis has been found from the low-resolution spectra of extremely intense “superexpansion” bursts. These bursts are the most intense of those thought to be powered by H/He, in contrast to the even longer, infrequent “superbursts”, which are thought to be powered instead by carbon (e.g. Cumming et al., 2006). In superexpansion bursts observed by the Rossi X-ray Timing Explorer (RXTE), in ’t Zand & Weinberg (2010) found highly significant residuals for fits with a blackbody model. The residuals could be explained by absorption edge features, with energies consistent with highly-ionised iron-peak elements and depths indicative of abundances times solar. However, the relatively poor spectral resolution prevents identification of the features.
Here we describe an attempt to detect and measure the X-ray spectrum at the peak of radius-expansion bursts using the Chandra High energy Transmission Grating Spectrometer (HETGS). Few sources reliably show frequent, radius expansion bursts, and the key challenges for this search are the identification of a target and the observation triggering. One candidate is the globular cluster source 4U 182030 which orbits in an ultracompact binary ( s Stella et al., 1987) and thus likely accretes almost pure helium. This system only exhibits bursts when in the minimum of its -d intensity cycle (e.g. Priedhorsky & Terrell, 1984), and on one occasion was observed to produce 7 radius-expansion bursts separated by 193 min on average Haberl et al. (1987). However, frequent bursts are not consistently observed, and recent pointed observations targeting the long-term minima have had limited success, for example detecting only four bursts in 1 Ms of Rossi X-ray Timing Explorer observations (e.g. Galloway et al., 2008). A better target is 4U 172834, a well-known burst source for which the accretion rate does not reach such extreme values, and is typically . This rate is substantially lower (by almost an order of magnitude) than the maximum reached by 4U 182030 and 4U 172834 commonly produces radius-expansion bursts every –5 hr. The burst properties are otherwise similar to those of 4U 182030 Cumming (2003), and as we show here, it is possible that 4U 172834 is also an ultracompact system.
| Data | Exposure | No. of | |||||
|---|---|---|---|---|---|---|---|
| No. | Date | Instrument | obsid | mode | (ks) | bursts | Ref. |
| 1 | 2002 Mar 4 | Chandra | 2748 | TE | 29.4 | 2 | [1] |
| 2 | 2002 Oct 29 | XMM-Newton | 0149810101 | Timing (PN) | 28.1 | 0 | |
| 3 | 2006 Jul 17–18 | Chandra | 6568 | CC | 49.5 | 4 | [2, 3] |
| 4 | 2006 Jul 18–20 | Chandra | 6567 | CC | 151.8 | 18 | [2, 3] |
| 5 | 2006 Jul 22-23 | Chandra | 7371 | CC | 39.7 | 3 | [2, 3] |
2. Observations & analysis
We observed 4U 172834 between 2006 July 17–23 with the HETGS Canizares et al. (2005) aboard Chandra. The HETGS consists of two separate grating arrays (the Medium- and High-Energy Gratings, MEG and HEG) which intercept about 40% of the incoming photons and disperse them linearly along the Advanced CCD Imaging Spectrometer (ACIS). These instruments together provide spectra in the range 1.2-31 Å (10-0.4 keV) with spectral resolution () of up to 1000, and wavelength resolution of up to 0.012 Å. We adopted the continuous clocking (CC) observing mode, for which the ACIS-S CCDs are read out continuously. This sacrifices one axis of spatial imaging but allows much higher incident photon countrates before photon pileup (multiple photons arriving at the same pixel in the same frame time) becomes a problem. Such mitigation strategies are necessary to deal with the highly variable incident count rates for a bursting source, but complicates the data reduction and spectral analysis. Specifically, CC-mode observations prevent the usual order sorting for dispersed spectra, which rely (in part) on both spatial axes, although the photon energy measured by the CCD allows unambiguous order sorting, at least for low dispersion orders. CC-mode observations also prevent extraction of the usual background spectrum.
We reduced the Chandra data with ciao version 4.0 (December 2007; Fruscione et al., 2006), using the calibration database (CALDB) version 3.4.2. We undertook spectral fitting with isis version 1.4.9-4 Houck & Denicola (2000). We calculated response matrices (using mkgrmf) and ancilliary response files (using fullgarf) for each observation. We also used the response and ancilliary files calculated for the entire observation to analyse the spectra from any bursts detected in those observations.
We also analysed archival Chandra timed exposure (TE) mode observations of 4U 172834 made on 2002 March 4, as well as archival XMM-Newton observations from 2002 October 29. We analysed the XMM-Newton data using the Science Analysis Software (SAS) version 7.0.0 (June 2006). We used data from the European Photon Imaging Camera (EPIC) pn CCD camera Kuster et al. (2002), which was operated in timing mode. The EPIC pn camera is sensitive to photons in the range 0.15–15 keV, and with an effective area peaking at around 1400 cm2 at 2 keV. As with CC-mode for Chandra, in pn timing mode the central CCD alone is read out continuously, providing an effective time resolution of 0.03 ms. The observations used in this paper are summarised in Table 1.
3. Results
We obtained in 2006 July three separate pointings of approximately 50, 150 and 40 ks each, spanning almost 6 days, and detecting four, eighteen, and three bursts in each segment (respectively). We first analysed the persistent source spectrum between the bursts, to establish the persistent X-ray intensity. The raw lightcurve indicated significant variations in the persistent count rate from observation to observation, and also between each inter-burst interval. Thus, we divided each observation into segments delineated by each pair of bursts, excluding the intervals up to 150 s after each burst and 50 s before the next burst. For the first bursts of each pointing, we integrated from the beginning of the pointing to 50 s before the burst. We then fit the summed, first-order MEG and HEG spectra simultaneously in the energy range 2.1–8.3 Å(6–1.5 keV) with an absorbed comptonisation model, motivated by earlier broad-band spectroscopic measurements (see Misanovic et al. 2010, hereafter M10, for full details of the persistent spectral fitting, and references theirein for additional analyses of the persistent spectrum seen by Chandra). The neutral column density was fixed at .
Like many low-mass X-ray binaries (LMXBs), 4U 172834 shows substantial variation in its X-ray spectrum and intensity on a range of timescales, from days to decades (e.g. Lewin et al., 1993), and the spectral “states” influence the burst properties. The integrated persistent flux during the 2006 Chandra observation was in the range 1.16– (1.5–6 keV), equivalent to at least 3– in the 2.5–25 keV band, based on the extrapolated spectral model. These values are atypically high for the source; extensive earlier observations with RXTE found the source in this flux range only 10% of the time Galloway et al. (2008). In the absence of spectral information above 10 keV, it is difficult to identify the source spectral state; however, the nearest RXTE observation, on 2006 July 24222Observation ID 92023-03-72-00, found a characteristically “soft” spectrum (e.g. with electron temperature for a compTT spectral component of 4.6 keV), and X-ray colors indicating the source was in the lower “island” region of the X-ray color-color diagram (see e.g. Galloway et al., 2008). The source flux was highest during the longest (second) pointing, consistently above (1.5–6 keV). In contrast to previous observations (e.g. D’Aí et al., 2006), no iron lines were detected in the persistent spectrum. For a distance to the source of 5.2 kpc (from the peak flux of radius-expansion bursts observed by RXTE; Galloway et al., 2008), and a bolometric correction which assumes a characteristic high-state “soft” spectrum (with electron temperature of 3 keV, c.f. with Falanga et al., 2006), the corresponding range of accretion rate is 4–7%333Note that the fraction will be correspondingly higher for nonzero H-fraction, for example 6–11% of the Eddington rate , assuming H-fraction in the accreted fuel of . of the Eddington rate (, assuming pure He accretion).
3.1. The X-ray bursts
We detected 25 bursts during the 2006 July observations (Fig. 1). The four bursts in the first observation (#6568) were separated by hr on average, while in the second and third observations (#6567, 7371) the mean recurrence time was significantly shorter, at hr. The bursts themselves were short, with rise times of s and lasting only s (Fig. 2). The four bursts in the first segment (observation #6568) were the brightest, with the bursts in the second and third segments reaching count rates only approximately 2/3 the peak as in the first segment. A more detailed discussion of the burst properties and the inferred ignition conditions can be found in M10.


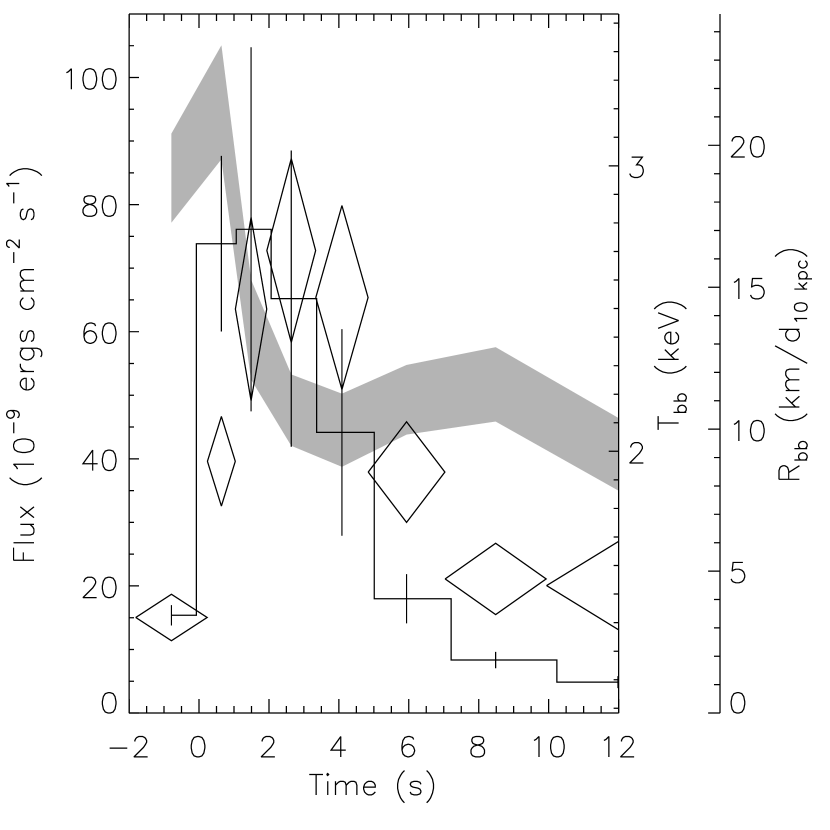
Two of the bursts in the first observation (#6568) had indications of a constant intensity at maximum, lasting s. Since constant luminosity in the peak is an indication of radius-expansion, we carried out time-resolved blackbody spectral fits of the combined first-order HEG and MEG data for each set of bursts in each observation, to test for the characteristic variations in the blackbody radius and temperature expected for radius-expansion bursts. Following the conventional approach, we subtracted the pre-burst emission as background, and estimated the bolometric flux based on the blackbody spectral parameters. The average peak flux for the bursts in the three observations (#6568, 6567 and 7371) was , and , respectively. We found evidence for an elevated blackbody radius, coincident with a decrease in the blackbody temperature, only for the first four bursts (Fig. 3). While we did not fully resolve the rise in blackbody radius, this may largely have been due to the relatively low count rate early in the burst coupled with the steep rise time. These variations suggest that the first four bursts exhibited radius-expansion. Although the confidence interval for the mean fluxes for the subsequent bursts were consistent with the maximum reached by radius-expansion bursts observed by other instruments Galloway et al. (2003), the time-resolved spectral variations in those bursts gave no indications of radius-expansion.
We measured the ratio (e.g. Gottwald et al., 1986) of the integrated persistent flux within each interval between the bursts, to the integrated flux of the subsequent burst (from time-resolved spectral fits; see M10) and obtained values which were 190 in the mean. The rapid timescales of the bursts, as well as the high -values, are both consistent with ignition of primarily He fuel. Although both the persistent flux and the burst recurrence times varied significantly, we found no correlation between the two, as might be expected (under the usual assumption that the persistent flux tracks the accretion rate). As discussed by M10, this lack of correlation may result from incomplete burning, or alternatively a varying area over which accretion takes place on the neutron star.
3.2. Search for spectral features during the bursts
We made a search for discrete features in the spectra from the bursts observed by Chandra in 2006 July. We first focussed on the four bursts observed in the first observation, #6568, since only these exhibited any evidence for photospheric radius-expansion. We extracted spectra from various time intervals of each burst, and combined the orders to obtain a single first-order spectrum for each grating arm (HEG and MEG). We searched spectra extracted from 0–2 s (relative to the burst start time), and 0–4 s. The combined total counts in HEG/MEG first-order for each of these intervals was 926/912 and 1740/1591. We grouped the bins by various factors to obtain bin widths of 0.01, 0.03, 0.05, 0.11 and 0.22 Å, in order to search for both broad and narrow features. Since the counts per bin for these spectra was at short and long wavelengths (away from the peak sensitivity) we adopted Gehrels weighting to determine errors on each bin, which better approximates Poisson uncertainties for low counts. This is preferable over the alternative approach, i.e. to bin adaptively to ensure some minimum number of counts per bin, since absorption features that saturate the spectrum and reduce the counts to zero will be missed. We fit each pair (HEG and MEG) of first-order spectra using an absorbed blackbody with column density fixed at (derived from fits covering the first 2 seconds of each burst; see also M10). We set a detection threshold of 3-, taking into account the total number of bins (HEG+MEG) in each time interval and binning.
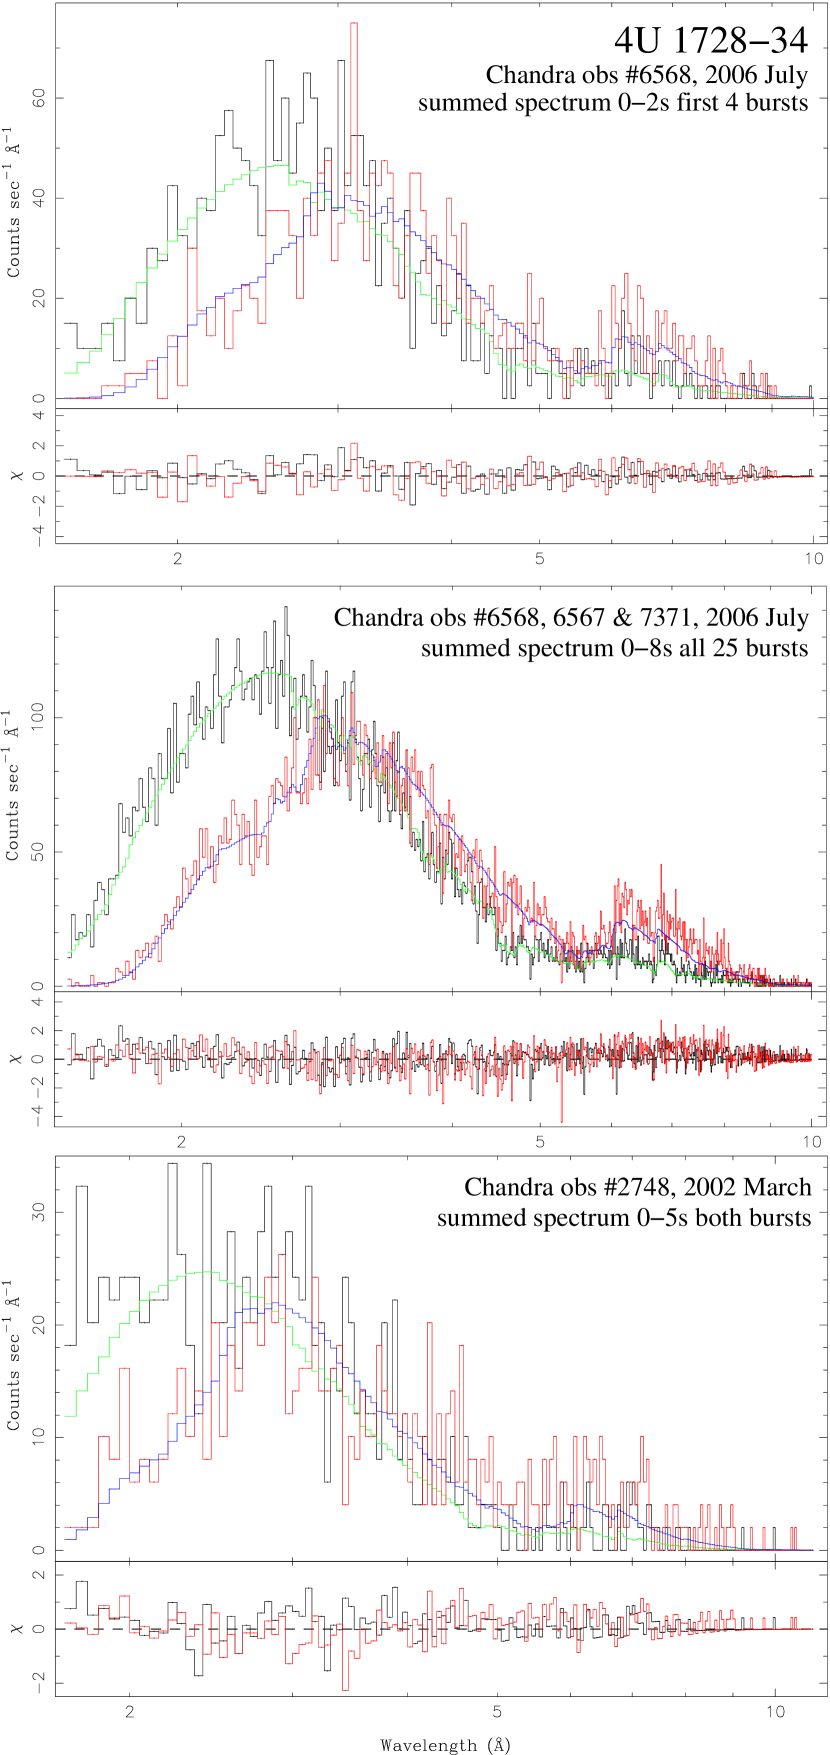
We found no significant deviations from the blackbody (continuum) for any choice of binning, in either time interval. For the spectra extracted from the first two seconds of the bursts, which likely covers the entire radius expansion interval, we derive upper limits for emission/absorption lines of equivalent width in the range 100–180 eV. We show the spectrum extracted over this interval in Figure 4, top panel.
We also estimated the upper limits on detection of absorption edges in the spectra. We added edge components to the model with the edge energy fixed at Å(4 keV), roughly where the observed count rate per bin of both HEG and MEG reached a maximum, in order to measure the best achievable limit with the available data. We found a upper limit of 0.26 (0.20) on the optical depth for the 0–2 s (0–4 s) spectra respectively, corresponding to equivalent widths of 280 (250) eV. We also searched spectra from after the radius expansion episode, in case the photosphere was too hot during radius-expansion for neutral or incompletely-ionised species to survive. In spectra extracted from time window covering 2–16 and 4–16 s after the burst start, we obtained upper limits as before on edges of 250 and 260 eV, respectively.
Although the bursts observed in the second and third observations (#6567 and 7371) likely did not exhibit radius-expansion, we undertook a second search of spectra extracted from a wider choice of time intervals (relative to the start) of all 25 bursts. The combined total counts in HEG/MEG first-order for each of these intervals, i.e. 0–2, 0–4, 0–8 and 0–16 s, as well as 2–16, 4–16 and 8–16 s was 3540/3350, 7670/7180, 12880/12470, 18680/19190, respectively. We found no broad or narrow features that exceeded our confidence threshold for any choice of time interval or binning. The most significant deviation was in the MEG spectra extracted from 0–8 s of all 25 bursts, and binned at 0.03 Å, in which a single bin around 5.28 Å was below the model fit at a significance of almost (Fig. 4, middle panel). No similar feture was seen in the HEG spectrum.
Despite several attempts in recent years, observations of radius-expansion bursts by Chandra or XMM-Newton have eluded observers. In fact, we are aware of only one other confirmed radius-expansion burst, which was detected on 2002 March 4 22:42:45 (MJD 52337.94637) in observation #2748 (Table 1). This burst was also detected by RXTE (burst #101 in Galloway et al., 2008), and was found to exhibit photospheric radius expansion. This event was preceded by a similar burst at UT 18:35:24 (MJD 52337.77459), 4.12 hr earlier. Under the assumption that this burst too reached the Eddington limit, we extracted spectra from the peak and the tail of each burst, and combined them to search for discrete spectral features.
Unlike the observations in 2006 July, observation #2748 was performed in Timed Exposure (TE) mode, with the CCDs read out every 1.44 s. The extreme brightness of the source during the radius expansion bursts likely led to substantial pileup during the bursts, although this was not obvious from the dispersed burst spectra. We combined spectra from the HEG and MEG order from the first five and next 14–19 seconds of the two bursts, and examined the spectra for any evidence of discrete features. Due to the small number of total counts in the two sets of spectra (600–800 counts total in each grating arm), we rebinned the HEG (MEG) by a factor of 20 (10) to achieve a bin size of approximately Å. We obtained an acceptable fit using an absorbed blackbody model, and found no discrete features which exceeded our detection threshold (taking into account the number of spectral bins). A representative spectrum, from the first five seconds of the two bursts summed, is shown in Fig. 4 (bottom panel). We estimate upper limits on the equivalent width of discrete features of eV.
3.3. Persistent intensity variations
The long, uninterrupted X-ray lightcurve accumulated during the Chandra observation allowed a search for periodic signals with sensitivity greater than for any other dataset, particularly at low energies. Persistent X-ray intensity variations in LMXBs are sometimes observed at the orbital period, which for 4U 172834 remains unknown. We concentrated on the longest (second) segment of data, and created a lightcurve from first-order photons (both HEG and MEG) in the –25 Å(2–0.5 keV) energy range (where orbital variations of neutral absorption would be expected to have the largest effect) at 60 s time resolution. We removed the 1–2 min segments including each burst, and filled the resulting gaps with normally-distributed values consistent with the local mean and standard deviation. The overall mean countrate for the lightcurve was count s-1.

The Fourier power spectrum of the resulting light curve exhibited a peak with Leahy power of 25–29 at 10.77 min, significant (taking into account the number of trials) at between 3 and (i.e. at greater than 99.7% significance; Fig. 5). The peak power and significance vary because of the use of random values to fill the gaps in the lightcurve where the bursts were removed, but the detection was consistently over many trials. The signal was approximately sinusoidal, with an RMS amplitude of 0.5%. We searched for the 10.77 min signal in the full-range lightcurve, as well as other energy bands. The Leahy power at the corresponding frequency in the FFTs from the full-range lightcurve was in the range 17–20, indicating a detection. There was evidence that the signal power decreased with energy above 2 keV; nominal power was detected both in the 2–3 and 3–4 keV bands, with corresponding 3- upper limits on the RMS amplitude of 0.4 and 0.3%, respectively. A stronger signal with Leahy power was detected in the 3–4 keV lightcurve at a period of 16.64 min, very close to the spacecraft yaw dither period of 1000 s, and so likely instrumental. We also searched a lightcurve comprising the zeroth-order photons in the keV band. The count rate in the undispersed low-energy photons was just 2.2 count s-1 in the mean, substantially less than that of the first-order photons, likely due to pileup. We detected no significant power at the 10.77 min period, deriving an upper limit on the rms amplitude of 0.7%, which cannot rule out the detection in the dispersed photon lightcurve.
Several other archival observations of 4U 172834 are available, and we also undertook timing analyses of some of these data in an attempt to confirm the 10.77 min period. The earlier Chandra observation on 2002 March 4 (observation ID #2748, Table 1; see also D’Aí et al., 2006) found the source at a significantly lower intensity, and the first-order count rate below 2 keV was around 5.3 count s-1. We computed a 60-s lightcurve omitting the intervals surrounding the two bursts (see §3.2), and filled the resulting gaps with random values as with the 2006 data. No signal was detected at the candidate period. With the observation only lasting 9.1 hr, the corresponding upper limit on the candidate signal amplitude was 1.7% (). An XMM-Newton observation on 2002 October 29 (observation ID #0149810101, Table 1) was similarly substantially shorter than the 2006 Chandra observation, at only 7.5 hr. We calculated a lightcurve by accumulating photons with energies keV in 60-s bins, with a mean rate of 9.4 count s-1. We found no signal at the candidate period, and derive a upper limit on the rms amplitude of 0.8%. As with the earlier Chandra data, this is above the detected amplitude of the signal in the 2006 observations.
3.4. The X-ray position and optical counterpart
The detection of a short-period signal in the persistent X-ray emission during the 2006 observation led us to reexamine the optical counterpart proposed by Martí et al. (1998). The infrared magnitudes combined with the measured column density lead those authors to suggest a counterpart “less luminous and less massive than a middle B/early A V star or a F-K III star”, taking into account the substantial contribution of the accretion disk. Here we investigate whether the observations are consistent with an ultracompact counterpart similar to that of the similar 10-min binary 4U 182030.
The counterpart to that system was detected in the and F140W UV bands by King et al. (1993). The ratio of the absorption-corrected fluxes in the two bands was approximately , so that the spectral slope was close to the Rayleigh-Jeans value. We extrapolated the observed spectrum to the and bands, and corrected for the different distances of 7.6 kpc for 4U 182030 and 5.7 kpc for 4U 172834 (assuming that radius-expansion bursts reach the Eddington limit for a helium atmosphere; Galloway et al., 2003). The expected magnitudes at the distance of 4U 172834 are and , which are substantially different to the absorption-corrected values of 19.6 and 15.1 measured by Martí et al. (1998). On the other hand, if we extrapolate using a spectral slope of 4, we expect and , which at least matches the -band luminosity for the proposed counterpart. We conclude that a counterpart similar to 4U 182030 may give a consistent -band luminosity to the proposed 4U 172834 counterpart, but the measured -band brightness is too high. This may indicate an additional IR component as has been inferred to exist in other compact binaries (e.g. Greenhill et al., 2006).
Alternatively, we consider the possibility that the proposed counterpart is unrelated and positionally coincident with 4U 172834 by chance. First we determined an accurate X-ray position from the Chandra observation #2748 (Table 1). The zeroth-order image for this bright source was significantly piled up, leaving a ring of emission rather than the point source usual for fainter sources. The standard source detection algorithms cannot provide a precise position for such images, so instead we fit the position of the dispersed HEG and MEG spectra, as well as the readout trace (an artifact arising from the shuffling of charge along the CCD illuminated by a bright point source) and computed their intersection. We first checked for, and corrected, an aspect offset of in R.A. and in Dec444This correction was required since we used data processed prior to 2004; see http://cxc.harvard.edu/cal/ASPECT/fix_offset. We determined a position for 4U 172834 of , decl. = (J2000.0), with an estimated 90% confidence uncertainty of (corresponding to the systematic pointing uncertainty for Chandra). We note that this position is within of the radio source Martí et al. (1998), confirming the positional coincidence of the radio and X-ray sources.
Finally, we estimated the field density of stars with based on the IR star count model of Nakajima et al. (2000). We calculate a total of 280 objects per arcmin2 towards 4U 172834, which suggests a reasonable likelihood of chance positional alignment within an arcsec. Thus, we cannot place any significant constraints on the nature of 4U 172834 based on the properties of the proposed counterpart.
4. Discussion & conclusions
The 2002 and 2006 Chandra observations represent the only high-spectral resolution observations of radius-expansion bursts from any source to date. Only six such bursts have been observed in total, and the data from two of those bursts (from observation #2748) likely suffer from pileup as well as having too poor time resolution to resolve the radius-expansion episode. Nevertheless, this work represents the first such probe into a poorly-studied burst spectral regime. We detected no evidence for discrete features in the spectra extracted from during the radius-expansion episodes, and derive upper limits for narrow features of approximately eV.
The super-Eddington flux that drives the radius expansion during these bursts transforms nearly all the excess luminosity into kinetic and potential energy of the extended atmosphere. The radiation-driven winds which result are capable of expelling of the accreted mass (e.g. Hanawa & Sugimoto, 1982; Nobili et al., 1994). If a fraction of the heavy elements produced during burning are expelled in a wind and exposed at the surface, we may expect to observe photoionisation edges from these elements.
However, we found no evidence for photoionization edges, and derive typical upper limits of 250–300 eV. The strength of edge features depends upon the elemental abundances in the burning products, the temperature and degree of expansion of the photosphere (that sets the degree of ionisation) and the amount of material ejected (that determines the column depth; e.g. in ’t Zand & Weinberg, 2010). In order to estimate the likely equivalent widths, we adopted model predictions from Weinberg et al. (2006). We assumed abundances in the burning products for the pure-He model (see e.g. Fig. 13 of (Weinberg et al., 2006)), since the burst profiles and other evidence presented here suggest pure He accretion. The abundance distributions may vary if there is hydrogen present in the ignition layer. We note that the rp-process burning that would occur if H is present (e.g. Schatz et al., 2001) occurs after the radius expansion, so heavy burning products will not be ejected in the wind, unless they get dredged up from the ashes of previous bursts. in ’t Zand & Weinberg (2010) found evidence for absorption edges with optical depths of –3 in superexpansion bursts, in which the photospheric radius increases to km. The expansion in the bursts from 4U 172834 was much more modest, at around 20 km (a factor of above the NS surface; Fig. 3), and it is possible that this distinction is the reason for the nondetection in our data. However, we note that the upper limits on optical depth that we derive, of –0.3, are consistent with the measured values for the weaker edges in the superexpansion bursts. Thus, for moderate expansion bursts such as those seen from 4U 172834, we can rule out the strongest edges detected in the superexpansion bursts, but not the weakest.
The predicted column density and equivalent widths for selected elements are shown in Fig. 6. For comparison, we calculated the effective temperature in the neutron-star photosphere, adopting a correction to the observed (color) temperature of 2 (see e.g. Madej et al., 2004) and a surface gravitational redshift of 1.31 (equivalent to a neutron star with km), that have the net result of reducing the observed (color) temperature by a factor of 1.5 to give the effective temperature in the neutron star frame. We calculated the effective temperatures both at the time of maximum expansion of the photosphere, and also at the point where the photosphere is assumed to have rejoined the neutron star surface (“touchdown”). The detectability of edge features is strongly dependent upon the effective temperature in the derived range, between 1 and 1.8 keV. Interestingly, the predicted equivalent width for S and Si at an effective temperature of keV are a few hundred to a thousand eV, comparable to the upper limits on detection derived in the present spectra. Doppler broadening due to rotation may reduce the detectability of the edges in moderate radius expansion bursts. If angular momentum in the expanding photosphere is conserved, the transverse velocity of the expanded shell in the bursts from 4U 172834 would be reduced by a factor of two, such that the degree of Doppler broadening would be equivalent to a source rotating at Hz. The reduction in detectability for an intrinsically broad feature such as an edge will not be so severe as for spectral lines (e.g. Chang et al., 2006), although it may be significant. We hope that future observations, that will contribute additional photons to the already-accumulated spectrum emitted at the peak of radius-expansion bursts, will allow us to make more sensitive searches for spectral features.

The properties of the bursts observed from 4U 172834 by Chandra suggest that the fuel contains little or no hydrogen. During the 2006 July observation the source entered a state of unusually high accretion rate, so that (from the second observation, #6567 onwards) the burst ignition conditions were reached before sufficient fuel to power a radius-expansion burst had accumulated. The occurrence of bursts with characteristic He-rich profiles and high -values at such short recurrence times are difficult to understand based on standard burst theory. For a neutron star accreting mixed H/He at around 10% the Eddington rate (within the range in which we observed 4U 172834), H will burn stably between the bursts, reducing the fraction in the fuel at ignition. However, the burst recurrence time observed in 2006 July is insufficient to exhaust the H for solar abundances. Steady (hot CNO) H-burning is mediated by -decays which limit the rate, so that the accreted hydrogen will only be exhausted at the ignition depth in a time hr, where is the hydrogen fraction in the accreted material and is the mass fraction of CNO nuclei (0.7 and 0.02 respectively, for solar composition). For burst recurrence times of hr there is insufficient time between bursts to reduce the H-fraction in the fuel significantly below the accreted level prior to burst ignition. If the source were accreting hydrogen at approximately solar composition, the expected burst profiles would be much longer, with s rises and tails out to 100 s, similar to what has been observed for GS 182624 Galloway et al. (2004). In those bursts the longer timescale comes from the much slower progression of -decay mediated rp-process H-burning. We suggest three possible explanations for the burst properties. First, that the source accretes material which is unusually rich in CNO nuclei. With approximately 5 times in excess of the solar value, the time to exhaust all the H would be of order the burst recurrence time observed during the 2006 Chandra observation. There is no observational support for this suggestion, as the optical counterpart for the source has not been confirmed, so the type of the mass donor is not known. Second, it is possible that shear-mediated mixing allows CNO nuclei from the ashes of previous bursts to be dredged up into the freshly accreted material, as has been predicted for slowly rotating neutron stars by Piro & Bildsten (2007). 4U 172834 is known to be rotating at 363 Hz Strohmayer et al. (1996), which is fairly slow for accreting neutron-stars in LMXBs, but the full effects of such mixing in sources accreting hydrogen as well as helium have not yet been fully investigated. Either of these possibilities leave open the chance of long H-rich bursts occurring occasionally from the source, although these have not yet been observed. Continued observations, as well as an archival search underway with data from multiple instruments, will test these hypotheses.
Third, it remains possible that the source accretes H-poor material, from an evolved (e.g. white dwarf) donor. Such systems are referred to as ultracompact binaries, due to their typically very short ( min) orbital periods (e.g. in ’t Zand et al., 2007). The 10.77 min modulation in the intensity of low-energy X-rays detected for the first time by Chandra from 4U 172834 supports this possibility. If this modulation was orbital, the system would be essentially a twin of 4U 182030. Like that source, 4U 172834 will be detectable with the ESA/NASA Laser Interferometer Space Antenna (LISA; Nelemans, 2008). Existing measurements of the candidate IR counterpart cannot significantly constrain this possibility, and deeper infrared observations are required to unambiguously confirm the ultracompact nature of this source, via detection of a corresponding modulation in the counterpart intensity.
References
- Canizares et al. (2005) Canizares, C. R., Davis, J. E., Dewey, D., Flanagan, K. A., Galton, E. B., Huenemoerder, D. P., Ishibashi, K., Markert, T. H., Marshall, H. L., McGuirk, M., Schattenburg, M. L., Schulz, N. S., Smith, H. I., & Wise, M. 2005, PASP, 117, 1144
- Chang et al. (2006) Chang, P., Morsink, S., Bildsten, L., & Wasserman, I. 2006, ApJ, 636, L117
- Cottam et al. (2002) Cottam, J., Paerels, F., & Mendez, M. 2002, Nature, 420, 51
- Cottam et al. (2008) Cottam, J., Paerels, F., Méndez, M., Boirin, L., Lewin, W. H. G., Kuulkers, E., & Miller, J. M. 2008, ApJ, 672, 504
- Cumming (2003) Cumming, A. 2003, ApJ, 595, 1077
- Cumming et al. (2006) Cumming, A., Macbeth, J., Zand, J. J. M. i., & Page, D. 2006, ApJ, 646, 429
- D’Aí et al. (2006) D’Aí, A., di Salvo, T., Iaria, R., Méndez, M., Burderi, L., Lavagetto, G., Lewin, W. H. G., Robba, N. R., Stella, L., & van der Klis, M. 2006, A&A, 448, 817
- Falanga et al. (2006) Falanga, M., Götz, D., Goldoni, P., Farinelli, R., Goldwurm, A., Mereghetti, S., Bazzano, A., & Stella, L. 2006, A&A, 458, 21
- Fruscione et al. (2006) Fruscione, A., McDowell, J. C., Allen, G. E., Brickhouse, N. S., Burke, D. J., Davis, J. E., Durham, N., Elvis, M., Galle, E. C., Harris, D. E., Huenemoerder, D. P., Houck, J. C., Ishibashi, B., Karovska, M., Nicastro, F., Noble, M. S., Nowak, M. A., Primini, F. A., Siemiginowska, A., Smith, R. K., & Wise, M. 2006, in Society of Photo-Optical Instrumentation Engineers (SPIE) Conference Series, Vol. 6270, Society of Photo-Optical Instrumentation Engineers (SPIE) Conference Series
- Galloway et al. (2004) Galloway, D. K., Cumming, A., Kuulkers, E., Bildsten, L., Chakrabarty, D., & Rothschild, R. E. 2004, ApJ, 601, 466
- Galloway et al. (2010) Galloway, D. K., Lin, J., Chakrabarty, D., & Hartman, J. M. 2010, ApJ, 711, L148
- Galloway et al. (2008) Galloway, D. K., Muno, M. P., Hartman, J. M., Psaltis, D., & Chakrabarty, D. 2008, ApJS, 179, 360
- Galloway et al. (2003) Galloway, D. K., Psaltis, D., Chakrabarty, D., & Muno, M. P. 2003, ApJ, 590, 999
- Gottwald et al. (1986) Gottwald, M., Haberl, F., Parmar, A. N., & White, N. E. 1986, ApJ, 308, 213
- Greenhill et al. (2006) Greenhill, J. G., Giles, A. B., & Coutures, C. 2006, MNRAS, 370, 1303
- Haberl et al. (1987) Haberl, F., Stella, L., White, N. E., Gottwald, M., & Priedhorsky, W. C. 1987, ApJ, 314, 266
- Hanawa & Sugimoto (1982) Hanawa, T. & Sugimoto, D. 1982, PASJ, 34, 1
- Houck & Denicola (2000) Houck, J. C. & Denicola, L. A. 2000, in Astronomical Society of the Pacific Conference Series, Vol. 216, Astronomical Data Analysis Software and Systems IX, ed. N. Manset, C. Veillet, & D. Crabtree, 591
- in ’t Zand et al. (2007) in ’t Zand, J. J. M., Jonker, P. G., & Markwardt, C. B. 2007, A&A, 465, 953
- in ’t Zand & Weinberg (2010) in ’t Zand, J. J. M. & Weinberg, N. N. 2010, A&A, submitted (arXiv.org:1001.0900)
- King et al. (1993) King, I. R., Stanford, S. A., Albrecht, R., Barbieri, C., Blades, J. C., Boksenberg, A., Crane, P., Disney, M. J., Deharveng, J. M., Jakobsen, P., Kamperman, T. M., Macchetto, F., Mackay, C. D., Paresce, F., Weigelt, G., Baxter, D., Greenfield, P., Jedrzejewski, R., Nota, A., Sparks, W. B., & Sosin, C. 1993, ApJ, 413, L117
- Kuster et al. (2002) Kuster, M., Kendziorra, E., Benlloch, S., Becker, W., Lammers, U., Vacanti, G., & Serpell, E. 2002, ArXiv Astrophysics e-prints
- Lattimer & Prakash (2007) Lattimer, J. M. & Prakash, M. 2007, Phys. Rep., 442, 109
- Lewin et al. (1993) Lewin, W. H. G., van Paradijs, J., & Taam, R. E. 1993, Space Sci. Rev., 62, 223
- Madej et al. (2004) Madej, J., Joss, P. C., & Różańska, A. 2004, ApJ, 602, 904
- Martí et al. (1998) Martí, J., Mirabel, I. F., Rodriguez, L. F., & Chaty, S. 1998, A&A, 332, L45
- Misanovic et al. (2010) Misanovic, Z., Galloway, D. K., & Cooper, R. L. 2010, ApJ, 718, 947
- Nakajima et al. (2000) Nakajima, T., Iwamuro, F., Maihara, T., Motohara, K., Terada, H., Goto, M., Iwai, J., Tanabe, H., Taguchi, T., Hata, R., Yanagisawa, K., Iye, M., Kashikawa, N., & Tamura, M. 2000, AJ, 120, 2488
- Nelemans (2008) Nelemans, G. 2008
- Nobili et al. (1994) Nobili, L., Turolla, R., & Lapidus, I. 1994, ApJ, 433, 276
- Piro & Bildsten (2007) Piro, A. L. & Bildsten, L. 2007, ApJ, accepted (astro-ph/0704.1278)
- Priedhorsky & Terrell (1984) Priedhorsky, W. & Terrell, J. 1984, ApJ, 284, L17
- Schatz et al. (2001) Schatz, H., Aprahamian, A., Barnard, V., Bildsten, L., Cumming, A., Ouellette, M., Rauscher, T., Thielemann, F.-K., & Wiescher, M. 2001, Physical Review Letters, 86, 3471
- Stella et al. (1987) Stella, L., White, N. E., & Priedhorsky, W. 1987, ApJ, 312, L17
- Strohmayer et al. (1996) Strohmayer, T. E., Zhang, W., Swank, J. H., Smale, A., Titarchuk, L., Day, C., & Lee, U. 1996, ApJ, 469, L9
- Weinberg et al. (2006) Weinberg, N. N., Bildsten, L., & Schatz, H. 2006, ApJ, 639, 1018