The Prevalence of Narrow Optical Fe II Emission Lines in Type 1 Active Galactic Nuclei
Abstract
From detailed spectral analysis of a large sample of low-redshift active galactic nuclei (AGNs) selected from the Sloan Digital Sky Survey, we demonstrate—statistically for the first time—that narrow optical Fe II emission lines, both permitted and forbidden, are prevalent in type 1 AGNs. Remarkably, these optical lines are completely absent in type 2 AGNs, across a wide luminosity range, from Seyfert 2 galaxies to type 2 quasars. We suggest that the narrow Fe II-emitting gas is confined to a disk-like geometry in the innermost regions of the narrow-line region on physical scales smaller than the obscuring torus.
1 Introduction
Broad Fe II multiplet emission are prominent features in the optical spectra of most type 1 active galactic nuclei (AGNs), but narrow optical Fe II lines, either permitted or forbidden, are rarely seen. To our knowledge, narrow optical Fe II emission has been reported in only three sources to date: I Zw 1 (Véron-Cetty et al. 2004), Mrk 110 (Véron-Cetty et al. 2007), and SDSS J1028+4500 (Wang et al. 2008). The apparent weakness of Fe II emission in the narrow-line region (NLR) might be attributed to iron, a refractory element, condensing onto dust grains, which sublimate in the broad-line region (Laor & Draine 1993). This is especially true for low-ionization lines such as Fe II that arise from partially neutral portions of the NLR clouds (Ferguson et al. 1997). On the other hand, narrow forbidden Fe II emission lines in the near-infrared (NIR) are observed commonly in both type 1 and type 2 AGNs (e.g., Simpson et al. 1996; Mouri et al. 2000; Rodríguez-Ardila et al. 2004, 2005). According to these studies, NIR [Fe II] emission most likely originates from AGN photoionization, although additional contributions from shock heating cannot be excluded. This raises the following questions: are narrow optical Fe II emission lines really absent in AGNs? If so, why?
It is possible that narrow Fe II lines are actually prevalent in the optical spectra of AGNs, yet have just been neglected or mistaken as a part of the co-existing broad-line emission or stellar features. Because of the complex atomic structure of the Fe+ ion, there are so many transitions that individual Fe II lines, even if narrow, are highly blended with each other, effectively mimicking much broader features. The situation is further exacerbated in type 1 AGNs by the ubiquitous presence of broad Fe II multiplets as well as other emission lines. Without knowing a complete identification list of the optical transitions and their relative strengths, it is hard to discern them. Fortunately, Véron-Cetty et al. (2004) have recently identified and measured all the narrow Fe II lines present in the optical spectrum of I Zw 1, a well-known narrow-line Seyfert 1 galaxy. Their analysis made it possible for us to explore systematically narrow optical Fe II emission lines in AGNs.
In this Letter, we report the discovery of the prevalence of narrow Fe II emission lines, both permitted and forbidden, in the optical spectra of type 1 AGNs and their nondetection in type 2 AGNs. We adopt a cosmology with = 70 km s-1 Mpc-1, = 0.3, and = 0.7.
2 Sample and Data Analysis
2.1 The Type 1 AGN Sample
The type 1 AGN sample consists of the 4178 Seyfert 1 galaxies and quasars from Dong et al. (2010), selected from the spectral data set of the Sloan Digital Sky Survey Fourth Data Release (SDSS DR4; Adelman-McCarthy et al. 2006). Sample definition and data analysis methods are described in detail in that work. Here we provide a brief description and some additional treatments for verifying the existence of narrow-line Fe II emission. Briefly, we select broad-line AGNs with prominent Fe II emission in the SDSS bandpass and with continuum and emission lines suffering minimally from contamination by host galaxy starlight. The criteria are as follows: (a) , to ensure that Fe II emission in the restframe wavelength region 4434–4684 Å (hereinafter Fe II ), as well as H and [O III] 4959, 5007, are in the bandpass; (b) a median signal-to-noise ratio (S/N) per pixel in the optical Fe II region (4400–5400 Å); and (c) absence of detectable Ca K (3934 Å), Ca H + H (3970 Å), and H (4102 Å) stellar absorption features at significance.
At optical wavelengths numerous Fe II multiplets and other broad emission lines are heavily blended to form a pseudocontinuum. Following Dong et al. (2008), we fit simultaneously the AGN featureless continuum, represented by a power law, the Fe II multiplets, and other emission lines in the range of 4200–5600 Å using a code based on the MPFIT package (Markwardt 2009). The Fe II emission is modeled with two separate sets of templates in analytical forms,111The implementation of the template functions in Interactive Data Language (IDL) is available at http://staff.ustc.edu.cn/~xbdong/Data_Release/FeII/Template/ . one for the broad-line system and the other for the narrow-line system, constructed from measurements of I Zw 1 by Véron-Cetty et al. (2004), as listed in their Tables A1 and A2. Within each system, the respective set of Fe II lines are assumed to have no relative velocity shifts and the same relative strengths as those in I Zw 1. In the optical spectrum of I Zw 1, the broad Fe II lines are blueshifted by 150 , whereas the narrow Fe II lines are located at the systematic redshift of the host galaxy; this velocity separation made possible the identification of the narrow component from the broad one (P. Véron 2009, private communication). The broad H line is fitted with as many Gaussians as statistically justified. All narrow emission lines are fitted with a single Gaussian, except for the [O III] 4959, 5007 doublet, each of which is modeled with two Gaussians, one accounting for the line core and the other for a possible blue wing, as seen in many objects. The redshift and width of narrow-line Fe II are set as free parameters.
In order to verify that the narrow-line Fe II are not residuals from poor broad Fe II subtraction due to mismatch of the broad-line Fe II model, we use three schemes to model the profile of individual broad Fe II lines: (A) the best-fit broad H profile, (B) the best-fit total (narrow + broad) H profile, and (C) a single Lorentzian with width set as a free parameter. Scheme A is a natural choice that has been used in our previous studies (e.g., Dong et al. 2008, 2010). Scheme B is rather extreme and formally unreasonable because H definitely has a component from the canonical NLR; we use it as a stringent test of the reality of the narrow Fe II lines. Scheme C is inspired by the fact that the broad Fe II lines in I Zw 1 are best described by a Lorentzian profile (Véron-Cetty et al. 2004). The redshift of broad Fe II is set to be a free parameter. We note that the width of broad Fe II lines may be different from that of broad H (see, e.g., Hu et al. 2008), yet we find that the flux of both broad and narrow Fe II are quite insensitive to the exact profile assumed for the broad component (Dong et al. 2010). As noted by Vestergaard & Peterson (2005) and Landt et al. (2008), the broad Fe II multiplets are so highly blended that the overall profile mainly depends on their relative strengths. As a strict demonstration that the detection of narrow Fe II is robust, we show (§3.1) that we can recover these features in the residual spectrum even after excluding the narrow-line Fe II template from our model altogether.
2.2 The Type 2 AGN Sample
The type 2 AGN sample comprises the Seyfert 2 galaxies in SDSS DR4 selected according to the criteria of Kauffmann et al. (2003), having H, [O III] , H, and [N II] detected at significance. The mean and standard deviation of their redshifts are 0.10 and 0.05, respectively. We subtracted the starlight continuum to obtain a clean emission-line spectrum using the method of Lu et al. (2006), using stellar templates broadened and shifted to match the stellar velocity dispersion of the galaxy. The stellar absorption lines must be subtracted well to ensure reliable measurement of weak emission lines. In the present study, we add the narrow Fe II template described above into the model, in order to detect any possible narrow Fe II emission. Next, we fitted emission lines with Gaussians using the code described in detail in Dong et al. (2005); errors are given by MPFIT. There are 2671 objects in the galaxy catalog having a broad H component with S/N ; we excluded these from the type 2 AGN sample (cf. Zhang et al. 2008).
3 Results
3.1 Narrow Fe II Emission in Type 1 AGNs
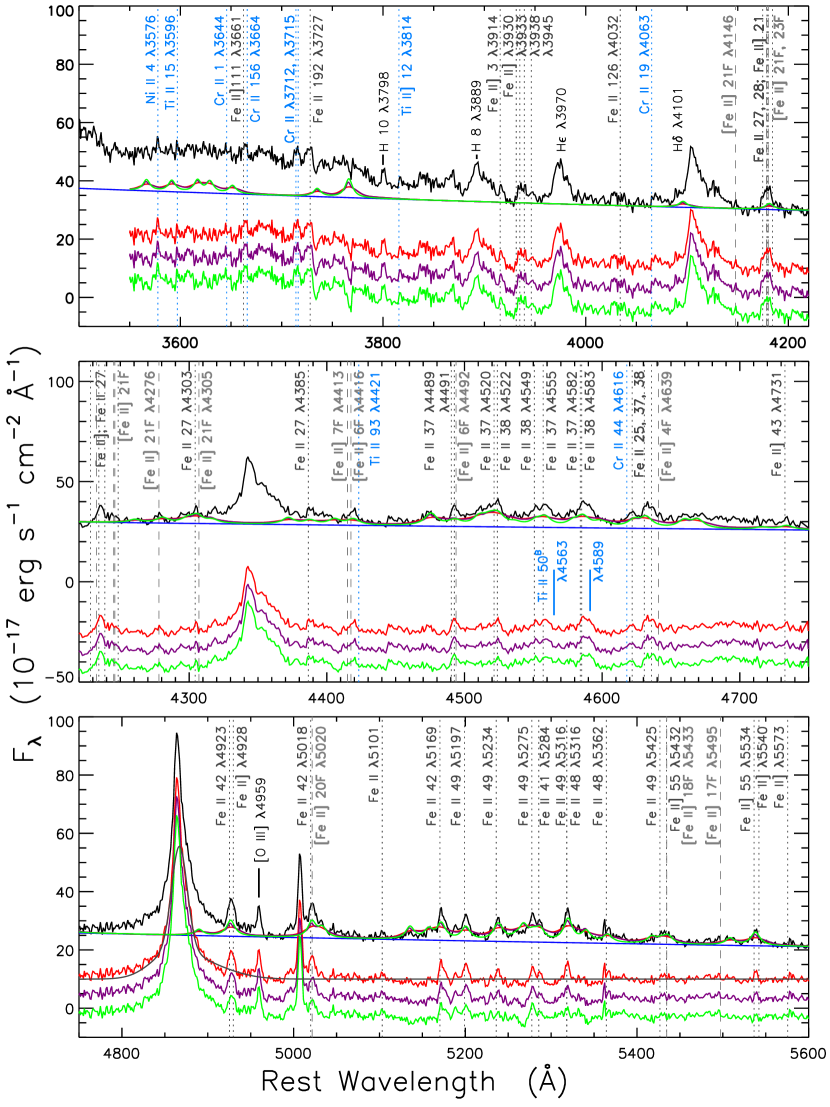
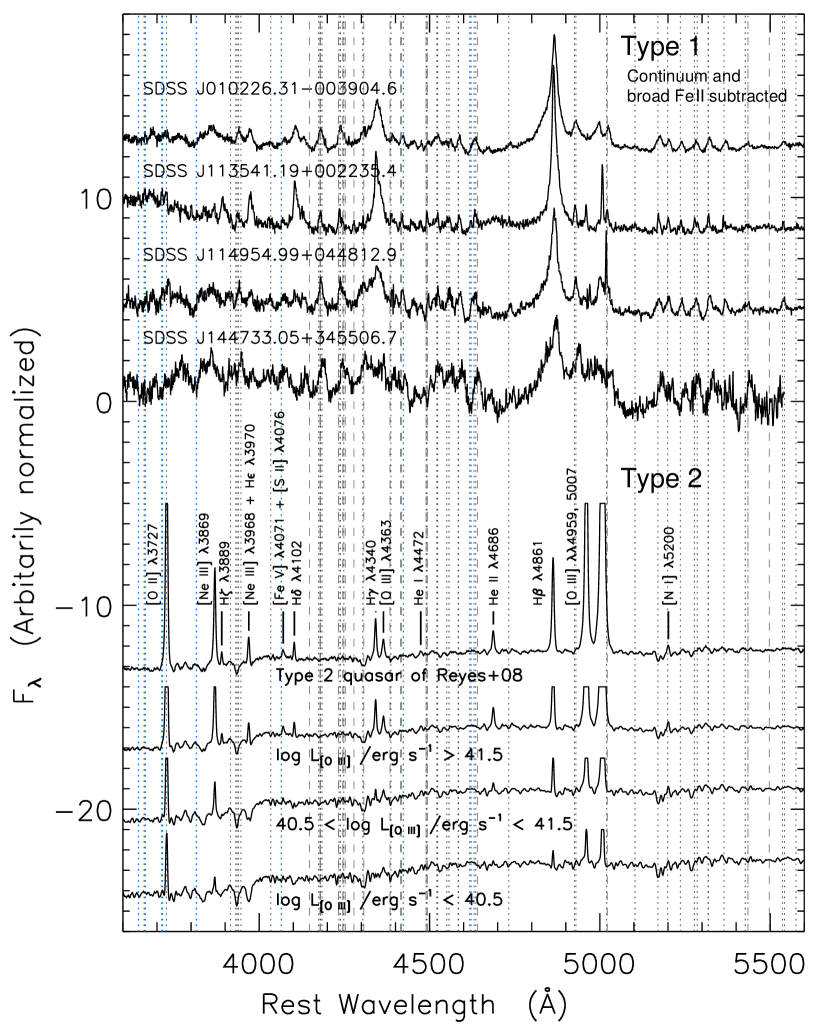
As a first step toward ascertaining whether narrow Fe II lines can be discerned without the aid of a narrow Fe II template, we model the pseudocontinuum with a power-law AGN continuum plus the broad Fe II template only. For this purpose, we try all three schemes of modeling the profile of broad Fe II lines described in §2.1. The fitting results are very encouraging: narrow Fe II lines are present in many residual spectra regardless of the broad Fe II model adopted. Figure 1 illustrates the three schemes applied to SDSS J113541.19+002235.4. Plotted as vertical lines are the locations of the narrow Fe II lines, both permitted (dotted) and forbidden (dashed), as well as some narrow transitions of Cr II, Ni II, and Ti II (cyan), that were identified by Véron-Cetty et al. (2004) and appear unambiguous in all the residual spectra. Those lines are also labeled in Figure 1. While there are small differences among the three fitting schemes, overall the pattern of narrow features appears robust. Moreover, the relative strengths of the narrow features seem, to first order, reproducible from object to object. This is shown in Figure 2 (top), where we plot the residual spectra for four sources fitted using Scheme A (broad Fe II modeled using the broad H profile).
Next, we fit the entire type 1 sample with the narrow Fe II template included into the pseudocontinuum model, as described in §2.1. The broad Fe II line profile is again modeled with the above three schemes. The addition of the narrow-line component is justified statistically by the test,222We have found through experimentation that the test works well in such spectral fitting, although, theoretically, it holds only for linear models (see below and Dong et al. 2008). with over half of the spectra having a chance probability , regardless of the model adopted for the broad Fe II profile (even the extreme case of Scheme B). Because the fluxes of both narrow and broad Fe II are relatively insensitive to the choice of broad Fe II template, we adopt Scheme A (broad Fe II profile = broad H profile) for the rest of the study.
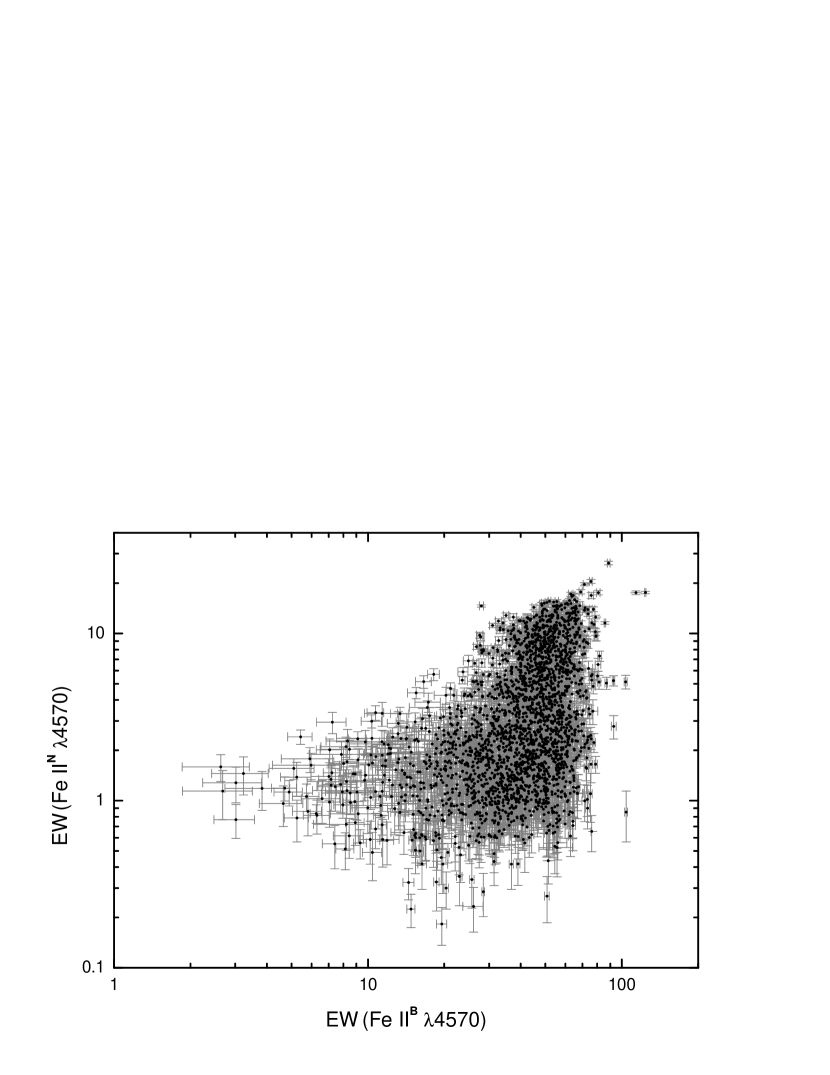
We detect narrow Fe II emission at significance in 2515 (60%) of the 4178 objects, and at significance in 1872 (45%), using errors on the narrow-line Fe II flux as given by MPFIT. This is consistent with the above test results. The restframe equivalent widths of the narrow Fe II features integrated over the region 4434–4684 Å (Fe IIN ) range from undetectable (0.1 Å) to 25 Å. The intensity ratios of the narrow to broad Fe II feature, among the 2502 objects in which both components are detected at significance, vary by 2 orders of magnitude, ranging from 0.005 to 0.5, with a mean of 0.07 and a standard deviation of 0.3 dex (computed in log-space). The equivalent widths of the two components do not correlate very tightly (Spearman correlation coefficient ; see Figure 3), suggesting that the narrow component is not an artifact of measurement uncertainty associated with deblending of the broad component. Remarkably, however, as described in the companion paper by Dong et al. (2010), the relative strengths of narrow Fe II with respect to the continuum and all other prominent emission lines in the near-ultraviolet and optical region (e.g., Mg II , broad Fe II, broad H, and [O III] ) correlate most strongly with the Eddington ratio333Eddington ratio, , is the ratio between the bolometric and Eddington luminosities. The Eddington luminosity (), by definition, is the luminosity at which the gravity of the central source acting on an electron–proton pair (i.e., fully ionized gas) is balanced by the radiation pressure due to electron Thomson scattering. rather than with other physical parameters of the AGNs. A physical model unifying these and other correlations concerning Eddington ratio were proposed by Dong et al. (2009a, 2009b, 2010).
It is difficult to obtain accurate measurements of the kinematics of the narrow Fe II features. The lines are weak, most are severely blended, and both the spectral resolution and S/N of the SDSS data are limited. Notwithstanding these limitations, we make a preliminary statistical investigation for the 1032 objects with narrow Fe II emission detected at significance. The best-fitting narrow Fe II model gives line widths (full width at half-maximum, corrected for instrumental broadening) mostly in the range of 200–800 , with a mean of 560 and a standard deviation of 150 ; these values are comparable to those of [O III] 5007 within . The velocity shifts of the narrow Fe II system with respect to narrow H range mostly from (blueshifted) to 300 (redshifted), with a mean of 50 and a standard deviation of 100 . With respect to the broad Fe II system, the mean velocity shift of narrow Fe II is 210 , with a standard deviation of 280 . We cannot discern any obvious velocity differences between the permitted and forbidden narrow transitions. Without a robust estimation of the measurement uncertainties on these kinematic parameters at present, we refrain from a full discussion of the kinematics in this Letter.
3.2 No Narrow Fe II Emission in Type 2 AGNs
In strong contrast to the case of type 1 AGNs, no Fe II emission is detected at significance in any object in the type 2 sample! Considering that the detection of weak emission lines may be heavily influenced by uncertainties in starlight subtraction, we divide the type 2 sample into three subsamples according to [O III] luminosity, and build a composite spectrum for each. The composites are arithmetic mean spectra, constructed following Chen et al. (2010; see their §3.1). The luminosity ranges of the three subsamples are , , and erg s-1. To avoid possible confusion from the inclusion of star-forming galaxies, we further require the objects to be located above the maximum starburst line in the Baldwin-Phillips-Terlevich diagram (Baldwin et al. 1981) of Kewley et al. (2001), and to have [O III] to avoid low-ionization sources. To obtain a comparison sample of type 2 sources with AGN luminosities more compatible with that of the type 1 sample (median erg s-1), we also build a composite spectrum for the SDSS type 2 quasars presented in Reyes et al. (2008), which have erg s-1. As shown in Figure 2 (bottom), it is clear that no narrow Fe II features whatsoever are seen in any of the composite type 2 spectra. To quantify this striking result, we use the type 2 quasar composite, after starlight subtraction, to place upper limits on two relatively isolated features, Fe II (integrated in the vacuum wavelength range 4918–4938 Å, which is dominated by Fe II 42 and Fe II] ) and Fe II 49 . Relative to [O III] 5007, the limits are and , respectively. By comparison, the mean values of these features in the type 1 sample are and .
4 Discussion and Summary
The most surprising finding of this Letter is that narrow Fe II emission is prevalent in type 1 AGNs, yet not present at all in type 2 AGNs. This is a statistically robust result, based on analysis of a large sample of individual spectra as well as very high-S/N stacked spectra. A possible explanation for this striking contrast, appealing to the canonical geometric unification scheme for type 1 and type 2 AGNs (e.g., Antonucci 1993), is that narrow Fe II emission arises from gas in the innermost regions of the NLR located interior to the obscuring torus. The inner edge of the torus has been estimated to be on scale of parsecs, roughly the dust sublimation radius (Suganuma et al. 2006); its radial extent is likely to be several tens of parsecs (e.g., Jaffe et al. 2004; see Granato & Danese 1994 for a model). In this picture the narrow Fe II-emitting region is visible along our line-of-sight in type 1 objects but obscured by the (extent of) the dusty torus in type 2 counterparts. As a low-ionization specie, Fe II may preferentially avoid the ionization cone and be largely confined to a disk-like geometry along the plane of the torus, as depicted in Figure 6 of Gaskell (2009).
Yet, the complete absence of optical narrow Fe II emission in type 2 sources appears perplexing in view of the fact that narrow [Fe II] emission in the NIR has been seen in AGNs of both types (see §1). Can line-of-sight dust obscuration be so effective in suppressing or hiding the optical lines, in all cases? Given the inherent patchiness of the interstellar medium, this seems incredible. However, in the absence of a quantitative prediction for the intrinsic relative strengths of the optical and NIR Fe II transitions, which, to our knowledge, has not been published, it is difficult to evaluate this hypothesis. Comparison between the NIR and optical lines may be further complicated by the fact that the transitions in these two wavelength ranges arise from different energy levels ( eV for the NIR; eV for optical forbidden; eV for optical permitted), and hence likely trace physically different regions. The NIR lines probably tracer cooler, dustier material compared to the regions emitting the optical lines.
There are several lines of fruitful work for the future. From an observational standpoint, it would be useful to obtain optical spectra of higher S/N and higher spectral resolution to better constrain the kinematics of the Fe II-emitting gas and its relation to regions emitting higher-ionization species. To better understand the puzzling mismatch between the optical and NIR lines, it would be instructive to obtain NIR spectra of the sources for which narrow Fe II has been detected in the optical, and vice versa. And finally, theoretical calculations are needed to predict the intrinsic spectrum of narrow Fe II across a wide wavelength range.
References
- Adelman-McCarthy et al. (2006) Adelman-McCarthy, J. K., et al. 2006, ApJS, 162, 38
- Antonucci (1993) Antonucci, R. 1993, ARA&A, 31, 473
- Baldwin et al. (1981) Baldwin, J. A., Phillips, M. M., & Terlevich, R. 1981, PASP, 93, 5
- Chen et al. (2010) Chen, Y.-M., Tremonti, C. A., Heckman, T. M., Kauffmann, G., Weiner, B. J., Brinchmann, J., & Wang, J. 2010, AJ, 140, 445
- Dong et al. (2010) Dong, X.-B., Wang, J.-G., Wang, T.-G., Fan, X., Ho, L. C., Wang, H., Zhou, H., & Yuan, W. 2010, ApJ, submitted (arXiv:0903.5020)
- Dong et al. (2009a) Dong, X.-B., Wang, T.-G., Wang, J.-G., Fan, X., Wang, H., Zhou, H., & Yuan, W. 2009a, ApJ, 703, L1
- Dong et al. (2009b) Dong, X.-B., Wang, J.-G., Wang, T.-G., Wang, H., Fan, X., Zhou, H., Yuan, W., & Long, Q. 2009b, in ASP Conf. Ser. 408, The Starburst-AGN Connection, ed. W. Wang et al. (San Francisco, CA: ASP), 83 (arXiv:0903.0698)
- Dong et al. (2008) Dong, X., Wang, T., Wang, J., Yuan, W., Zhou, H., Dai, H., & Zhang, K. 2008, MNRAS, 383, 581
- Dong et al. (2005) Dong, X.-B., Zhou, H.-Y., Wang, T.-G., Wang, J.-X., Li, C., & Zhou, Y.-Y. 2005, ApJ, 620, 629
- Ferguson et al. (1997) Ferguson, J. W., Korista, K. T., Baldwin, J. A., & Ferland, G. J. 1997, ApJ, 487, 122
- Gaskell (2009) Gaskell, C. M. 2009, NewAR, 53, 140
- Granato & Danese (1994) Granato, G. L., & Danese, L. 1994, MNRAS, 268, 235
- Hu et al. (2008) Hu, C., Wang, J.-M., Ho, L. C., Chen, Y.-M., Zhang, H.-T., Bian, W.-H., & Xue, S.-J. 2008, ApJ, 687, 78
- Jaffe et al. (2004) Jaffe, W., et al. 2004, Nature, 429, 47
- Kauffmann et al. (2003) Kauffmann, G., et al. 2003, MNRAS, 346, 1055
- Kewley et al. (2001) Kewley, L. J., Dopita, M. A., Sutherland, R. S., Heisler, C. A., & Trevena, J. 2001, ApJ, 556, 121
- Landt et al. (2008) Landt, H., Bentz, M. C., Ward, M. J., Elvis, M., Peterson, B. M., Korista, K. T., & Karovska, M. 2008, ApJS, 174, 282
- Laor & Draine (1993) Laor, A., & Draine, B. T. 1993, ApJ, 402, 441
- Lu et al. (2006) Lu, H., Zhou, H., Wang, J., Wang, T., Dong, X., Zhuang, Z., & Li, C. 2006, AJ, 131, 790
- Markwardt (2009) Markwardt, C. B. 2009, in in ASP Conf. Ser. 411, Astronomical Data Analysis Software and Systems XVIII, ed. D. A. Bohlender, D. Durand, & P. Dowler (San Francisco: ASP), 251 (arXiv:0902.2850)
- Mouri et al. (2000) Mouri, H., Kawara, K., & Taniguchi, Y. 2000, ApJ, 528, 186
- Reyes et al. (2008) Reyes, R., et al. 2008, AJ, 136, 2373
- Rodríguez-Ardila et al. (2004) Rodríguez-Ardila, A., Pastoriza, M. G., Viegas, S., Sigut, T. A. A., & Pradhan, A. K. 2004, A&A, 425, 457
- Rodríguez-Ardila et al. (2005) Rodríguez-Ardila, A., Riffel, R., & Pastoriza, M. G. 2005, MNRAS, 364, 1041
- Simpson et al. (1996) Simpson, C., Forbes, D. A., Baker, A. C., & Ward, M. J. 1996, MNRAS, 283, 777
- Suganuma et al. (2006) Suganuma, M., et al. 2006, ApJ, 639, 46
- Vanden Berk et al. (2001) Vanden Berk, D. E., et al. 2001, AJ, 122, 549
- Véron-Cetty et al. (2004) Véron-Cetty, M.-P., Joly, M., & Véron, P. 2004, A&A, 417, 515
- Véron-Cetty et al. (2007) Véron-Cetty, M.-P., Véron, P., Joly, M., & Kollatschny, W. 2007, A&A, 475, 487
- Vestergaard & Peterson (2005) Vestergaard, M., & Peterson, B. M. 2005, ApJ, 625, 688
- Wang et al. (2008) Wang, T., Dai, H., & Zhou, H. 2008, ApJ, 674, 668
- Zhang et al. (2008) Zhang, K., Wang, T.-G., Dong, X.-B., & Lu, H. 2008, ApJ, 685, L109