1 Charles University, Faculty of Mathematics and Physics,
Astronomical Institute, Prague, Czech Republic
A comparison of the fluences and photon
peak fluxes for the Swift and RHESSI
gamma-ray bursts
Abstract
Fluences and photon peak fluxes of the gamma-ray bursts (GRBs) detected by the Swift and RHESSI satellites are graphically compared.
The Swift-BAT data set consists of the GRB durations, fluences at range 15-150 keV,
peak fluxes (fluxes) at the same energy range and covers the period Nov. 2004 Feb. 2009 with 429 events.
The RHESSI data set consists of the durations, count fluences at range 25-1500 keV,
fluxes at the same range and covers the period Feb. 2002 Nov. 2007 with 425 events.
In these two databases 25 GRBs were detected by both satellites with known fluxes and fluences.
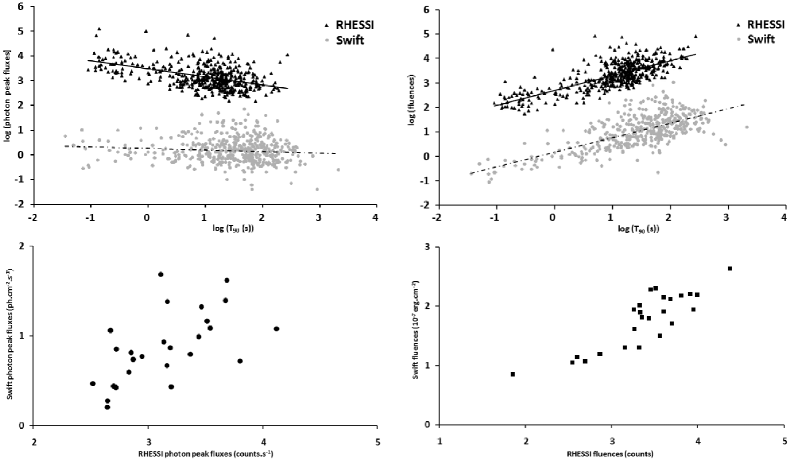
The relationship between the RHESSI fluxes (counts/s) and the Swift fluxes (ph cm-2s-1),
and the relationship between the RHESSI fluences (counts) and the Swift fluences (10-7 erg cm-2)
are plotted in fig. 1. There is no simply relation to convert the RHESSI count fluxes/fluences to the Swift fluxes/fluences
in energy units, but there exists a very strong correlation between them.
The Swift fluxes of the short and the long GRBs are on average approximately the same, but for the RHESSI data
the fluxes of the short GRBs are on average higher than for the long ones.
In the case of fluences, for both samples, the long GRBs have on average higher values than the short ones.
Also the gradient of the best-fitted straight line in the fluence- dependency is very similar for both data sets.
We acknowledge support of the grants GAUK 46307, GAČR 205/08/H005, MSM0021620860, and OTKA K077795.
References
- [1] TRUMPLER R. J. AND WEAVER H. F., Statistical Astronomy, (University of California Press, Berkeley) 1953.
- [2] PRESS H. W. ET AL., Numerical Recipes in Fortran, (Cambridge University Press) 1994, chapter 14.5.