1 Charles University, Faculty of Mathematics and Physics,
Astronomical Institute, Prague, Czech Republic
2 Kantonsschule Wohlen, Switzerland
Rising indications for three
gamma-ray burst groups
Abstract
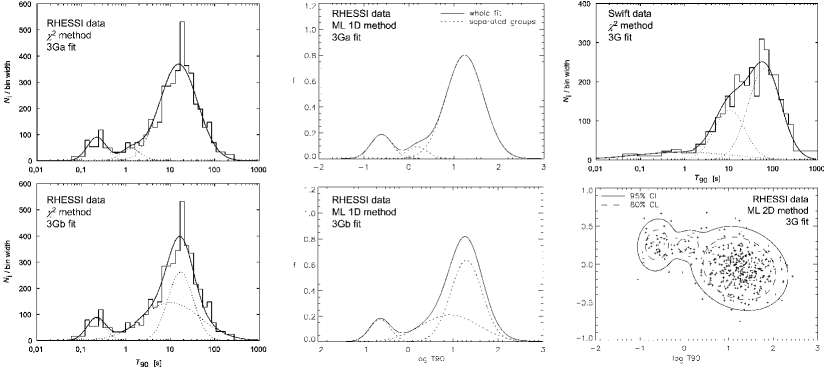
Several papers were written about the gamma-ray burst (GRBs) groups. Our statistical study is based on the durations and hardness ratios of the Swift and RHESSI data.
The RHESSI sample consists of 472 GRBs from Feb. 2002 to Feb. 2009. When the hardness ratios are used in our analysis, we took only bursts before Nov. 2007, i.e., before the spectrometer’s annealing (425 GRBs). The Swift sample consists of 388 GRBs from Nov. 2004 to Dec. 2007.
There is a rising number of the statistical works giving results that three groups may exist (BATSE [1], Swift [2, 3], Beppo-SAX [4] and RHESSI [5] data). We analyse the updated RHESSI and Swift databases, use the minimal fitting of the histogram and F-test, the maximum likelihood (ML) method and ML ratio test applied on the durations alone (1D) or /hardnesses pairs (2D) (see fig. 1). We assume that and are log-normally distributed.
Summarizing our results, we confirm, from the statistical point
of view, a significant () improvement in the and
values if a third group is concerned (see table 1).
We acknowledge the support from the grants GAUK 46307, GAČR 205/08/H005, MSM0021620860, and OTKA K077795.
| fit | |||||||||||
|---|---|---|---|---|---|---|---|---|---|---|---|
| Swift | 2 | 20 | 17.0 | 59.0 | RHESSI | ML 1D | -438.6 | ||||
| 3a | 17 | 10.0 | 86.7 | 2.5 | -433.8 | 2.3 | |||||
| 3b | -434.2 | 3.3 | |||||||||
| RHESSI | 2 | 23 | 31.9 | 7.9 | RHESSI | ML 2D | -318.8 | ||||
| 3a | 20 | 23.2 | 23.0 | 8.7 | -310.0 | 0.7 | |||||
| 3b | 20 | 20.0 | 39.8 | 2.2 | -311.7 | 2.7 |
References
- [1] HORVÁTH I. ET AL., A&A, 447 (2006) 23.
- [2] HORVÁTH I. ET AL., A&A, 489 (2008) L1.
- [3] HUJA D. ET AL., A&A, 504 (2009) 67.
- [4] HORVÁTH I., Ap&SS, 323 (2009) 83.
- [5] ŘÍPA J. ET AL., A&A, 498 (2009) 399.