Shock acceleration of relativistic particles in galaxy-galaxy collisions
Abstract
Context. All galaxies without a radio-loud AGN follow a tight correlation between their global FIR and radio synchrotron luminosities, which is believed to be ultimately the result of the formation of massive stars. Two colliding pairs of galaxies, UGC12914/5 and UGC 813/6 deviate from this correlation and show an excess of radio emission which in both cases originates to a large extent in a gas bridge connecting the two galactic disks.
Aims. We are aiming to clarify the origin of the radio continuum emission from the bridge.
Methods. The radio synchrotron emission expected from the bridge regions is calculated, assuming that the kinetic energy liberated in the predominantly gas dynamic interaction of the respective interstellar media (ISM) has produced shock waves that efficiently accelerate nuclei and electrons to relativistic energies. We present a model for the acceleration of relativistic particles in these shocks and calculate the resulting radio emission, its spectral index and the expected high-energy -ray emission.
Results. It is found that the nonthermal energy produced in the collision is large enough to explain the radio emission from the bridge between the two galaxies. The calculated spectral index at the present time also agrees with the observed value. The expected -ray emission is not detectable with present day instruments, but might be observable with the next generation of -ray telescopes.
Conclusions. The deviation of these two interacting galaxy systems from the standard FIR-radio correlation is consistent with the acceleration of an additional population of electrons in large-scale shock waves resulting from the gas dynamic interaction of the two ISM. This process is not related to star formation and therefore it is expected that the systems do not follow the FIR-radio correlation. In particular, the radio emissions of these systems do not represent an argument against the calorimeter theory. The acceleration of relativistic electrons in shocks caused by an ISM collision, in the same way as described here, is likely to take place in other systems as well, as in galaxy clusters and groups or high-redshift systems.
Key Words.:
cosmic rays – Galaxies: interaction – Galaxies: ISM – Galaxies: invididual (UGC 12914/5, UGC813/6) – Radio continuum: galaxies1 Introduction
Since the early years of the IRAS mission in far-infrared (FIR) astronomy, late type galaxies without a bright, radio-loud AGN are known to show a universal, tight correlation between their spatially integrated FIR luminosities and monochromatic radio continuum emissions (de Jong et al. 1985; Helou et al. 1985). It is followed by all galaxies later than SO/a regardless of morphology, size, color, etc. For reviews, see e.g. Condon (1992); Völk & Xu (1994). The correlation is believed to be ultimately a result of the formation of massive stars. These produce the optical/UV radiation which heats interstellar dust grains. The FIR emission is then the thermal radiation of those heated grains. At any given time some of the stars have a strong mass loss, either due to winds or due to their ultimate explosion as supernovae, which may lead to the acceleration of electrons to relativistic energies and allows them to emit radio synchrotron radiation.
The identification of the dominant physical processes and the quantitative determination of their role in galaxies has been a matter of discussion ever since the correlation was found. One explanation is the calorimeter theory (Völk 1989). It argues that the main fraction of the dust heating stellar photon flux is absorbed by the dust grains in the galaxy, and that the interstellar relativistic electrons dominantly lose their energy within the galaxy and its halo by Inverse Compton collisions with the photons of the interstellar radiation field, as well as by synchrotron radiation in the magnetic field, rather than escaping from the galaxy without major energy loss, like the nuclear cosmic ray particles. Thus galaxies act like calorimeters for their own primary photon and electron emissions, independent of the details of production and transport of these carriers of energy.
The theory has been disputed on the grounds that the synchrotron frequency spectrum of a significant fraction of galaxies does not show the steepness expected in a simple one-zone transport model of galactic escape by spatial diffusion in the presence of radiative energy losses (e.g. Niklas et al. 1997). It has also been demonstrated that in a variety of cases the power output in the UV is comparable to that observed in the FIR – defined in different ways (Popescu & Tuffs 2002; Xu et al. 2006) – showing that not all normal galaxies are optically thick to their own UV emission. However, Lisenfeld et al. (1996) showed that the calorimeter theory is likely to hold in an approximate way for normal spiral galaxies. Furthermore, the spectral index of the synchrotron frequency spectrum of an entire galaxy does not allow a precise estimate of the escape fraction. Rather the spatial variation of the spectral index in the halo should be used (Lisenfeld & Völk 2000). Most recently, Strong et al. (2010) have argued, using the GALPROP model for cosmic ray propagation, that our Galaxy is indeed nearly a cosmic ray electron calorimeter. A recent discussion of the theoretical basis for the FIR-radio correlation is contained in Lacki et al. (2010).
A key element for the understanding of the correlation is the question whether the synchrotron electrons escape from galaxies without essential energy loss or not. In this context, Condon et al. (1993, 2002) have investigated two face-on interacting spiral galaxy systems where, presumably after the interaction, the respective pairs of galaxy disks are well separated from each other optically, but are connected by a radio continuum-bright “bridge” of gas, suggested to be stripped from the interpenetrating disks. Condon et al. (1993, 2002) gave an interpretation of the fact that the two systems show overall a significant excess of radio continuum emission relative to the FIR-radio continuum ratio, expected from the FIR-radio correlation for single galaxies. They concluded that the excess radio emission in the so-called bridges was rather the result of the escape of relativistic electrons from the respective gas disks and that it was only visible because the stretched and therefore strong magnetic field in the bridges allowed them to emit synchrotron radiation. The authors contended that in noninteracting galaxies a similar escape would occur, albeit silently, because of the negligible magnetic field strength in their outer regions. Therefore they concluded that isolated disk galaxies were not good “calorimeters”.
In this paper the dynamical effects of such galaxy-galaxy collisions on the interstellar gas are investigated. It is argued that the interstellar media of the respective galaxies will undergo a largely gas dynamic interaction, where the low-density parts exchange momentum and energy through the formation of large-scale shock waves in the supersonic collision. The stars and the dense parts of the more massive interstellar clouds, on the other hand, will interpenetrate each other with only a stellar-dynamic interaction. To lowest approximation the stellar disks will asymptotically remain intact, together with the massive interstellar clouds, even though the latter may be stripped of their outer layers. The lower-density interstellar media, on the other hand, bring each other to rest in their center of momentum system, and remain between the seperating stellar disks. The interstellar magnetic fields, anchored primarily in the massive molecular clouds, are thereby stretched and their tension substantially increased. It is then argued that the resulting interstellar shocks should be able to diffusively accelerate charged nuclear particles and electrons to ultrarelativistic energies in a very effective manner, comparable to what typically happens in supernova remnants. This leads to the large-scale production of a new population of relativistic electrons, diffusively confined in the fluctuating magnetic fields – which themselves are possibly also amplified by the accelerating particles, even though this effect is neglected here. The new electron population then implies significant synchrotron emission from the interaction region. In this paper a model for the acceleration of relativistic particles is presented and the synchrotron emission from the relativistic electron component is calculated, as well as the expected -ray emission from relativistic nuclei and electrons. This model is shown to be able to explain the radio continuum emission observed from the bridge between the galaxies.
2 The two collisional galaxy systems
| UGC 12914/5 | Ref. | UGC 813/6 | Ref. | |
|---|---|---|---|---|
| Distance | 60 Mpc | 69 Mpc | ||
| Sν- system | 114 mJy | 1 | 62.9 mJy | 2 |
| Sν - individual | 19mJy (UGC 12914) | 1 | 19mJy (UGC 813) | 2 |
| 47mJy (UGC 12915) | 1 | 22mJy (UGC 816) | 2 | |
| Pν - system | 4.9 1022 WHz-1 | 3.6 1022 WHz-1 | ||
| Pν - bridge | WHz-1 | 1 | WHz-1 | 2 |
| - bridge | 1.3-1.4 | 1 | 1.3 | 2 |
| S60μm - system | 6.3 Jy | 3 | 2.76 Jy | 4 |
| S100μm - system | 13.4 Jy | 3 | 7.58 Jy | 4 |
| LFIR-system | 1.6 1037 W | 1.05 1037 W | ||
| 1.93 | 1.90 |
See Sect. 2 for a detailed description of the entries.
Condon et al. (1993) described the radio continuum and HI properties of UGC 12914/5, called ”Taffy” galaxies, a system of two galaxies that have experienced a direct collision some 30 Myr ago, in which the galactic discs collided head-on and interpenetrated each other. A bridge of synchrotron emission extends between both stellar disks, showing that both relativistic electrons and magnetic fields are present. The spectral index of the radio emission between 1.49 and 4.9 GHz steepens gradually from the stellar disks with values of 0.7–0.8 to values of 1.3–1.4 in the middle of the connecting gas bridge. This steep spectral index will be argued to be indicative of dominant synchrotron and inverse Compton losses suffered by the relativistic electrons.
A further noticeable feature of this system is that the ratio between the FIR and the radio synchrotron luminosities is about a factor of 2 lower than the mean value found in spiral galaxies. One can describe this ratio by the parameter (Helou et al. 1985):
| (1) |
where is the observed 1.4 GHz flux density in units of W m-2Hz-1 and where
| (2) |
with and denoting the IRAS 60 and 100 m band flux densities in units of Jy. The value for the galaxy system is , lower by a factor of about two than the values found for samples of moderately luminous FIR galaxies without an active nucleus. For example, Yun et al. (2001) derived a mean value of with a mean deviation of for a sample of 1809 galaxies with Jy. Since about 40% of the total radio continuum emission comes from the bridge, but only a much smaller fraction of the total dust emission ( 5 % at 15 m, Jarrett et al. 1999, and about 20% at 450 and 840 m, Zhu et al. 2007), the reason for this low value of is an excess radio emission from the bridge.
Apart from the sychrotron emitting electrons the bridge contains also large amounts of atomic (Condon et al. 1993) and molecular (Braine et al. 2003) gas. The total amount of gas in the bridge is several times M⊙. An efficient way of depositing these gas masses in the bridge is a gas dynamic interaction of the diffuse parts of the galaxies’ interstellar media (ISM). It is expected that also the extended HI clouds collide efficiently in a direct collision. Braine et al. (2004) argued that this mechanism is even valid for the smaller and denser molecular gas clouds traced by CO. The gas gets ionized in this high-speed collision but, due to the high densities, it recombines and becomes molecular again on a very short time-scale. The line ratios and the isotopic ratios of CO show that the opacities are low, and no high-density tracers such as HCN have been detected. Our interpretation is that most likely the dense cores – capable of forming stars – have remained within the stellar disks together with the stars. Zhu et al. (2007) showed that the physical conditions of the molecular gas in the bridge are comparable to those in the diffuse clouds in our Galaxy. In agreement with this interpretation, the SFR in the bridge is only about 10% of what is expected from the molecular gas mass (Braine et al. 2004). Also, the mid/FIR emission from dust in the bridge is very low (Jarrett et al. 1999; Zhu et al. 2007), indicating a very low SFR, but showing that some dust is nevertheless present.
A similar system, UGC 813/6 was described in a later paper by Condon et al. (2002). Features common to both systems are (i) a synchrotron bridge between the two disks (ii) a low value of the parameter , and (iii) the presence of large amounts of atomic and molecular gas in the bridge. The similarities indicate that this second system has gone through a similar collision process, and that the gas has been deposited by the same mechanism in the bridge.
In Tab. 1 some observational data for these systems are listed. The entries in the table are:
- Row 1:
-
Adopted distance, based on km s-1Mpc-1.
- Row 2:
-
Total radio flux density of the systems obtained from VLA observation in the D-array (UGC 12194/5), respectively in the C-array (UGC 813/6). The frequency of the radio observations is 1.49 GHz (UGC 12194/5), respectively 1.40 GHz (UGC 813/6)
- Row 3 and 4:
-
Radio flux density of the individual galaxies from VLA B-array observations.
- Row 5:
-
Radio continuum luminosity of the systems obtained from the flux density in row 2.
- Row 6:
-
Radio continuum luminosity from the bridge. The lower value is calculated from the difference between the value for the system and the individual galaxies in the B-array observations. The higher values uses the slightly higher C (respectively D) array values for the emission from the total system and thereby assumes that the difference between the higher and lower resolution observations is due to diffuse emission coming from the bridge.
- Row 7:
-
The radio spectral index between 1.49 and 4.86 GHz (for UGC12914/5) and between 1.40 and 4.86 (for UGC 813/6) in the middle of the bridge
- Row 8 and 9:
-
The IRAS flux densities at 60 and 100 m.
- Row 10:
-
The FIR luminosity calculated as:
LFIR - Row 11:
-
The radio-to-FIR ratio, , calculated from eqs. (1) and (2).
3 Modelling the radio emission from the bridge
3.1 Energy released in the interaction of the ISM
In a face-on collision, as suffered by UGC 12194/5 and UGC 813/6, the stellar disks interpenetrate each other without being too much altered. However, the diffuse gas and part of the gas clouds interact hydrodynamically and exchange energy and momentum. The large quantities of atomic and molecular gas that are present in both brigdes clearly show that such gas interaction took place (Condon 1993, 2002; Braine 2003, 2004), even though the denser parts of the gas clouds should survive like the stars.
If one assumes that half of the gas, which is now present in the bridge, was previously in one galaxy, and the other half in the other galaxy, then the total energy liberated in a fully inelastic interaction is the kinetic energy of the gas mass:
| (3) |
where is the total gas mass in the bridge and denotes the velocity difference of the gas at collision. The factor 1/2 converts this velocity to the velocity difference in the center of mass system (assuming that both gas disks are equally massive).
With respect to the gas masses, for UGC 12914/5 the values given in Tab. 1 in Braine et al. (2003) are used. For UGC 813/6 the masses from the bridge were calculated from the values of the three diagonal pointings (at offsets (0,0), (-7,10) and (7,10) given in Tab. 1 of Braine et al. (2004)). For the determination of the molecular gas mass from the CO measurement, a conversion factor has to be adopted. Braine et al. (2003) argued that the conversion factor in the bridge of these interacting systems is most likely lower than the Galactic value of cm-2 (K km s-1)-2, due to the low opacity indicated by the isotopic line ratios and the CO/HCN ratio. They suggest that a four times lower conversion factor is a good estimate, in agreement with the results of Zhu et al. (2007), based on a multi-transition analysis. This is indeed possible if the molecular gas in the bridge region is of rather low density, having been stripped from denser molecular clouds. Here, both values are adopted, the Galactic conversion factor and a 4 times lower factor, in order to cover the range of likely values.
The relative velocity between the galaxies, , in the case of UGC 12914/5 has been derived by Condon et al. (1993) from a dynamical analysis of the HI line and of the galaxy masses. In addition to the relative velocity, the disks are counterrotating at a velocity of about 570 km s-1. However, since the collision is face-on, this counterrotation will only make this an oblique shock. Given the expected smallness of the Alfvén Mach number, the velocity shear will have a negligible effect on the shock compression and the resulting particle acceleration. Therefore this shear velocity component is not taken into account in the calculation of the available energy for particle acceleration. In the case of UGC 813/6, is estimated following the analysis of Condon et al. (2002) in their Sect. 3.4, but correcting their eq. (1) to yield:
| (4) |
where () is the velocity component parallel (perpendicular) to the line of sight, is the distance between the galaxies perpendicular to the line of sight, is the gravitational constant and the total mass of the system. Using the numbers derived for , and in Condon et al. (2002), km s-1, sligthly higher than the value of 500 km s-1 derived by Condon et al. (2002).
The masses in the bridge, the collision velocities and the resulting kinetic energies for both systems are listed in Tab. 2. The gas masses are multiplied by a factor of 1.37 to take into account the helium fraction.
| UGC 12914/5 | Ref. | UGC 813/6 | Ref. | |
|---|---|---|---|---|
| Kinetic energy | ||||
| 600 km s-1 | 1 | 600 km s-1 | 2, 5 | |
| M(HI)(a)(bridge) | M⊙ | 3 | 3.2 109 M⊙ | 4 |
| M()(a,b)(bridge) | M⊙ | 3 | M⊙ | 4 |
| erg | 5 | erg | 5 | |
| erg | 5 | erg | 5 | |
| Energy loss of the relativistic electrons | ||||
| distance between galaxy nuclei | 20 kpc | 1 | 21.6 kpc | 2 |
| time since start of interaction, | yr | 5 | yr | 5 |
| 7 G | 1 | 7G | 2 | |
| 0.76 eV cm-3 | 5 | 0.56 eV cm-3 | 5 | |
| Predicted radio emission | ||||
| Pν-predicted,low(c,d) | W Hz-1 | 5 | W Hz-1 | 5 |
| Pν-predicted,high(c,d) | W Hz-1 | 5 | W Hz-1 | 5 |
| -predicted | 1.4 | 5 | 1.3 | 5 |
See Sects. 3.1 and 3.4 for a detailed explanation how the quantities were derived.
(a) The masses include a factor of 1.37 for the Helium fraction.
(b) The higher mass is calculated for a Galactic conversion factor from CO intensity to H2 mass, the lower value for a 4 times lower conversion factor.
(c) The value named ”low” is calculated with a 4 times lower value for the molecular gas mass and the value named “high” is calculated with a Galactic conversion factor.
(d) The range of values is given by the uncertainties of the efficiency of CR acceleration in shocks (between 10 and 30%)
References: (1) Condon et al. (1993) (2) Condon et al. (2002) (3) Braine et al. (2003) (4) Braine et al. 2004 (5) present work
3.2 Production of relativistic electrons
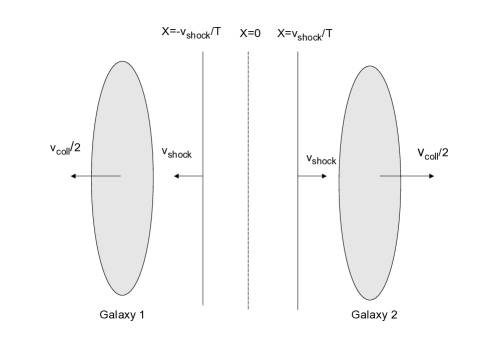
During the collision of the ISM, strong large-scale shocks will form. Since the magnetosonic velocity in the ISM, of the order of some 10 km s-1, is much smaller than the velocity of the collision, of several 100 km s-1, the square of the magnetosonic Mach number of these shocks will be . A tangential discontinuity will form at the position of the collision and two shocks will propagate in opposite directions with velocities , communicating the interaction to larger and larger fractions of the colliding interstellar gas masses. In between these shocks the galaxy is filled with post-shock gas. Support for this prediction comes from the observation of strong, shock-excited H2 emission within the bridge of UGC 12914/5 (Peterson et al., in preparation).
Fig. 1 shows the idealized picture of this interaction, the basis of our model, in the reference frame of the motion normal to this tangential discontinuity, which is also the center of mass system. In this frame, the post-shock normal velocity vanishes and the preshock normal velocity of the gas is . The contact discontinuity is stationary and situated in the middle between the galaxies (at in Fig. 1). In a strong, but approximately unmodified, adiabatic gas shock, the normal component of the velocity difference between the shock in the pre- and postshock gas follows the relation:
| (5) |
With , this yields . The shock velocity , relative to the unperturbed ISM gas, is then = 400 km/sec, for UGC 12914.
We can make a rough estimate of the present position of the shocks, based on the geometry of the galaxies. Taking UGC 12194/5 as an example, we estimate from Fig. 1 in Condon et al. (1993) that the distance between the galaxy midplanes is roughly twice the thickness of the galaxy disks, . We can then calculate the time elapsed since the beginning of the interaction between the ISM in the galaxy disks, taking into account their thickness , as . The shocks that formed at this time have propagated since then in opposite directions with a speed , reaching by now a distance from the contact discontinuity (at ) of . Thus, in UGC 12194/5 the shocks are expected to be very close to the galaxy disks so that practically the entire bridge is expected to be filled with post-shock gas.
The Mach number of the shocks produced in this collision is like in middle-aged supernova remnants in the Sedov phase. Roughly speaking, the particle acceleration efficiency of such shocks will therefore be similar to that of a supernova remnant, i.e. of the order of (e.g. Berezhko & Völk 1997). This is a basic assumption for the present paper.
The source function , i.e. the number of relativistic particles produced by the shock per energy and time interval is given by:
| (6) |
where is the area covered by the shock (roughly the area of the galaxy disks). The factor 2 is due to the fact that the shocks propagate into two, opposite directions. is the downstream, uniform number of relativistic particles of rest mass , produced per volume and energy interval at the shocks:
| (7) |
Here, is the spectral index of the differential relativistic particle source spectrum, taken to be (Drury et al. 1994; Berezhko & Völk 1997). For the nuclear particles, essentially protons, the constant can be determined by requiring that the total energy converted into relativistic particles during the entire duration of the interaction, , is equal to :
for . Here, is the minimum energy of relativistic protons of mass accelerated, taking as GeV (Drury et al. 1994). This gives
| (10) |
In the Galactic cosmic rays, at a given energy, the number of relativistic electrons is about 1% of that of the protons at GeV energies, and the source spectra for electrons and protons are probably similar (Müller 2001). Assuming that this electron-to-proton ratio is also representative for the source spectra in the galaxies considered here, implying that the electron and proton source spectra are the same, we adopt for the source function of the relativistic electrons which means that their source distribution is , with .
3.3 Relativistic electron density and synchrotron emission
In order to calculate the synchrotron emission from the bridge we solve the time-dependent equation for the electron particle density . Due to the spatial symmetry of the situation, we can limit ourselves to a one-dimensional approximation where is the coordinate in the direction along which the galaxies separate (see Fig. 1). Furthermore, we neglect the diffusion of relativistic electrons because the typical spatial scales which are relevant on the time-scales discussed here, yr, are 1 kpc, whereas the width of the bridge is 10 kpc. We can then write:
| (11) |
where
| (12) |
is the local source strength (in units of relativistic electrons produced per energy interval per time and per volume). This source strength describes two shocks that start at at and propagate into opposite directions with velocity . Eq.11 takes into account the electron acceleration in the shocks and the subsequent radiative energy losses of these CR electrons due to Inverse Compton and synchrotron losses as:
where is approximated by the Thompson scattering cross section, the magnetic field strength, its energy density and is the energy density of the radiation field. From the radio and optical data presented by Condon et al. (1993) one can conclude that at the present time the two stellar disks are seperated by a distance that is roughly equal to the sum of their optical thicknesses. This implies that the shocked material in the bridge between them has barely expanded back to its preshock density. Therefore the adiabatic losses of the accelerated electrons can probably be disregarded relative to the radiative losses. This is consistent with the fact that the distribution of the synchrotron spectral index , between 1.49 and 4.86 GHz, has an integrated value in the bridge region (Condon et al., 1993), indicative of dominant Inverse Compton and synchrotron losses.
The solution of eq.11 is simplyfied by noting the symmetry of the local source function (eq.12) around , so that . The solution of eq. 11 is:
| for and | |||||
| (14) | |||||
| for and |
with being the life-time of a relativistic electron against radiative energy losses. This means that the density of relativistic electrons, , is zero in those regions, where either the shock has not passed yet (for ) or where all relativistic electrons have already lost their energy down to levels below (for ).
We integrate this expression over the volume of the bridge and obtain the total number of relativistic electrons in the bridge at time and per energy interval, . Due to the symmetry of with respect to we can carry out this integration only for and multiply the result by a factor of 2:
| (15) |
where and because outside these limits . The result of the integration is:
| (16) | |||||
and
Finally, we obtain the synchrotron spectrum by convolving , respectively , with the synchrotron emission spectrum of a single electron.
We will compare the synchrotron emission, predicted from the spatially integrated distribution function (eq.16), to the observed radio emission from the bridge. The synchrotron emission derived from the local distribution (eq.14) will be used to calculate the spectral index between 1.49 (respectively 1.40 for UGC 813/6) and 4.89 GHz at which will be compared to the observed value at the center of the bridge.
3.4 Choice of the parameters
Apart from the energy available for particle acceleration, estimated in Sect. 3.1, we need to specify several additional parameters in order to calculate the value of the expected radio emission from the bridge. These parameters are (i) the magnetic field strength, (ii) the energy density of the radiation field, both determining the radiative energy losses, and (iii) , the time elapsed since the beginning of the interaction. The adopted parameters are listed in Tab. 2. In the following we describe how they were estimated and the uncertainty associated with them.
Most of the parameters are, at least roughly, constrained by the observations. The magnetic field can be estimated from the minimum energy requirement. Condon et al. (1993) derived the average magnetic field strength with this method to be about 7 G in the bridge of UGC 12914/5. Condon et al. (2002) derived values between 5 G (south) and 9 G (north) for the bridge in UGC 813/6. We adopt their value for UGC 12914/5 and take an intermediate value of G for UGC 813/6.
The radiation energy density in the bridges is low since practically no star formation is taking place. We can estimate the energy density due to star formation in a similar way as done by Condon et al. (2002), from the observed fluxes in the blue and FIR. From the blue magnitudes of UGC 813 and UGC 816 ( = 13.7 and 13.2, respectively, from NED), a flux of Wm-2 follows. Adding the FIR flux of W m-2 we obtain a total flux of Wm-2. From this, we estimate a photon energy density in the bridge of about 0.3 eV cm-3. For UGC 12914/5 we derive with = 12.51 and 13.06 for UGC 12914 and UGC 12915, respectively, (from NED), a flux of Wm-2 in the blue, and, together with a FIR flux of Wm-2, a total flux of Wm-2. From this, we estimate the energy density of the radiation field in the bridge to be about 0.5 eV cm-3. To these values we have to add the energy density due to the Cosmic Microwave Background of 0.26 eV cm-3 (e.g. Longair 1997).
Condon et al. (1993, 2002) estimated the time elapsed since the beginning of the collision from the distance and relative velocity of the systems. They find yr (for H = 0.75) for UGC 12914/5 (Condon et al. 1993) and yr for UGC 813/6 (Condon et al. 2002). The latter value would be slightly lower () taking into account the different collisional velocity derived in Sect. 3.1. We adopt values in these ranges (see Tab. 2). These values are in addition constrained by a fit to the observed spectral index in the center of the bridge.
From the energy density of the magnetic field and the radiation field, the radiative energy loss time scale is derived. The spectral index in the center, , depends in a very sensitive way on , if . E.g. for the values of and as in Tab. 2 for UGC 12914/5 we derive for yr ( respectiveley yr, yr) values of of 1.3 (respectively 1.4, 1.6). We can therefore use this dependence as a further constraint on the combination of parameters , and by comparing our model predictions to the observed value of in the center. Whereas the influence of on is rather strong, the effect on the predicted total synchrotron emission is only minor. E.g. for the values of as in the example above ( yr, yr, yr) we estimate a total synchrotron emission -predicted, high = W Hz-1, W Hz-1, W Hz-1.
Thus, even though we calculate the spectral index in a simplified model, (e.g. neglecting diffusion), which introduces some uncertainties when comparing it to the data, it still provides a useful observational constraint on the combination of , and . This constraint, together with the fact that each parameter is reasonably well constrained by individual observations, makes the uncertainty introduced by these parameters small. Overall, the predicted radio emission at 1.49 GHz (respectively 1.40 GHz for UGC 813/6) depends mainly on the available energy in the collision, whereas the other parameters have only a secondary influence on the result.
3.5 Results for the radio emission
In Tab. 2 we list the predicted values for the synchrotron emission. We list a range of values which is given by the parameters that provide the main uncertainty in our estimate: (i) The uncertainty in the molecular gas mass which is mostly due to the uncertainty in the conversion factor from CO to H2. The gas mass directly determines the total kinetic energy. We adopt a Galactic conversion factor as an upper limit, as well as a 4 times lower factor, as suggested by Braine et al. (2003) and Zhu et al. (2007). (ii) The uncertainty in the efficiency of particle acceleration in shocks. We adopt a range of realistic values between 10% – 30% . We also list the predicted value for the spectral index, between 1.49 GHZ and 4.89 Ghz (for UGC 12914/5), and between 1.40 GHz and 4.89 GHz (for UGC 813/6), respectively, in the center of the bridge.
In addition, for UGC 813/6 the uncertainty in the relative velocity (and thus in the total available kinetic energy) is relatively high because the total mass of the system, necessary for a dynamical study and an estimate of the relative velocity, could not be determined from the HI line profile and had to be estimated from the HI mass (Condon et al. 2003).
The given range of predictions for the radio emission from the bridges encompasses the observed values in both cases. Given the uncertainties, which lie mainly in the energy that goes into the acceleration of relativistic electrons, the agreement is satisfactory. The model calculations thus show that acceleration by interstellar shocks caused by the galaxy-galaxy interaction is indeed able to explain the radio emission from the bridge.
4 High-energy gamma-ray emission
Although not the main topic of this paper, it is clear that the interaction of galaxies considered here will also lead to the acceleration of gamma-ray producing very high-energy particles, both nuclei and electrons, in the form of the distribution , cf. Eq. (7). The visibility of the acceleration process also in high-energy -rays would be an independent argument for the model presented. Although this is not likely for present-day -ray -instruments – essentially due to the relatively large distance of the objects – it is therefore worthwhile, as a corollary, to investigate their expected -ray flux. In the present context only a short estimate will be given, whereas details are deferred to a seperate paper.
Concentrating on UGC 12914 for the following, erg, cf. Table 2. When the shocks have gone through the interacting ISM of the two galaxies, which is the case at about the present epoch, this energy is in the form of thermal and nonthermal particle energy. A fraction of this is by assumption in nonthermal energy in relativistic particles, predominantly nuclei. This corresponds to erg which is roughly times more energy than available from a single supernova remnant which liberates erg of hydrodynamical explosion energy.
The bridge volume is estimated as , where kpc (Condon et al. 1993). Then, using the masses for atomic and molecular hydrogen in the bridge (cf. Tab. 2), the gas density comes out to be cm-3, which is rather small.
An analytical estimate for the integral hadronic -ray emission, from -production by collisions of energetic protons with gas nuclei and subsequent decay into two -rays , is given in Eq. (9) of Drury et al. (1994) for gamma energies large compared to 100 MeV:
| (17) | |||||
Inserting the values erg, , and cm-3 results in
| (18) | |||||
The last factor is very small compared to unity, where a comfortable detection with ground-based imaging Cherenkov telescopes is to be expected (Drury et al. 1994). On the other hand, the lowest -ray flux from an astrophysical source detected until now was . This measurement was done with the H.E.S.S. telescope system for the nearby starburst galaxy NGC253 (Acero et al. 2009). Taking this result as a yard stick, the expected hadronic flux from UGC 12914 at -ray energies above 220 GeV is still a factor of 3-9 below this minimum flux, even for the most optimistic values of the parameters discussed above. It can be shown that the expected Inverse Compton flux is still by two orders of magnitude lower, essentially as a result of the age yrs which already leads to radiative cooling of the radio synchrotron electrons.
The situation would be more favorable for the future -ray instrument Cherenkov Telescope Array (CTA) whose sensitivity is expected to be a factor of ten higher than that of the H.E.S.S. telescope system. For CTA UGC 12914 might therefore be marginally detectable.
As already mentioned above, the reason for the low -ray flux from both UGC 12914, and UGC 813/6 as well, is their comparatively large distance. Indeed if, for example, UGC 12914 was at the distance of NGC 253, which is between 2.6 Mpc and 3.9 Mpc, then its flux would be by a factor between 289 and 625 higher. This would be comfortably detectable even by present Northern Hemisphere ground-based -ray instruments like VERITAS and MAGIC. Similar conclusions hold at GeV energies for the LAT instrument on Fermi.
The present estimate indicates that such interacting systems are not very promising sources of high-energy -rays , unless they are located rather close-by, essentially just beyond the Local Group. It is therefore interesting to note that radio observations may be able to tell us more about the general nonthermal processes in such systems than -ray astronomy can do at the present time.
5 Concluding remarks
From the above results it is concluded that the radio synchrotron emission from the bridge region between the two galaxies can be explained by the acceleration of a new population of relativistic electrons at the large-scale shock waves that necessarily result from the supersonic collision of the respective interstellar media. This process is not related to star formation and therefore neither to the heating of dust by UV photons from massive stars. As a consequence, there is no reason to expect the standard radio/FIR correlation to hold for such a system. The observations of these bridge systems and the fact that they show an excess of radio emission with respect to the standard radio/FIR correlation can therefore not be used as an argument against a calorimeter model for this correlation.
The process discussed in this paper may have broader implications for the production of energetic particles, often summarily called cosmic rays, in interacting astrophysical systems. An example may be the production of gas fragments in galaxy clusters, when gas-rich galaxies enter the intracluster medium and get partly stripped of their gas content by tidal interactions or by more direct, hydrodynamic interactions with existing cluster galaxies up to incomplete mergers (e.g. Völk & Xu 1994). In all such cases the flow velocities can be expected to be supersonic for the relatively cold interstellar gas of the participating galaxies, resulting in shear flows as well as supersonic compressions. This is not necessarily the same process that happens when subclusters merge in the formation of larger clusters, because the diffuse gas involved is usually quite hot already in such cases, with the consequence that the particle acceleration process is rather inefficient. The process corresponds much more closely to the rather rare gravitational accretion of cold gas onto massive clusters.
A similar process has been discussed more recently for Stephan’s Quintett, a group of galaxies at a comparable distance of about 80 Mpc, by Xu et al. (2003). In the intragroup medium of this system, a large shock ridge is detected which shows pronounced radio continuum and x-ray emission. The shock is produced by the collision of ISM from two galaxy group members. The radio continuum has a spectral index of 0.93 (Xu et al. 2003) which shows that it comes from moderately-aged synchrotron emission. Most likely, the origin of this radio emission is due to acceleration of relativistic electron in the shock in a very similar way as outlined here for the bridge systems.
Altogether, the two interacting galaxy pairs, discussed here, are possibly examples of what might have happened much more frequently at early stages of structure formation, when primordial galaxies had already developed magnetic fields as a consequence of early star formation, but when they were still likely to interact strongly with neighboring structures of a similar character.
Acknowledgements.
UL acknowledges financial support from the research project AYA2007-67625-C02-02 from the Spanish Ministerio de Ciencia y Educación and from the Junta de Andalucía.References
- Acero et al. (2009) Acero, F., et al. (H.E.S.S. Collaboration) 2009, Science 326, 1080
- Berezhko & Völk (1997) Berezhko, E.G., Völk, H.J., 1997, Astropart. Phys., 7, 183
- Braine et al. (2003) Braine, J., Davoust, E., Zhu, M., Lisenfeld, U., Seaquist, E., Motch, C., 2003, A&A, 408, L13
- Braine et al. (2004) Braine, J., Lisenfeld, U., Duc, P.-A., Brinks, E., Charmandaris, V., Leon, S., 2003, A&A, 418, 419
- Bushhouse et al. (1988) Bushouse, H. A., Werner, M.W., Lamb, S. A., 1988, ApJ, 335, 74
- Condon (1992) Condon, J. J. 1992, ARA&A, 30, 575
- Condon et al. (1993) Condon, J.J., Helou, G., Sanders, D.B., Soifer, B.T., 1993, AJ, 105, 1730
- Condon et al. (2002) Condon, J.J., Helou, G., Jarrett, T.H., 2002, AJ, 123, 1881
- de Jong et al. (1985) de Jong, T., Klein, U., Wielebinski, R., Wunderlich, E., 1985, A&A, 147, L6
- Drury et al. (1994) Drury, L.O’C., Aharonian, F.A., & Völk, H.J., 1994, A&A, 287, 959
- Helou et al. (1985) Helou, G., Soifer, B.T., Rowan-Robinson, M., 1985, ApJ, 298, L7
- Jarrett et al. (1999) Jarrett, T.H., Helou, G., Van Buren, D., Valjavec, E., Condon, J. J., 1999, ApJ, 118, 2132
- Lacki et al. (2010) Lacki, B.C., Thompson, T.A., & Quataert, E., 2010, ApJ, 717, 1
- Lisenfeld et al. (1996) Lisenfeld, U., Völk, H. J., Xu, C. 1996, A&A, 306, 677
- Lisenfeld & Völk (2000) Lisenfeld, U., Völk, H. J. 2000, A&A, 354, 423
- Longair (1997) Longair, M.S., 1997, “High Energy Astrophysics”, chapter 13, Cambridge Univ. Press, Cambridge, UK
- Müller (2001) Müller, D., 2001, Adv. Space Res., 27, 659
- Niklas et al. (1997) Niklas, S., Klein, U., Wielebinski, R., 1997, A&A, 322, 19
- Popescu & Tuffs (2002) Popescu, C.C., Tuffs, R.J., 2002, MNRAS, 335, L41
- Strong et al. (2010) Strong, A. W., Porter, T.A., Digel, S. W., Jóhannesson, G., Martin, P., Moskalenko, I.V., Murphy, E. J., Orlando, E., 2010, ApJL, in press, arXiv:1008.4330
- Völk (1989) Völk, H.J., 1989, A&A, 218, 67
- Völk & Xu (1994) Völk, H.J., Xu, C., 1994, Infrared Phys. Technol., 35, 527
- Yun et al. (2001) Yun, M.S., Reddy, N.A., Condon, J.J., 2001, ApJ, 554, 803
- Zhu et al. (2007) Zhu, M., Gao, Y., Seaquist, E.R., Dunne, L., 2007, AJ, 134, 118
- Xu et al. (2003) Xu, C. K., Lu, N., Condon, J. J., Dopita, M., Tuffs, R. J. 2003, ApJ, 595, 665
- Xu et al. (2006) Xu, C.K., Buat, V., Iglesias-Páramo, J., et al., 2006, ApJ, 646, 834