Time-Variable Accretion in the TW Hya Star/Disk System
Abstract
We present two epochs of observations of TW Hya from the high-dispersion near-IR spectrograph ARIES at the MMT. We detect strong emission from the Br transition of hydrogen, indicating an accretion rate substantially larger than previously estimated using hydrogen line emission. The Br line-strength varies across our two observed epochs. We also measure circumstellar-to-stellar flux ratios (i.e., veilings) that appear close to zero in both epochs. These findings suggest that TW Hya experiences episodes of enhanced accretion while the inner disk remains largely devoid of dust. We discuss several physical mechanisms that may explain these observations.
1 Introduction
TW Hya is a nearby ( pc), young ( Myr) star (Webb et al. 1999) surrounded by an accretion disk that evinces a large inner hole as judged from the observed spectral energy distribution (SED; Calvet et al. 2002) and mid-IR and sub-mm imaging (Ratzka et al. 2007; Hughes et al. 2007). These data can be modeled with an optically thick disk whose inner edge is located AU from the central star. While observations of 10 m silicate emission (Sitko et al. 2000; Uchida et al. 2004) together with spatially-resolved emission at 2 m (Eisner et al. 2006) suggest the presence of dust grains with sizes less than a few microns at stellocentric distances AU, this inner disk material appears optically thin, and has been estimated to constitute less than a lunar mass (Calvet et al. 2002). Such a small amount of material is compatible with the very low near-IR veiling measured previously (Johns-Krull & Valenti 2001; Yang et al. 2005).
Warm gas has also been detected within the optically thin inner region of TW Hya’s circumstellar disk (Herczeg et al. 2004; Rettig et al. 2004; Salyk et al. 2007, 2009; Pontoppidan et al. 2008; Najita et al. 2007). In fact, the gas appears to be distributed in a disk with a similar inclination to the optically thick dust disk observed at larger radii (–7∘; Pontoppidan et al. 2008; Qi et al. 2004). The inner disk of TW Hya, while optically thin, is clearly not completely devoid of matter.
A variety of accretion signatures have been detected in TW Hya, indicating some flow of gaseous material through the inner disk. Observations of H emission, interpreted in the context of a magnetospheric accretion model, indicated M⊙ yr-1 (Muzerolle et al. 2000). A shock model fitted to UV and optical photometry indicated a consistent value of M⊙ yr-1 (Muzerolle et al. 2000). A similar model fitted to a separate UV spectrophotometric dataset yielded M⊙ yr-1 (Herczeg et al. 2004). Analysis of two additional epochs of UV data separated by approximately two years indicate an accretion rate of M⊙ yr-1 on both occasions (Herczeg & Hillenbrand 2008). Still higher accretion rates were suggested by modeling of X-ray emission from TW Hya: M⊙ yr-1 (Kastner et al. 2002). In contrast, a subsequent study of X-ray emission derived an accretion rate of M⊙ yr-1 (Stelzer & Schmitt 2004). Modeling of the CIV Å line flux yields M⊙ yr-1 (Valenti et al. 2000).
While the large dispersion in accretion rate measurements is due in large part to different systematic effects for different techniques, in some cases the same technique used on different epochs (generally by different investigators) has yielded different accretion rates. Moreover, a study of Na D line variability suggested accretion rates varying between and M⊙ yr-1 over a 1-yr period (Alencar & Batalha 2002). Thus, it seems that the amount of material in the inner disk may fluctuate significantly over time.
In this paper, we present observations of Br emission and near-IR veiling. The two epochs of data show significant variations in Br emission strength, but not in veiling. We use these findings to examine the viability to different mechanisms proposed to maintain the optically thin inner region of TW Hya’s disk.
2 Observations and Data Reduction
We observed TW Hya on UT 17 January 2009 and UT 8 May 2009 with the ARIES instrument at the MMT. ARIES receives a corrected beam from the adaptive secondary of the MMT, and performs imaging and spectroscopy from 1 to 5 m wavelengths (although the 3–5 m detector is not yet implemented). We used the echelle mode of ARIES, with a resolving power of . The slit is , well-matched to the diffraction-limited, AO-corrected resolution of the MMT. The small slit allows many orders to be placed on the detector simultaneously, and our setup included non-contiguous orders across the and bands.
Based on the echelle dispersion, we expect a velocity resolution of approximately 10 km s-1. Measured FWHMs of argon lamp lines show that the actual instrumental velocity resolution of these observations is approximately 14 km s-1.
TW Hya was observed for 10 minutes on 17 January 2009 and for 40 minutes on 8 May 2009 (both of these are on-source integration times). In each epoch, observations of TW Hya were interleaved with observations, at similar airmass, of an A1V telluric calibrator star, HIP 54682. The data were flat-fielded using spectra of an incandescent lamp, and extracted, wavelength calibrated, and telluric corrected, using IRAF packages (Massey et al. 1992). Wavelength calibration used telluric absorption lines and the HITRAN linelist (Rothman et al. 2005), and is accurate to 1–2 km s-1.
We also obtained imaging data of TW Hya and the nearby star TWA 7 during both epochs. TWA 7 is a weak-line T Tauri star (Webb et al. 1999) of similar age to TW Hya (Neuhäuser et al. 2000). It exhibits no detectable emission above the stellar photosphere in the near-IR, although it does have long-wavelength excess emission indicative of a debris disk (Matthews et al. 2007). Due to the low declinations of both TW Hya and TWA 7, we did not have time to obtain spectra of TWA 7. However, since both sources were observed at similar airmasses and have similar colors, TWA 7 can be used for relative photometric calibration. In January, 2009, both objects were observed using the filter with integration times of 0.9 s. In May, 2009, the atmospheric transparency was better, and these objects saturated the detector when the filter was used, even for the shortest integration times. We therefore observed TW Hya and TWA 7 with a narrowband H2 filter, using 5 s integrations, during the May observations.
During our May observations, we also obtained spectra of GJ 568 A, an M3 V star (Gray et al. 2003). The total integration time was 25 minutes. The spectra were calibrated using the same procedure described above for TW Hya. We use GJ 568 below for a rough comparison of the veiling observed in TW Hya with that of an unveiled main-sequence star.
3 Results and Analysis
3.1 Photometry
For each observed epoch, we computed the counts for both TW Hya and TWA 7 within an aperture of 40-pixel () radius. The sky value was determined as the median of pixels with radii between 60 and 80; this value was subtracted from each pixel in the photometric aperture. Assuming the 2MASS magnitude of TWA 7, , we derive the magnitude of TW Hya at both epochs (Table 1). The two measurements are consistent with each other, and with the 2MASS magnitude, .
3.2 Br Spectra
Our Br spectra are shown in Figure 1. We measure equivalent widths (EWs) from these spectra by integrating the line flux between 2.1644 and 2.1668 m; this range covers all of the Br emission seen in both epochs. The main uncertainty in our EW determination is the continuum level. We estimate this uncertainty by fitting the continuum in different spectral regions. We find 12% error bars for our EW measurements.
The lines measured in both epochs are blue-shifted. In the January data, the blue-shift is more pronounced, and a “blue shoulder” is more prominent in the spectrum. Blue-shifts and blue-shoulder-profiles are expected for models of infalling gas, since absorption of Br emission by the infalling gas along the line of sight preferentially removes red emission (e.g., Hartmann et al. 1994; Najita et al. 1996; Muzerolle et al. 1998).
The emission in both epochs is substantially broader and more asymmetric than expected from stellar flares, which typically show strong (H line-to-continuum ratios ), narrow (FWHM km s-1), symmetric emission line cores (e.g., Hawley & Pettersen 1991; Hilton et al. 2010). Similarly, quiescent chromospheric activity produces emission that is narrower and more symmetric than emission produced by accretion processes (White & Basri 2003). Since the difference spectrum for the two epochs is broad and asymmetric–lacking a strong, narrow core–the change between spectra is probably not due to chromospheric activity.
Using the broad-band magnitude of TW Hya derived in §3.1, we can convert the observed Br EWs into line luminosities. These, in turn, can be converted into accretion luminosities using an empirical relationship derived by (Muzerolle et al. 1998). To convert the accretion luminosities into mass accretion rates requires knowledge of the stellar parameters: . For this calculation, we use the stellar parameters derived by Webb et al. (1999), assuming a distance of 56 pc: M⊙, R⊙, and K. These are the same values used by Muzerolle et al. (2000), enabling a fair comparison with their results. Derived line luminosities, accretion luminosities, and accretion rates are listed in Table 1.
3.3 Veiling
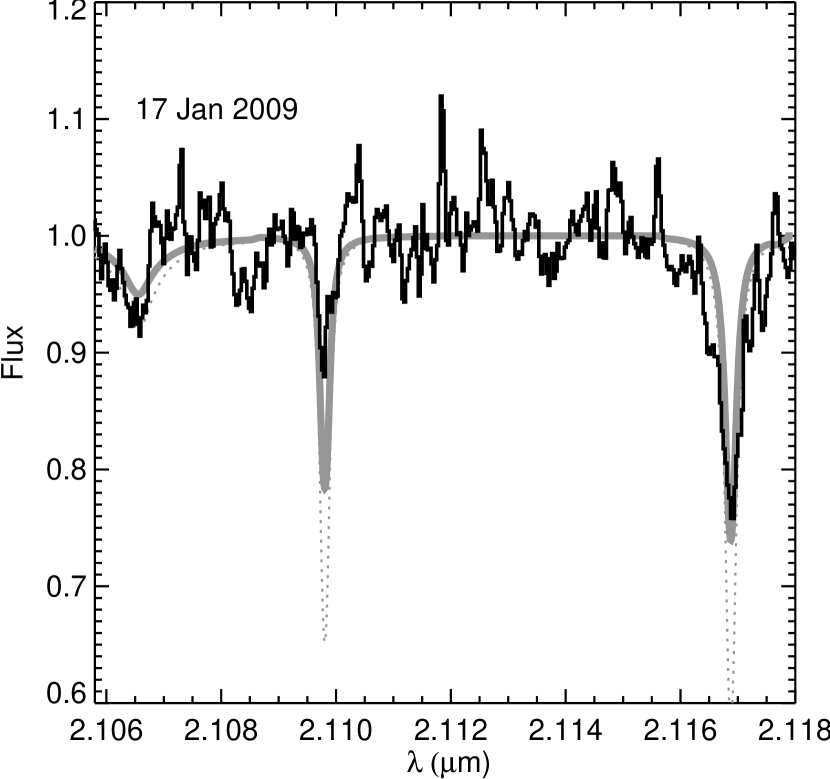
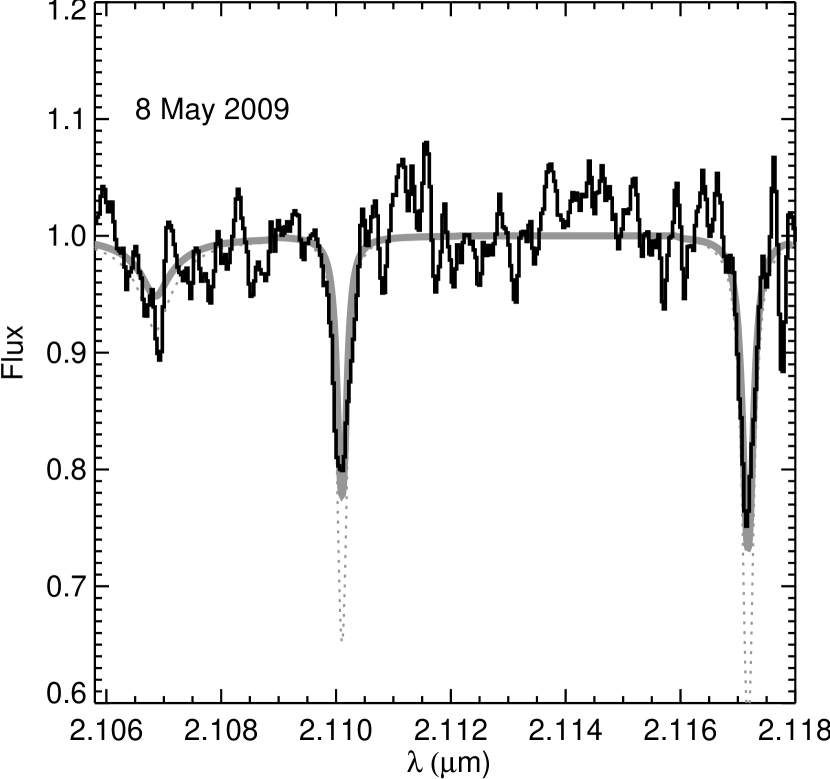
We estimate continuum veiling in the -band using Mg and Al lines near 2.11 m. These lines are found in a spectral region relatively free of telluric lines (unlike, for instance, the CO ro-vibrational bandheads), and have been used in past studies for veiling measurements of young stars (e.g., Doppmann et al. 2005; Eisner et al. 2007).
The basic method we use to estimate veiling is to compare the observed spectrum to a synthetic spectrum for a stellar photospheric model. We first determine oscillator strengths for the Mg and Al transitions by comparing synthetic Nextgen spectra for a solar-type star to observed solar spectra. Synthetic spectra relevant for TW Hya are then computed using stellar parameters determined from previous high dispersion optical spectroscopy (Yang et al. 2005): K, , [M/H], and km s-1. The previously derived value of is smaller than the velocity resolution of our data. We rotationally broaden the synthetic spectra by km s-1, which is the convolution of the true ( km s-1) and the instrumental resolution ( km s-1). Finally, we add continuum veiling to these rotationally broadened synthetic spectra and find the veiling value that provides the best match between observed and synthetic data. Fitted veilings are and in January and May, respectively. The two measurements are thus consistent within the 1- statistical errors.
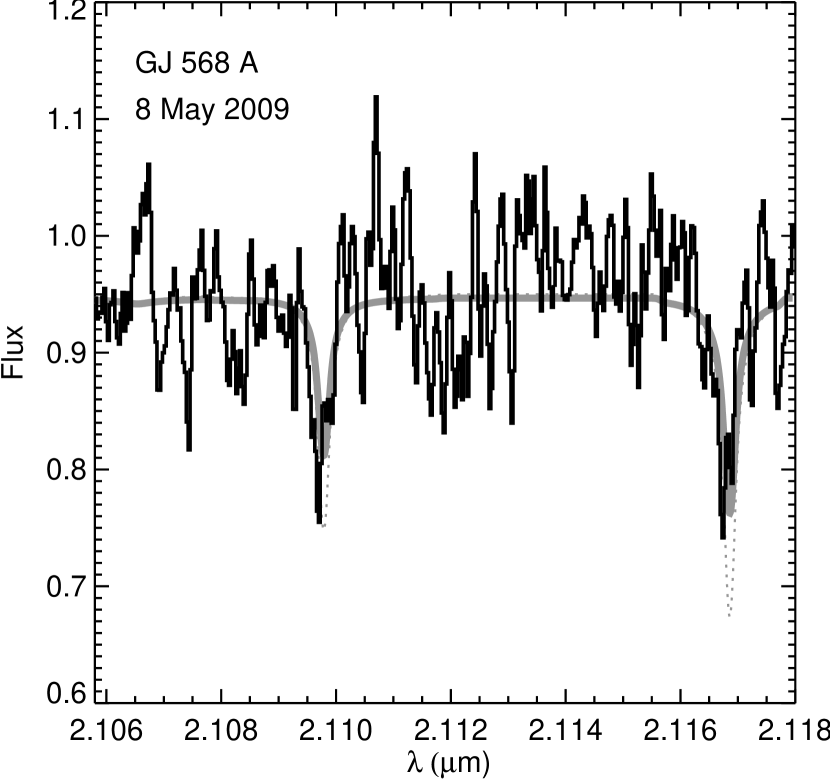
Doppmann et al. (2005) used this procedure to derive veilings from NIRSPEC data. They tested the method with observations of unveiled MK standard stars, and found that a correction was needed to produce zero veilings for these stars. They suggested that scattered light inside the NIRSPEC instrument may have led to an instrumental veiling contribution. Since the ARIES spectrograph has not been characterized in this way, we need to test for such systematic effects. Using our observed spectrum of GJ 568, which is an unveiled M3V main-sequence star (Gray et al. 2003), we can constrain any possible instrumental veiling. We estimate the veiling for GJ 568 using the procedure described above with K, , and km s-1 (Figure 3). We find .
If we assume that the instrumental veiling is independent of spectral type, at least across the M3 to K7 range, then we can use the derived veiling for GJ 568 A to correct the veilings inferred for TW Hya. The corrected veilings for TW Hya are and in January and May, respectively. The inferred veilings in the two epochs are consistent with each other and with with a previous measurement by Johns-Krull & Valenti (2001).
4 Discussion
4.1 Inner Disk Variability
The variation in Br emission line-strength between our two observed epochs, and between previous measurements in the literature, suggests that the rate at which gas is being accreted by the central star is changing with time. However, the amount of dusty material in the inner disk does not appear to change significantly, based on the inferred veilings. Our measured photometry is consistent with the 2MASS magnitude, providing further evidence that the amount of matter in the inner disk of TW Hya is not changing substantially with time.
4.2 Disk Clearing Mechanisms
Several mechanisms for creating the optically thin clearing in the TW Hya disk have been proffered (e.g., Najita et al. 2010), including planets, which may clear gaps about their orbits (Calvet et al. 2002); photoevaporation of inner disk material (e.g., Alexander et al. 2006; Owen et al. 2010); or grain growth, which would deplete the population of small grains that would produce the near-IR emission. The accretion rates measured here are difficult to reconcile with EUV-driven photoevaporation scenarios (Alexander et al. 2006), although not necessarily with EUV+X-ray-driven photoevaporation models (Owen et al. 2010). The sharp edge of the TW Hya disk (e.g., Calvet et al. 2002; Hughes et al. 2007) seems to argue against grain growth.
While a planetary explanation may be favored, it too is problematic since the massive outer disk of TW Hya should cause rapid migration and destruction of planet-mass objects unless the disk is unusually inviscid (e.g., Eisner et al. 2006). While a 10 Jupiter-mass planet has been claimed to orbit TW Hya at 0.04 AU (Setiawan et al. 2008), this would not dynamically effect the outer disk edge at AU. Moreover, follow-up observations demonstrate that the claimed planetary signal is more likely due to starspot noise (Huélamo et al. 2008).
Any of the mechanisms discussed above are compatible with time-variable accretion. Time-variable accretion in the outer disk–for example, due to changes in MRI turbulence–can lead to a larger flow of material through the inner disk, even if the flow is impeded by a planet or photoevaporation. In fact, the inner disk accretion rate can vary indpendently since it too may be driven by MRI turbulence (Chiang & Murray-Clay 2007).
While our data indicate a changing accretion rate with time, the low veilings observed at both epochs indicate a small and nearly constant amount of dust in the optically thin region. A constant dust content with time is also compatible with the unchanging -band magnitude inferred from our data.
In fact, the lack of optically thick dust in the inner disk–at any observed epoch–is surprising if one makes a simple estimate of the disk column density. For this calculation, we assume and . We take the disk scale height to be a constant fraction of the radius, . The pressure in the disk is thus .
For the accretion rates derived here ( M⊙ yr-1), and assuming a viscous disk with , we derive a disk surface density at AU of
| (1) |
and a disk density of
| (2) |
If we assume (appropriate for sub-micron-sized dust; see, e.g., Miyake & Nakagawa 1993), and take a gas-to-dust ratio of 100, then the vertical optical depth of the disk at 1 AU is
| (3) |
Even for accretion rates lower by an order of magnitude, such as those inferred in previous studied (Section 1), for this simple, viscous disk calculation.
To explain the lack of dust in the inner disk, we propose three possible scenarios, all of which may operate in the TW Hya system. The first is that the density could be over-estimated. An –disk may not be the correct description for the inner disk of TW Hya, or a higher value of may be appropriate. A gas-to-dust ratio could also help to maintain a higher accretion rate with a smaller column of dusty material. However, observations suggest that the gas-to-dust ratio in TW Hya–at least as measured in the outer disk–may be substantially smaller than 100 (Thi et al. 2010).
The second possible explanation is dust-filtering, where the pressure gradient at the inner edge of the optically-thick disk leads to super-Keplerian velocities, and hence trapping, of dust particles in a certain particle-size range (e.g., Rice et al. 2006). By preventing dust from reaching the inner disk, filtering can maintain an optically thin region. Moreover, even if the gas flow through the inner disk varies, filtering may trap (some of) the additional dust particles in the flow, preventing variations in observed veiling.
Finally, radiation pressure from the star can help to drive dust particles out of the inner disk. Alone, this mechanism is unlikely to clear out the inner disk or TW Hya, since an optically thick disk can be replenished by accretion faster than material can be blown out (e.g., Takeuchi & Lin 2003). However, if the inner disk is optically thin to begin with, for example due to dust filtering, then radiation pressure acts directly on all dust in the system and can be an efficient means of removal (e.g., Takeuchi & Artymowicz 2001; Eisner et al. 2006).
Radiation pressure and dust filtering act in a complementary way. Dust filtering is most efficient for particles with sizes of tens of microns, since these are not too well coupled to the gas but don’t have the inertia of larger bodies (Rice et al. 2006). Radiation pressure is most effective for smaller particles, with sizes m (e.g., Weidenschilling 1977). Thus, small particles that pass through the “filter” into the inner disk may be pushed back out by radiation pressure. The combination of filtering and radiation pressure may be sufficiently efficient to maintain an inner disk virtually devoid of dust even during periods of enhanced gaseous accretion.
References
- Alencar & Batalha (2002) Alencar, S. H. P. & Batalha, C. 2002, ApJ, 571, 378
- Alexander et al. (2006) Alexander, R. D., Clarke, C. J., & Pringle, J. E. 2006, MNRAS, 369, 216
- Calvet et al. (2002) Calvet, N., D’Alessio, P., Hartmann, L., Wilner, D., Walsh, A., & Sitko, M. 2002, ApJ, 568, 1008
- Chiang & Murray-Clay (2007) Chiang, E. & Murray-Clay, R. 2007, Nature Physics, 3, 604
- Doppmann et al. (2005) Doppmann, G. W., Greene, T. P., Covey, K. R., & Lada, C. J. 2005, AJ, 130, 1145
- Eisner et al. (2006) Eisner, J. A., Chiang, E. I., & Hillenbrand, L. A. 2006, ApJ, 637, L133
- Eisner et al. (2007) Eisner, J. A., Hillenbrand, L. A., White, R. J., Bloom, J. S., Akeson, R. L., & Blake, C. H. 2007, ApJ, 669, 1072
- Gray et al. (2003) Gray, R. O., Corbally, C. J., Garrison, R. F., McFadden, M. T., & Robinson, P. E. 2003, AJ, 126, 2048
- Hartmann et al. (1994) Hartmann, L., Hewett, R., & Calvet, N. 1994, ApJ, 426, 669
- Hawley & Pettersen (1991) Hawley, S. L., & Pettersen, B. R. 1991, ApJ, 378, 725
- Herczeg & Hillenbrand (2008) Herczeg, G. J. & Hillenbrand, L. A. 2008, ApJ, 681, 594
- Herczeg et al. (2004) Herczeg, G. J., Wood, B. E., Linsky, J. L., Valenti, J. A., & Johns-Krull, C. M. 2004, ApJ, 607, 369
- Hilton et al. (2010) Hilton, E.J., West, A.A., Hawley, S.L., & Kowalski, A.F. 2010, AJ, submitted
- Huélamo et al. (2008) Huélamo, N., et al. 2008, A&A, 489, L9
- Hughes et al. (2007) Hughes, A. M., Wilner, D. J., Calvet, N., D’Alessio, P., Claussen, M. J., & Hogerheijde, M. R. 2007, ApJ, 664, 536
- Johns-Krull & Valenti (2001) Johns-Krull, C. M. & Valenti, J. A. 2001, ApJ, 561, 1060
- Kastner et al. (2002) Kastner, J. H., Huenemoerder, D. P., Schulz, N. S., Canizares, C. R., & Weintraub, D. A. 2002, ApJ, 567, 434
- Massey et al. (1992) Massey, P., Valdes, F., & Barnes, J. 1992, A Users Guide to Reducing Slit Spectra with IRAF, National Optical Astronomy Observatory
- Matthews et al. (2007) Matthews, B. C., Kalas, P. G., & Wyatt, M. C. 2007, ApJ, 663, 1103
- Miyake & Nakagawa (1993) Miyake, K. & Nakagawa, Y. 1993, Icarus, 106, 20
- Muzerolle et al. (2000) Muzerolle, J., Calvet, N., Briceño, C., Hartmann, L., & Hillenbrand, L. 2000, ApJ, 535, L47
- Muzerolle et al. (1998) Muzerolle, J., Hartmann, L., & Calvet, N. 1998, AJ, 116, 2965
- Najita et al. (1996) Najita, J., Carr, J. S., & Tokunaga, A. T. 1996, ApJ, 456, 292
- Najita et al. (2007) Najita, J. R., Carr, J. S., Glassgold, A. E., & Valenti, J. A. 2007, in Protostars and Planets V, B. Reipurth, D. Jewitt, and K. Keil (eds.), University of Arizona Press, Tucson, 951 pp., 2007., p.507-522, ed. B. Reipurth, D. Jewitt, & K. Keil, 507–522
- Najita et al. (2010) Najita, J. R., Carr, J. S., Strom, S. E., Watson, D. M., Pascucci, I., Hollenbach, D., Gorti, U., & Keller, L. 2010, ApJ, 712, 274
- Neuhäuser et al. (2000) Neuhäuser, R., Brandner, W., Eckart, A., Guenther, E., Alves, J., Ott, T., Huélamo, N., & Fernández, M. 2000, A&A, 354, L9
- Owen et al. (2010) Owen, J. E., Ercolano, B., Clarke, C. J., & Alexander, R. D. 2010, MNRAS, 401, 1415
- Pontoppidan et al. (2008) Pontoppidan, K. M., Blake, G. A., van Dishoeck, E. F., Smette, A., Ireland, M. J., & Brown, J. 2008, ApJ, 684, 1323
- Qi et al. (2004) Qi, C., Ho, P. T. P., Wilner, D. J., Takakuwa, S., Hirano, N., Ohashi, N., Bourke, T. L., Zhang, Q., Blake, G. A., Hogerheijde, M., Saito, M., Choi, M., & Yang, J. 2004, ApJ, 616, L11
- Ratzka et al. (2007) Ratzka, T., Leinert, C., Henning, T., Bouwman, J., Dullemond, C. P., & Jaffe, W. 2007, A&A, 471, 173
- Rettig et al. (2004) Rettig, T. W., Haywood, J., Simon, T., Brittain, S. D., & Gibb, E. 2004, ApJ, 616, L163
- Rice et al. (2006) Rice, W. K. M., Armitage, P. J., Wood, K., & Lodato, G. 2006, MNRAS, 373, 1619
- Rothman et al. (2005) Rothman, L. S., Jacquemart, D., Barbe, A., Benner, D. C., Birk, M., Brown, L. R., Carleer, M. R., Chackerian, C., Chance, K., Coudert, L. H., Dana, V., Devi, V. M., Flaud, J. M., Gamache, R. R., Goldman, A., Hartmann, J. M., Jucks, K. W., Maki, A. G., Mandin, J. Y., Massie, S. T., Orphal, J., Perrin, A., Rinsland, C. P., Smith, M. A. H., Tennyson, J., Tolchenov, R. N., Toth, R. A., Vander Auwera, J., Varanasi, P., & Wagner, G. 2005, Journal of Quantitative Spectroscopy and Radiative Transfer, 96, 139
- Salyk et al. (2007) Salyk, C., Blake, G. A., Boogert, A. C. A., & Brown, J. M. 2007, ApJ, 655, L105
- Salyk et al. (2009) —. 2009, ApJ, 699, 330
- Setiawan et al. (2008) Setiawan, J., Henning, T., Launhardt, R., Müller, A., Weise, P., Kürster, M. 2008, Nature, 451, 38
- Sitko et al. (2000) Sitko, M. L., Lynch, D. K., & Russell, R. W. 2000, AJ, 120, 2609
- Stelzer & Schmitt (2004) Stelzer, B. & Schmitt, J. H. M. M. 2004, A&A, 418, 687
- Takeuchi & Artymowicz (2001) Takeuchi, T. & Artymowicz, P. 2001, ApJ, 557, 990
- Takeuchi & Lin (2003) Takeuchi, T. & Lin, D. N. C. 2003, ApJ, 593, 524
- Thi et al. (2010) Thi, W.-F., et al. 2010, A&A, 518, L125
- Uchida et al. (2004) Uchida, K. I., Calvet, N., Hartmann, L., Kemper, F., Forrest, W. J., Watson, D. M., D’Alessio, P., Chen, C. H., Furlan, E., Sargent, B., Brandl, B. R., Herter, T. L., Morris, P., Myers, P. C., Najita, J., Sloan, G. C., Barry, D. J., Green, J., Keller, L. D., & Hall, P. 2004, ApJS, 154, 439
- Valenti et al. (2000) Valenti, J. A., Johns-Krull, C. M., & Linsky, J. L. 2000, ApJS, 129, 399
- Webb et al. (1999) Webb, R. A., Zuckerman, B., Platais, I., Patience, J., White, R. J., Schwartz, M. J., & McCarthy, C. 1999, ApJ, 512, L63
- Weidenschilling (1977) Weidenschilling, S. J. 1977, MNRAS, 180, 57
- White & Basri (2003) White, R. J., & Basri, G. 2003, ApJ, 582, 1109
- Yang et al. (2005) Yang, H., Johns-Krull, C. M., & Valenti, J. A. 2005, ApJ, 635, 466
| Epoch | Br EW (Å) | LBrγ (L⊙) | Lacc (L⊙) | (M⊙ yr-1) | ||
|---|---|---|---|---|---|---|
| 17 Jan 2009 | ||||||
| 8 May 2009 |