Scaling between Structural Relaxation and Particle Caging in a Model Colloidal Gel
C. De Michele,∗a E. Del Gado, b and D. Leporinic
In polymers melts and supercooled liquids, the glassy dynamics is characterized by the rattling of monomers or particles in the cage formed by their neighbors. Recently, a direct correlation in such systems, described by a universal scaling form, has been established between the rattling amplitude and the structural relaxation time. In this paper we analyze the glassy dynamics emerging from the formation of a persistent network in a model colloidal gel at very low density. The structural relaxation time of the gel network is compared with the mean squared displacement at short times, corresponding to the localization length associated to the presence of energetic bonds. Interestingly, we find that the same type of scaling as for the dense glassy systems holds. Our findings well elucidate the strong coupling between the cooperative rearrangements of the gel network and the single particle localization in the structure. Our results further indicate that the scaling captures indeed fundamental physical elements of glassy dynamics.
1 Introduction
Understanding the extraordinary slow-down that accompanies systems with structural arrest like glass-forming systems 1, 2 and soft matter3, 4, 5, 6, 7, 8, 9 is a major scientific challenge. Crowding and caging effects play major roles in the glass transition (GT) of dense systems and lead to the strong localization of the particles in the cage formed by their neighbors: this is typically apparent in the time dependence of the particle mean square displacement (MSD) as a plateau-like regime.
The value of the MSD plateau yields the amplitude of the rattling motion inside the cage and hence the corresponding localization length.
Because of the extreme time-scale separation between the rattling motion () and the structural relaxation ( at GT), one would expect their complete independence. 00footnotetext: a Dipartimento di Fisica, “Sapienza” Università di Roma, P.le A. Moro 2, Roma, I-00185, Italy, Fax:+3906463158, Tel: +390649913524, E-mail: cristiano.demichele@roma1.infn.it 00footnotetext: b ETH Zürich, Department of Civil Engineering, Microstructure and Rheology, CH-8093, Zürich, Switzerland, E-mail: delgado@ethz.ch 00footnotetext: c IPCF-CNR and Dipartimento di Fisica “E. Fermi”, Università di Pisa, Largo B.Pontecorvo 3, Pisa, I-56127, Italy, E-mail: leporini@df.unipi.it
Nonetheless, there are several hints of the presence of correlations and several authors have investigated them10, 11, 12, 13, 14, 15, 16, 17, 18, 19, 20, 21, 22, 23, 24, 25, 26, 27, 28, 29. In particular, it has been recently shown that the structural relaxation time and the rattling amplitude of several numerical models, including linear polymers, mixtures, prototypical glassformers like and o-terphenyl (OTP), and one icosahedral glassformer 25, 26, 27, can be related in a unique scaling form.
Remarkably, the same resulting master curve well fits to the experimental data from van der Waals and associating liquids, polymers, metallic glasses, ionic liquids and network glassformers over many decades in time 25, 26, 27, 28. These results well elucidate how, in an impressively large class of systems, the glassy structural arrest corresponds to the onset of a strong coupling between the overall relaxation, characterized by cooperative and heterogeneous processes, and the average localization at the level of a single particle, strongly suggesting that this is a universal, fundamental feature of this type of dynamics.
Structural arrest and glassy dynamics can be observed also in very dilute particle suspensions when gelation occurs and displays significant hints of caging effects even at rather low volume fractions 30, 31, 32, 33, 34, 35, 36, 37, 38, 39. In these cases, differently from the dense glass-forming systems just mentioned, most of the times the caging has been associated to the particle bonding, rather than to the role of excluded volume interactions 40, 41, 42. In these systems, particles get bonded into an interconnected network structure which is responsible for the onset of cooperative, slow dynamics and eventually structural arrest, i.e. gelation. It has been recently shown, in the numerical study of a model colloidal gel, that the gel network induces the same type of strong coupling in particle motion typically observed in dense glassy systems and that the glassy dynamics directly arises from the cooperative processes induced by the network 38. A distinctive feature of this type of systems is the presence of different localization processes, over different length scales, leading to a somewhat more complex scenario for structural arrest. Nevertheless, particle caging is also observed, albeit much weaker than in dense systems, and again over time scales which are well separated from the ones of structural relaxation. Intrigued by the similarities and differences in the glassy dynamics of dense glasses and low volume fraction gels, we have investigated the presence and nature of correlations between structural relaxation and particle localization in a model colloidal gel. In spite of the deep differences in the caging mechanism and onset of slow dynamics, we find that the same universal scaling, already found in dense glassy systems, between the structural relaxation time and holds 25, 26, 27, 28. In our view this finding points to the presence of a complex feedback between the overall slow structural relaxation and the single particle localization in dilute gels. At the same time, it further supports the idea that this scaling form captures a fundamental, universal feature of glassy structural arrest.
The paper is organized as follows. In Sec. 2 we recall the basics to derive the universal scaling form subsequently discussed, in Sec. 3 we briefly summarize the main features of the gel model as studied in Ref. 36, 37, 38 by molecular dynamics and of numerical simulations. In Sec. 4 we provide a simple protocol to test the universal scaling25 for the gel system studied here. Finally in Sec. 5 we draw the conclusions of our analysis.
2 Universal Scaling Form
On approaching the glass transition particles are longer and longer trapped into the cage formed by their neighbors. Caging phenomenon shows up as a plateau-like regime at short times in the MSD. The amplitude of the rattling motion during this caging regime, that occurs on very short time scales (e.g. picoseconds in molecular liquids), is the so-called Debye-Waller (DW) factor 16, 20 which is directly related to the short-time elastic properties of the system 22.
The DW factor is an experimentally accessible quantity 15 that can be also measured by using the incoherent intermediate scattering function (ISF), evaluating at the short times the height of the plateau which signals the cage effects (see Ref. 43). We note that as shown in 43 DW factor extracted from MSD and one defined from ISF are equivalent.
In spite of the fact that the DW factor is related to fast motion of particles occurring on time scales much shorter than the ones typical of structural relaxation, many studies evidence in glass forming liquids a possible relation between slow and fast degrees of freedom 10, 44, 45, 18, 46, 47, 48, 20, 15, 1, 49, 19, 50.
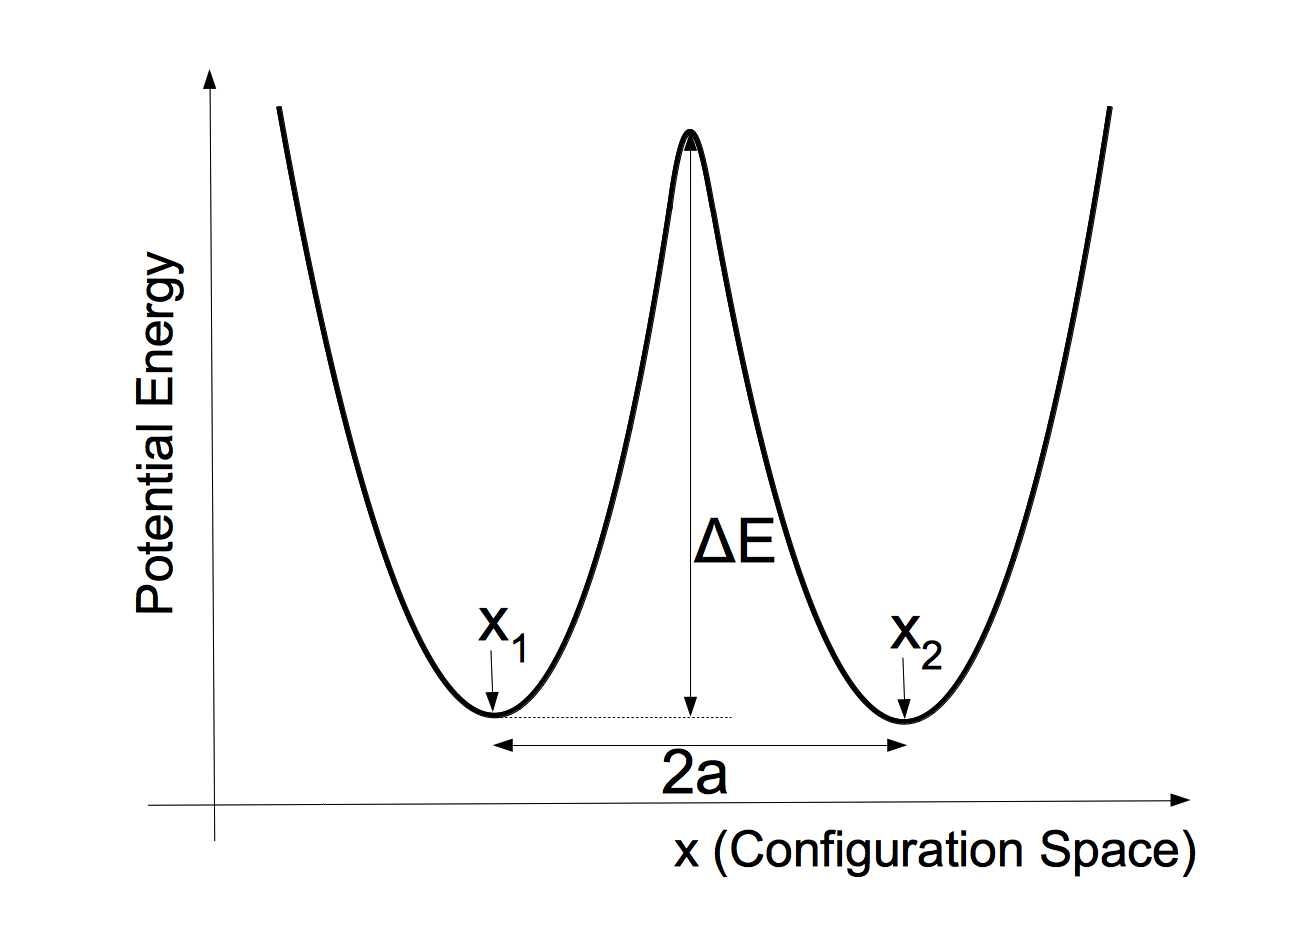
In order to express the correlation between DW factor and structural relaxation time in a functional form, a classical argument estimating the height of the barrier between two potential energy minima from the curvature around the minima can be used. For glassy systems Hall and Wolynes 13 applied this argument in their density functional theory where atomic motion is restricted to cells, picturing the GT as a freezing in an aperiodic crystal structure. In this approach system relaxation towards equilibrium can be thought as a series of activated jumps over energy barriers in its potential energy landscape 21. Following Ref. 21 we now give a derivation of an equation relating DW factor and structural relaxation, which is useful in the context of this paper.
For the sake of simplicity we restrict to the one-dimensional case where two minima are separated by a distance (see Fig. 1). Referring to Fig. 1, we expand the potential around the minimum on the left, whose position is labeled by :
| (1) |
Since system relaxation requires getting over the energy barrier , if is the system relaxation time and the microscopic time:
| (2) |
From Eq. (1) we can express as:
| (3) |
and from equipartition theorem:
| (4) |
where . Inserting Eqs. (4) and (3) into Eq. (2) one obtains finally:
| (5) |
It is important to note that Eq. (5) is expected to fail if the amplitude of rattling motion becomes comparable to .
A natural generalization of Eq.(5) can be achieved adopting a proper distribution of the squared displacement needed to overcome energy barriers, i.e. in our present study to break bonds. We note that the squared displacement is the cumulative displacement of the particles that move 13, hence according to Central Limit Theorem a suitable choice for is a truncated gaussian form, i.e.
| (6) |
where is a normalization factor and is the minimum displacement to reach the transition state. Averaging the Eq. (5) over the distribution given by Eq. (6), the following generalized HW equation is obtained:
| (7) |
The gaussian form for is supported also by other considerations. For example if we substitute back into Eq. (7) using Eq. (4) we end up with the following equation:
| (8) |
Experimental data for both supercooled liquids 51 and polymers 52 together with theoretical approaches 53 support gaussian form for in Eq. (8). Furthermore using Eq. (3) into Eq. (6) to eliminate a gaussian distribution for energy barriers is attained in accordance with other studies 54.
These ideas have been originally developed for the glassy dynamics of dense systems, where the caging occurs due to the high density. In the following we would like to try and apply them to the glassy dynamics of colloidal gels, where some hints of caging phenomena appear, although densities can be very low. The caging in these systems rather originates from the formation of persistent bonds 33, which eventually lead to an interconnected network structure.
3 Methods
3.1 Model
We refer to the studies carried on in Refs.36, 37, 38: the colloidal gel model considers identical particles of diameter interacting via a phenomenological potential , designed to account for the presence of directional interactions. In gelling colloidal suspensions there are in fact several possible sources of anisotropic effective interactions, since the particle surface may not be smooth or the building blocks of the gel are not the primary particles but larger aggregates of irregular shape 55. Confocal microscopy images obtained in recent experiments 56, 57, 58 confirm this scenario: the distribution of the particle coordination number in very diluted gel networks is strongly peaked around . In the chosen model, therefore, the interaction potential is given as the sum of three different contributions, , where is a Lennard-Jones type of potential producing a narrow attractive well, and contains directionality and rigidity of inter-particle bonding 38. Here we consider the same choice of parameters as in 36, 37, 38 and the range of volume fractions as investigated in 38.
As reported in the previous studies, in this model at low temperatures the system aggregates into an open persistent network of chains connected by a few bridging points (nodes). This takes place via a random percolation mechanism, but once a percolating structure is formed, it rapidly evolves towards a persistent, fully connected open network. The formation of the persistent network produces the coexistence, in the gel, of very different relaxation processes at different length scales: the relaxation at high wave vectors is due to the fast cooperative motion of pieces of the gel structure (e.g. the chains connecting two nodes), whereas at low wave vectors the overall rearrangements of the heterogeneous gel make the system relax via a stretched exponential decay of the time correlators. The coexistence of such diverse relaxation mechanisms is characterized by a typical crossover length which is of the order of the network mesh size. The slow glassy dynamics at low wave vectors results to be directly connected to the presence of cooperative processes which can be recognized, for example, in the rearrangements of the network nodes along the complex structure of the network itself 38. This scenario is in agreement with the results of other recent studies on model colloidal gels 59, 60.
3.2 Simulations details
We have used a MD code where the potential has been implemented via a suitable combination of the algorithms RATTLE and SHAKE 61. The unit of time is , with the mass of a particle and the data reported here refer to a time step of . The data refers to micro-canonical simulations performed with 8000 particles in cubic boxes of size in unit of , corresponding respectively to particle densities of , , and , i.e. to approximately volume fractions , , and . In the simulations 5 to 8 independent samples have been equilibrated starting from initial high temperature random configurations by replacing particle velocities with values extracted from a Maxwell-Boltzmann distribution every time steps (where varied with temperature from to MD steps). After equilibration the energy is constant, showing no significant drift over the simulation time window, and different one- and two- time autocorrelation functions display the equilibrium behavior, i.e. do not show any sign of aging. The data production starts from these equilibrated samples: the equilibration time grows with the relaxation time in the system and at the lowest temperatures equilibration required up to MD steps.
4 Results and Discussion
4.1 Relaxation and Transport Properties
We use the static structure factor , defined as follows:
| (9) |
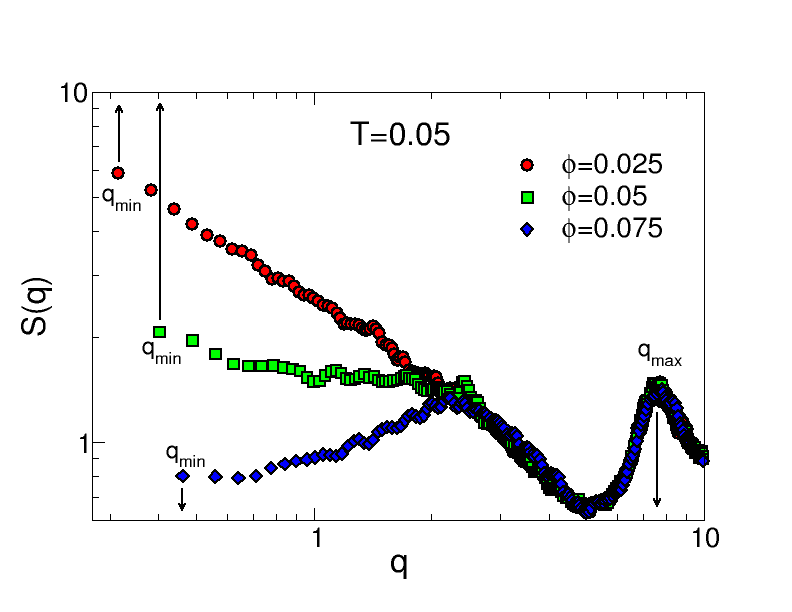
to quantify the extent of spatial correlation in the system and obtain informations on the gel structure. In Fig. 2 (from the data of Ref.38) of the gel network (i.e. at the lowest temperature considered) displays a peak around corresponding roughly to the particle diameter. This peak basically arises from excluded volume interactions between particles, i.e. it approximately corresponds to the first peak of radial distribution function. In glassy systems the slow relaxation arises first, and has its strongest signature, at these wave vectors. It is clear from the figure that in the gel significant spatial correlations are present also at smaller wave vectors. In Ref.38 has been compared to the static structure factor of a polymer chain solution62: length scales matching smaller wave vectors can interpreted as an intra-molecular regime for spatial correlations of the aggregates (i.e. chains). Mesoscopic and macroscopic length scales can be instead thought of as corresponding to inter-molecular regime, due to the long-range interactions induced by the formation of the persistent gel network. Correlations in the particle motion over different length scales can be effectively quantified in terms of ISF:
| (10) |
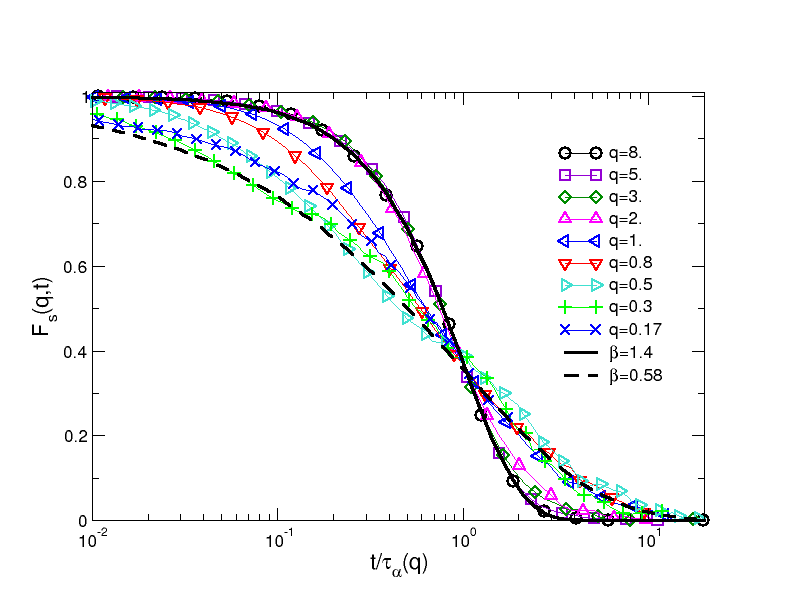
The analysis of its behavior 36, 37, 38 indicates that in the gel the slowest modes correspond to the inter-molecular regime of wave vectors. In Fig. 3 is plotted as a function of the time, rescaled by the relaxation time , at the lowest temperature for different wave vectors. has been calculated from . The figure well shows that the stretched exponential decay with typical of glassy dynamics, arises only at low wave vectors (). In other words, the slow structural relaxation modes of the gel structure can be detected only at low . In contrast, at higher wave vectors, the time decay of correlations is faster than exponential (): in Refs.37, 63 these processes have been carefully analyzed and it has been shown that they are due to fast coherent motion of pieces of the gel network (i.e. the chains between two bridging point or nodes).
The overall scenario of relaxation modes in the gel is therefore rather different from the one discussed in 25, 43 for glassy systems at high densities. It is interesting to notice that here the particle bonding is the basic ingredient of the structural arrest, since the persistence of the gel network certainly relies upon the long living bonds. On the other hand, the analysis of the relaxation modes well elucidate that formation of single bonds cannot be responsible, on its own, for the cooperative glassy dynamics which instead arises from the long-range correlations between them induced by the network 38.
Within this picture, the question of the existence and nature of a direct correlation between the single particle average localization and the structural arrest, as discussed in Sec.4.2, becomes particularly intriguing and is the main focus of this work.
To this aim, we have calculated the relaxation time associated to the structural relaxation of the gel as , where is the smallest wave vector compatible with periodic boundary conditions in our simulations boxes, i.e. it corresponds to length scales of the order of the box size.
For evaluating the rattling amplitude of the particle motion corresponding to caging, we consider the MSD:
| (11) |
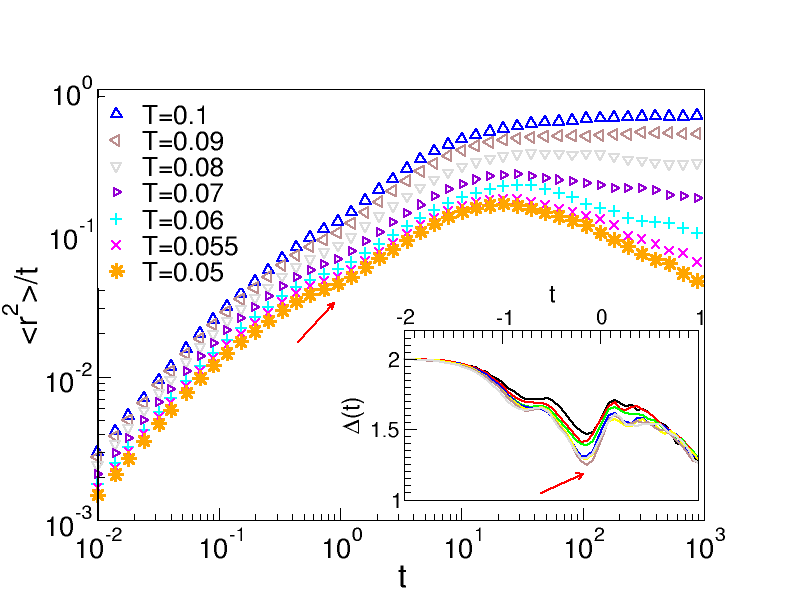
Figure 4 shows MSD divided by time for all temperatures at volume fraction (from Ref.36). Since the system is very diluted, localization phenomena can be very weak and this type of plot helps to better recognize different regimes. At very short times a ballistic regime is found where MSD increases according to (i.e.). Formation of bonds with other particles slows down the displacement and shows an inflection point. At high temperatures, bonds break within a time interval much smaller than and particle starts diffusing, i.e. eventually reaches a plateau. At bond lifetime sets instead the longest relaxation time-scale in the system and in this regime the formation of the gel network starts, with the MSD becoming increasingly sub-diffusive over times much longer than the localization process related to the rattling of the particle within the bonding length scale. Therefore we evaluate the caging from this first localization process as explained in the following.
4.2 Scaling between relaxation and caged dynamics
Following the discussion in Ref.43, we evaluate the DW factor in our gel system in order to provide a suitable characteristic length scale for the particle temporarily trapped into the cage due to bonds formation. DW factor can be defined picking a suitable value of MSD within a time window that begins just after ballistic regime and that ends just before structural relaxation sets in. First we have to identify such time window and to do that we consider the slope of MSD in a log-log plot, i.e.:
| (12) |
Representative plots of for our gel system can be found in the inset of Fig. 4. The short-time ballistic regime corresponds to while the long time diffusive regime corresponds to . Between these two regimes an intermediate regime is present where caging of particles due to bonds gives rise to a clear minimum of (see Fig. 4). We thus define the DW factor as follows:
| (13) |
where is the time corresponding to the minimum of within this intermediate regime.
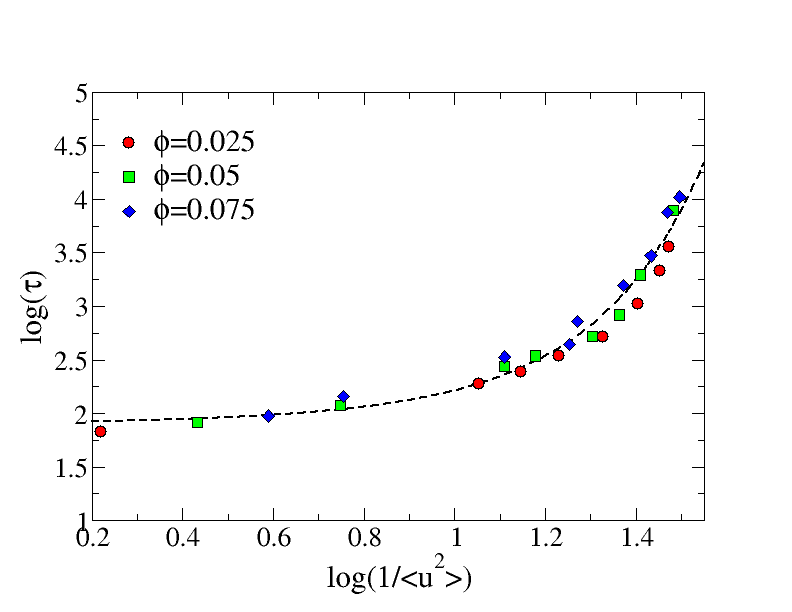
We are now in a position to establish a correlation between structural relaxation and caged dynamics. In Fig. 5 is plotted against the inverse of DW factor for the three volume fractions investigated. The figure clearly shows that is strongly correlated to the DW factor. The correlation has also a specific form (see the fitting curve in the figure) well agreeing with the prediction of Eq. (7). This is far from being obvious because here the structural relaxation is related to length scales of the order of simulation box (i.e. ) whereas the DW factor corresponds to caging phenomena occurring on much smaller length scales of the order of first neighbor distance, i.e. (see Fig. 2), where the relaxation is rather dominated by other mechanisms (see Fig.3). It is also remarkable that the all data for different volume fractions collapse onto the same scaling curve, because the structure, as described by spatial correlations in Fig.2, changes significantly with at small ( increases in fact by almost an order of magnitude from to ), whereas it is not affected by changes in at large wave vectors .
The correlation between DW factor and structural relaxation time points to a strong correlation between the long-range correlations established by the network and the localization within the structure at the level of the single particle.
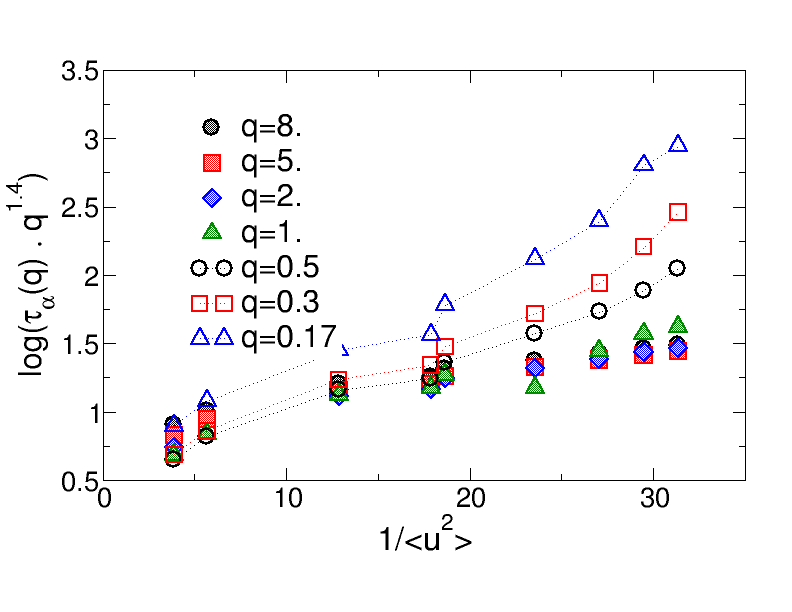
To better elucidate the nature of the scaling found, we have also investigated the existence of correlations at different wave vectors. In the gel network, displays a complex dependence on as discussed in Refs.37, 38. In particular, at large , corresponding to the regime where relaxation is dominated by fast collective motion of pieces of the structures (i.e. chains between two nodes). Therefore in Fig.6 we have used the same type of plot as in Fig.5 where has been rescaled with . The data refer to different at . At the largest the data well collapse on top of each other and display a very different dependence on . Upon decreasing the data depart from the scaling in and also approach the scaling form of Fig.5. This analysis further demonstrate that the scaling found specifically relates the average localization at the level of the single particle (as quantified by ) to the relaxation modes associated to the arising of glassy, cooperative dynamics.
4.2.1 Comparison with other MD Studies
In Ref. 43 it has been shown that for several model glassformers and experimental systems plotting versus (where is the DW factor at the GT) all data scale onto the same master curve, i.e.:
| (14) |
where:
| (15) | |||||
| (16) | |||||
| (17) |
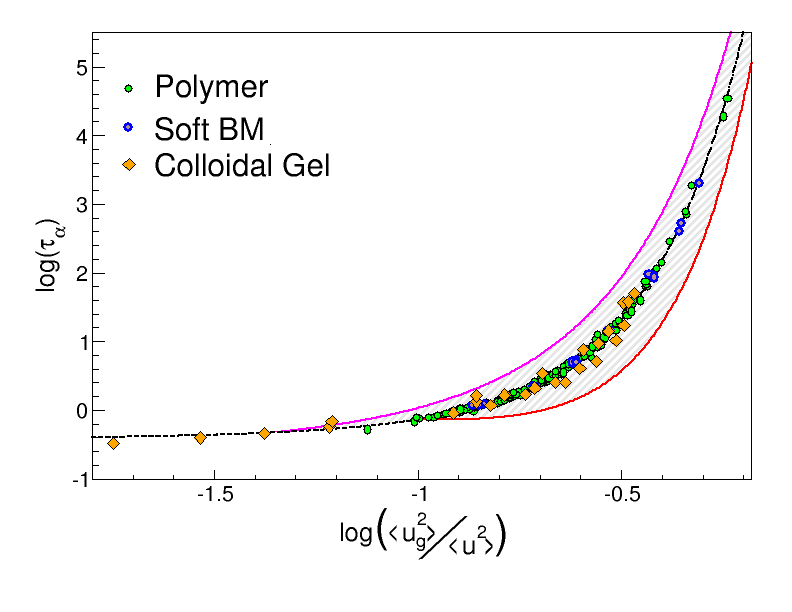
The scaling form obtained in Fig. 5 for the colloidal gel can in fact be superimposed on the universal curve of Eq. (14) with a suitable vertical shift () and upon using on -axis the scaled variable with in order to rule out any trivial dependence on time and length scales. Using such vertical shift and such value for to adjust gel data we can compare them to the results obtained from soft binary mixtures 43 and polymer systems 25 as shown in Fig.7. It is clear from this figure that within the accuracy (marked by solid lines) the scaling procedure works well also for the colloidal gel model considered in the present paper.
5 Conclusions
We have investigated possible correlations between the localization at the level of the single particle and structural relaxation in a model colloidal gel at very low volume fractions, with directional effective interactions and local rigidity. We have found that strong correlations are present over different length scales. In this type of systems, the localization of particles due to persistent bonding is of course the initiator of the process that leads to gelation, but cannot be responsible, on its own, for structural arrest, which arises thanks to the formation, eventually, of an interconnected network structure. Remarkably, we have found that relaxation modes at the lowest wave vectors, i.e. over length scale much larger than the bond localization length, strongly correlate to the localization of single particles within the typical bonding length. We think that these findings indicate a type of feedback mechanism between dynamical processes at different length-scales: particle bonding leads to the network formation and long range correlations induced by the presence of the network actually transforms the particle bonding into a glassy caging, coupling eventually the particle localization to the glassy structural arrest. Moreover, we have shown that the gel data display the same scaling form found for a large class of dense glassy systems in experiments and simulations (molecular glasses, polymers, etc. ): this result strongly suggests that the scaling captures the essential, basic ingredients in the physics of glassy structural arrest and it is an extremely powerful tool for devising its possible universal features.
6 Acknowledgments
CDM acknowledges support from ERC (226207-PATCHYCOLLOIDS).
References
- Angell 1995 C. A. Angell, Science, 1995, 267, 1924–1935.
- Debenedetti and Stillinger 2001 P. G. Debenedetti and F. H. Stillinger, Nature, 2001, 410, 259–267.
- Frenkel 2002 D. Frenkel, Science, 2002, 296, 65.
- Pham et al. 2002 K. N. Pham, A. M. Puertas, J. Bergenholz, A. M. S. U. Egelhaaf, P. Pusey, A. B. Schofield, M. Cates, M. Fuchs and W. Poon, Science, 2002, 296, 5565.
- Anyfantakis et al. 2009 M. Anyfantakis, A. Bourlinos, D. Vlassopoulos, G. Fytas, E. Giannelis and S. K. Kumar, Soft Matter, 2009, 5, 4256.
- Ramos and Cipelletti 2005 L. Ramos and L. Cipelletti, Journal of Physics: Condensed Matter, 2005, 17, R253.
- S. M. Fielding and Sollich 2009 M. C. S. M. Fielding and P. Sollich, Soft Matter, 2009, 5, 2378.
- Zaccarelli 2007 E. Zaccarelli, J. Phys.: Condens. Matter, 2007, 19, 323101.
- Likos 2001 C. N. Likos, Physics Reports, 2001, 348, 267 – 439.
- Tobolsky et al. 1943 A. Tobolsky, R. E. Powell and H. Eyring, Frontiers in Chemistry, New York, 1943, pp. 125–190.
- Angell 1968 C. A. Angell, J. Am. Chem. Soc., 1968, 86, 117–124.
- S.V.Nemilov 1968 S.V.Nemilov, Russ. J. Phys. Chem., 1968, 42, 726–729.
- Hall and Wolynes 1987 R. W. Hall and P. G. Wolynes, J. Chem. Phys., 1987, 86, 2943–2948.
- Buchenau and Zorn 1992 U. Buchenau and R. Zorn, Europhys. Lett., 1992, 18, 523–528.
- Ngai 2000 K. L. Ngai, J. Non-Cryst. Solids, 2000, 275, 7–51.
- Starr et al. 2002 F. Starr, S. Sastry, J. F. Douglas and S. Glotzer, Phys. Rev. Lett., 2002, 89, 125501.
- Novikov and Sokolov 2003 V. N. Novikov and A. P. Sokolov, Phys.Rev.E, 2003, 67, 031507.
- Scopigno et al. 2003 T. Scopigno, G. Ruocco, F. Sette and G. Monaco, Science, 2003, 302, 849–852.
- Novikov and Sokolov 2004 V. N. Novikov and A. P. Sokolov, Nature, 2004, 431, 961–963.
- Ngai 2004 K. L. Ngai, Phil. Mag., 2004, 84, 1341–1353.
- Dyre and Olsen 2004 J. C. Dyre and N. B. Olsen, Phys. Rev. E, 2004, 69, 042501.
- Dyre 2006 J. C. Dyre, Rev. Mod. Phys., 2006, 78, 953–972.
- Widmer-Cooper et al. 2008 A. Widmer-Cooper, H. Perry, P. Harrowell and D. R. Reichman, Nat. Phys., 2008, 4, 711–715.
- Yannopoulos and Johari 2006 S. N. Yannopoulos and G. P. Johari, Nature, 2006, 442, E7–E8.
- Larini et al. 2008 L. Larini, A. Ottochian, C. De Michele and D. Leporini, Nat. Phys., 2008, 4, 42–45.
- Ottochian et al. 2009 A. Ottochian, C. De Michele and D. Leporini, J. Chem. Phys., 2009, 131, 224517.
- 27 A. Ottochian and D. Leporini, J. Non-Cryst. Solids, DOI: 10.1016/j.jnoncrysol.2010.05.094.
- Ottochian and Leporini 2010 A. Ottochian and D. Leporini, Phil. Mag., in press.
- Ottochian et al. 2008 A. Ottochian, C. De Michele and D. Leporini, Phil. Mag., 2008, 88, 4057–4062.
- Gado et al. 2004 E. D. Gado, A. Fierro, L. de Arcangelis and A. Coniglio, Phys. Rev. E, 2004, 69, 051103.
- Cates et al. 2004 M. E. Cates, K. K. M. Fuchs, W. Poon and A. Puertas, J. Phys.: Condensed Matter, 2004, 16, S4861.
- Puertas et al. 2005 A. Puertas, M. Fuchs and M. Cates, J. Phys. Chemistry B, 2005, 109, 6666.
- De Michele et al. 2006 C. De Michele, S. Gabrielli, P. Tartaglia and F. Sciortino, J. Phys. Chem. B, 2006, 110, 8064.
- De Michele et al. 2006 C. De Michele, P. Tartaglia and F. Sciortino, J. Chem. Phys., 2006, 125, 204710.
- Zaccarelli et al. 2006 E. Zaccarelli, I. Saika-Voivod, S. V. Buldyrev, A. J. Moreno, P. Tartaglia and F. Sciortino, J. Chem. Phys., 2006, 124, 124908.
- Gado and Kob 2005 E. D. Gado and W. Kob, Europhysics Letters, 2005, 72, 1032.
- Gado and Kob 2007 E. D. Gado and W. Kob, Physical Review Letters, 2007, 98, 028303.
- Gado and Kob 2010 E. D. Gado and W. Kob, Soft Matter, 2010, 6, 1547.
- Foffi et al. 2005 G. Foffi, C. D. Michele, F. Sciortino and P. Tartaglia, J. Chem. Phys., 2005, 122, 224903.
- Gado et al. 2003 E. D. Gado, A. Fierro, L. de Arcangelis and A. Coniglio, Europhys. Lett., 2003, 63, 1.
- Puertas et al. 2002 A. Puertas, M. Fuchs and M. Cates, Phys. Rev. Lett., 2002, 88, 098301.
- Fierro et al. 2008 A. Fierro, E. D. Gado, A. de Candia and A. Coniglio, Journal of Statistical Mechanics-Theory and Experiment, 2008, L04002.
- Ottochian et al. 2009 A. Ottochian, C. De Michele and D. Leporini, J. Chem. Phys., 2009, 131, 224517.
- Widmer-Cooper and Harrowell 2006 A. Widmer-Cooper and P. Harrowell, Phys. Rev. Lett., 2006, 96, 185701(4).
- Glotzer and Vogel 2004 S. C. Glotzer and M. . Vogel, Phys. Rev. E, 2004, 70, 061504.
- Buchenau and Zorn 1992 U. Buchenau and R. Zorn, Europhys. Lett., 1992, 18, 523–528.
- Cornicchi et al. 2005 E. Cornicchi, G. Onori and A. Paciaroni, Phys. Rev. Lett., 2005, 95, 158104.
- Magazu‘ et al. 2004 S. Magazu‘, G. Maisano and F. Migliardo, J.Chem.Phys., 2004, 121, 8911–8915.
- Sokolov et al. 1993 A. P. Sokolov, E. Rössler, A. Kisliuk and D. Quitmann, Phys. Rev. Lett., 1993, 71, 2062–2065.
- Sciortino and Kob 2001 F. Sciortino and W. Kob, Phys. Rev. Lett., 2001, 86, 648–651.
- Bässler 1987 H. Bässler, Phys. Rev. Lett., 1987, 58, 767–770.
- Ferry et al. 1953 J. D. Ferry, L. D. J. Grandine and E. R. Fitzgerald, J. Appl. Phys., 1953, 24, 911–916.
- Garrahan and Chandler 2003 J. P. Garrahan and D. Chandler, Proc. Natl. Acad. Sci., 2003, 100, 9710.
- Monthus and Bouchaud 1996 C. Monthus and J.-P. Bouchaud, J. Phys. A: Math. Gen., 1996, 29, 3847–3869.
- Laurati et al. 2009 M. Laurati, G. Petekidis, N. Koumakis, F. Cardinaux, A. B. Schofield, J. M. Brader, M. Fuchs and S. U. Egelhaaf, J. Chem. Phys., 2009, 130, 134907.
- Dinsmore et al. 2006 A. D. Dinsmore, V. Prasad, I. Y. Wong and D. A. Weitz, Phys. Rev. Lett., 2006, 96, 185502.
- Dibble et al. 2008 C. J. Dibble, M. Kogan and M. J. Solomon, Phys. Rev. E, 2008, 77, 050401.
- Ohtsuka et al. 2008 T. Ohtsuka, C. P. Royall and H. Tanaka, Europhys. Lett., 2008, 84, 46002.
- Miller et al. 2009 M. A. Miller, R. Blaak, C. N. Lumb and J.-P. Hansen, J. Chem. Phys., 2009, 130, 114507.
- Saw et al. 2009 S. Saw, N. L. Ellegaard, W. Kob and S. Sastry, Phys. Rev. Lett., 2009, 103, 248305.
- Allen and Tildesley 1989 M. P. Allen and D. Tildesley, Computer simulation of liquids, Clarendon Press, Oxford, 1989.
- Rubinstein and Colby 2003 M. Rubinstein and R. H. Colby, Polymer Physics, Oxford University Press, Oxford, 2003.
- Gado and Kob 2008 E. D. Gado and W. Kob, Journal of Non-Newtonian Fluid Mechanics, 2008, 149, 28.