The Deep SPIRE HerMES Survey: Spectral Energy Distributions and their Astrophysical Indications at High Redshift111hermes.sussex.ac.uk
Abstract
The Spectral and Photometric Imaging Receiver (SPIRE) on Herschel has been carrying out deep extragalactic surveys, one of whose aims is to establish spectral energy distributions (SED)s of individual galaxies spanning the infrared/submillimeter (IR/SMM) wavelength region. We report observations of the (IR/SMM) emission from the Lockman North field (LN) and Great Observatories Origins Deep Survey field North (GOODS-N). Because galaxy images in the wavelength range covered by Herschel generally represent a blend with contributions from neighboring galaxies, we present sets of galaxies in each field especially free of blending at 250, 350, and 500 m. We identify the cumulative emission of these galaxies and the fraction of the far infrared cosmic background radiation they contribute. Our surveys reveal a number of highly luminous galaxies at redshift and a novel relationship between infrared and visible emission that shows a dependence on luminosity and redshift.
keywords:
IR galaxies: spectral energy distributions: galaxy luminosities1 Introduction
The Herschel Space Observatory (Pilbratt et al., 2010) has opened wide astronomical access to the far-infrared/submillimeter (FIR/SMM) spectral range. With the Spectral and Photometric Imaging Receiver (SPIRE) (Griffin et al., 2010), deep cosmological surveys are studying galaxies out to redshifts of order , reaching back to epochs when the Universe was only a few billion years old.
A primary motivation for these surveys, as well as those undertaken with the Photodetector Array Camera & Spectrometer (PACS) aboard Herschel, (Poglitsch et al., 2010) is to gain improved spectral energy distributions (SEDs) of astronomical sources. With an appropriate redshift, integration of the flux densities demarcated by the SEDs permits derivation of rest-frame luminosities, star-formation rates, and other physical properties of galaxies.
Among the first observations undertaken by SPIRE in the Herschel Multi-tiered Extragalactic Survey (HerMES222hermes.sussex.ac.uk) project (Oliver et al., 2010) have been surveys of galaxies in GOODS-N and Northern portions of the Lockman Hole (LN) field [see Oliver et al. (2010a) for a description of these early observations.] Source confusion, as defined and discussed in detail by Takeuchi, T. T. & Ishii, T. T. (2004), results in blending of far-infrared sources and complicates the analysis of survey data. In light of the large degree of source blending expected at SPIRE wavelengths, novel options for source extraction have been pursued [(Roseboom et al., 2010), (Smith et al., 2010), (Béthermin et al., 2010)]. Rather than looking for sources based on SPIRE intensity maps alone or relying on traditional source detection and extraction techniques for the SPIRE data, which are heavily affected by confusion, Roseboom et al. (2010) measure the SPIRE flux at the position of known 24 m sources using a linear inversion technique to account for source blending. The rationale for this is provided by the results of the Balloon-borne Large Aperture Submillimetre Telescope (BLAST) extragalactic survey (Marsden et al., 2009), which showed that the 24 m and the FIR flux densities are at least statistically correlated.
2 Primary Aims
The aims of this paper are twofold; our primary aim is to derive spectral energy distributions for distant galaxies observed by SPIRE. Before this can be achieved, however, a robust way of identifying sources least affected by confusion and blending must be devised.
The GOODS-N catalogue of Roseboom et al. (2010) provides a cross-identification (XID) of FIR/SMM flux density at 250, 350 and 500 m with 1951 possible 24 m counterparts having minimum flux densities of 20 Jy. Many of the identified 24 m galaxies are further cross-identified with ultraviolet, optical, near-infrared (NIR) and radio counterparts. The survey covered a arc minute strip, corresponding to 230 arcmin2
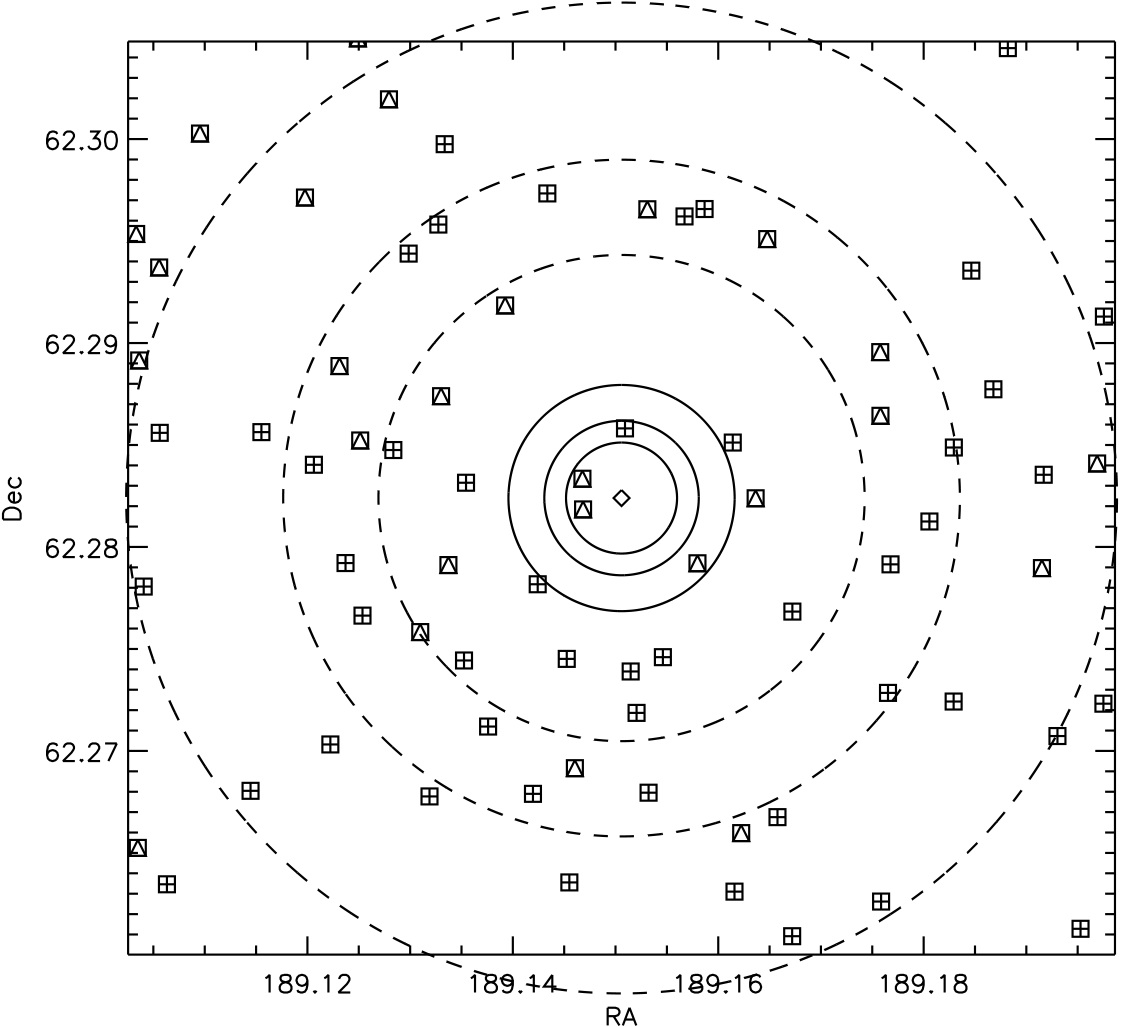
The SPIRE beam diameters at full-width-half maximum (FWHM) respectively measure 18.1, 25.2 and 36.9 arcsec at 250, 350 and 500 m. For present purposes, we take the beams to be close to circular; their ellipticity varies from pixel to pixel, but is approximately , the longer direction lying in the spacecraft horizontal direction, parallel to the ecliptic plane (Bernhard Schulz, private communication). The beam at 500 m thus has an area 0.3 arcmin2. With 1951 possible 24 m sources, we can expect a typical 500 m beam to contain 2.5 possible sources. At 250 m the crowding is a factor of 4 less severe, but still appreciable. An example of the crowded source distribution is seen in Figure 1 where the SPIRE beam outlines are overlaid on a patch of the GOODS-N field centered on a 24 m source.
In the Northern Lockman region, a 40.1’ 36.2’ segment of the sky yielded possible 24 m counterparts with minimum flux densities of 50 Jy in an area subtending 1500 arcmin2 — again corresponding to more than 1 potential 500 m source per beam. Identification of sources least affected by confusion and blending is therefore important. These sources have also been cross-identified at multiple wavelengths and assigned photometric redshifts as detailed in Strazzullo et al. (2010).
3 Data
11footnotetext: Herschel is an ESA space observatory with science instruments provided by European-led Principal Investigator consortia and with important participation from NASA.Using the existing high spatial resolution Spitzer 24 m data and the known far-infrared instrumental point response function (PRF) as inputs, Roseboom et al. (2010) determined best-fit 250, 350, and 500 m fluxes by a procedure they detail in their paper. In each SPIRE wavelength band, their tabulated cross-identifications provide both their best estimate of the flux density and the flux density in a PRF-convolved map centered on the position of an associated 24 m source. They make no assumptions about a proportionality between 24 m and FIR flux densities, but assume that SPIRE sources will only be detected at positions of 24 m sources. For each source, ancillary data at other wavelengths are included, as well as several flags that can be used to identify degenerate cases. Of particular importance is the redshift of the associated 24 m source, which enables derivation of rest-frame SEDs and thus source luminosities. Wherever we refer to and in the remainder of this paper these quantities are to be thought of as those defined by Roseboom et al. (2010).
The flux density in a PRF-convolved region centered on the position of the 24 m galaxy associated with each far-infrared source represents the system response not only to the flux density attributed to this source (referred to as ) but also to contributions from nearby sources. It thus provides a measure of blending characterizing each source. We define a purity index for each source as the ratio
| (1) |
where specifies the wavelength band, 250, 350, or 500 m, and , as supplied in the XID catalogs by Roseboom et al. 2010 is the PRF-smoothed flux density at the position of the source.333Our corresponds to the quantity in equation (2) of Roseboom et al. 2010, convolved with the point response function centered on the primary source whose flux is . The entries in the XID tables list our as , and our flux density as . A high value of indicates low confusion and blending in wavelength band ; a low value indicates high blending. The fractional contributions by ambient sources to the PRF-convolved flux density within a PRF is simply . In principle, the purity index must assume values . In practice, however, the value has been calculated on top of a locally determined background, whereas the values do not take a local background variation into account. This can result in when a negative local background or “baseline” has been used.
4 The Statistics of Purity Indices in GOODS-N and Lockman North
We have found it useful to identify sources whose purity indices respectively exceed measures of 0.7, 0.5, and 0.3 at 250, 350, and 500 m. We say that a source is secure at each wavelength if it meets this criterion. If the source is found to be secure in all three wavelength bands, we call it triply secure. High-purity sources are of special interest because their isolated nature makes them less susceptible to blending by neighbors. It is these sources which will be especially useful for follow up studies with other instruments and also may provide confirmation of the deblending approach used. It should be noted, however, that a flux density estimate from a highly pure source might still be inaccurate if there is significant contribution from an infrared source that is not observed at 24 m. Furthermore, sources with low purity do have well-defined deblending solutions and hence well-characterized flux densities and uncertainties from Roseboom et al. (2010). In crowded fields, the true flux density is very likely described by this characterization, although the margins of uncertainty tend to be large. Our choice of purity criteria is somewhat subjective but offers a reasonable compromise for extracting relatively reliable SEDs despite source blending. Understandably, these criteria may be expected to vary depending on the type of information an astronomer expects to extract from the survey data.
When a reliable redshift is available, the single most important quantity that can be determined from an SED is source luminosity. With this, one can begin discussing the luminosity distribution at specific redshifts, as well as luminosity evolution as a function of redshift, particularly among ultraluminous galaxies that emit the dominant fraction of their energy in the infrared. However, to obtain a reliable SED and thus a reliable luminosity, we require sources whose flux densities are well determined at all three SPIRE wavelengths in order to optimally constrain the flux density defining the broad wavelength region around peak emission.
To explain the consequences of our choice of purity criteria in this context, we may consider a toy model which, as pointed out in Section 1, will respectively exhibit an average number of sources , 1.225, and 0.625 per GOODS-N beam, at 500, 350, and 250 m. Let us inject an additional source into such a beam and call it the primary source. If all the sources involved are equally bright, on average, i.e., make equal contributions to the PRF-smoothed flux density, the purity of the primary source will be , i.e. 0.29, 0.45, and 0.62, respectively at 500, 350 and 250 m. Half the sources in each waveband will have purities higher than these purity cuts, and half lower.
Turning now to our preferred adoption of purity cuts of 0.3, 0.5 and 0.7 at 500, 350, and 250 m, we see that they assure two properties: (i) that they yield sources whose purities are above average at all three wavelengths, and (ii) that the fraction of sources with purity above the cut is roughly comparable at all three wavelengths — a balance, which is important to assure a well-defined SED. Table 1, described below, confirms these traits for the GOODS-N sample. It shows that a fraction of the sources has purity exceeding 0.7 at 250 m, a fraction 0.32 exceeding purity 0.5 at 350 m, and a fraction 0.36 exceeding purity 0.3 at 500 m. These fractions cluster around a value of 0.3, thus lending roughly equal weight to the flux density in each waveband in the determination of the SED.
In Table 1, we list the fraction of sources in GOODS-N and LN whose purity indices lie above certain cuts. We permit these indices to slightly exceed a value of one, with a cut-off of in GOODS-N and in LN. These relaxed upper limits are designed to allow the inclusion of detections with a significant local background which otherwise have all the earmarks of being secure.
In the GOODS-N region the XID catalog lists 183 sources observed at all three wavelengths and with known redshift, 16 of which are triply secure. If we remove the upper limit , the number of triply secure sources rises to 59. In LN there are 633 sources with detections at all five wavelengths with known redshift, 165 of which are triply secure; this number increases to 287 if we remove the upper limits on purity. Although the numbers of these galaxies are quite modest, they nevertheless yield informative statistics on the luminosities and luminosity distributions of galaxies observed out to redshifts . These will be discussed in Section 6.
| GOODS-N | |||||
|---|---|---|---|---|---|
| 1.1 | 0.9 | 0.7 | 0.5 | 0.3 | detections |
| 250 m | 0.106 | 0.231 | 0.348 | 0.493 | 1032 |
| 350 m | 0.069 | 0.199 | 0.316 | 0.451 | 697 |
| 500 m | 0.061 | 0.141 | 0.227 | 0.362 | 475 |
| LN | |||||
| 1.2 | 0.9 | 0.7 | 0.5 | 0.3 | detections |
| 250 m | 0.275 | 0.435 | 0.579 | 0.703 | 4646 |
| 350 m | 0.184 | 0.343 | 0.500 | 0.670 | 2968 |
| 500 m | 0.144 | 0.281 | 0.419 | 0.570 | 2127 |
The larger aperture of the Herschel telescope and the higher spatial resolution this enables have permitted the SPIRE surveys to reach depths beyond those attained by BLAST. Nevertheless, Marsden et al. (2009) succeeded in acquiring reliable measurements of stacked source flux densities at comparable wavelengths. Their results indicate surface brightnesses of 8.60 0.59, 4.93 0.34, and 2.27 0.20 nW m-2 sr-1 at 250, 350, and 500 m respectively. These stacked source flux densities represent the major component of the cosmic infrared background (CIB) measured by the Cosmic Background Explorer’s Far-Infrared Absolute Spectrometer (FIRAS) to be 10.4 2.3, 5.4 1.6, and 2.4 0.6 nW m-2 sr-1 at 250, 350, and 500 m respectively (Fixsen et al., 1998). To investigate the extent to which this background is resolved with Herschel, we summed the estimated flux densities for our secure SPIRE sources in the deepest field (GOODS-N) and then attributed this flux density to the entire survey region of 230 arcmin2. Using the flux densities for sources contained in the XID catalog of Roseboom et al. (2010), our cumulative surface brightness for GOODS-N at 250, 350, and 500 m is 1.49, 0.70, and 0.41 nW m-2 sr-1 or 14%, 13%, and 17% of the estimated CIB. At 250 and 350 m these values are within 1 of those corrected for blending and incompleteness by Oliver et al. (2010a).
5 Spectral Energy Distribution of the Secure Sources
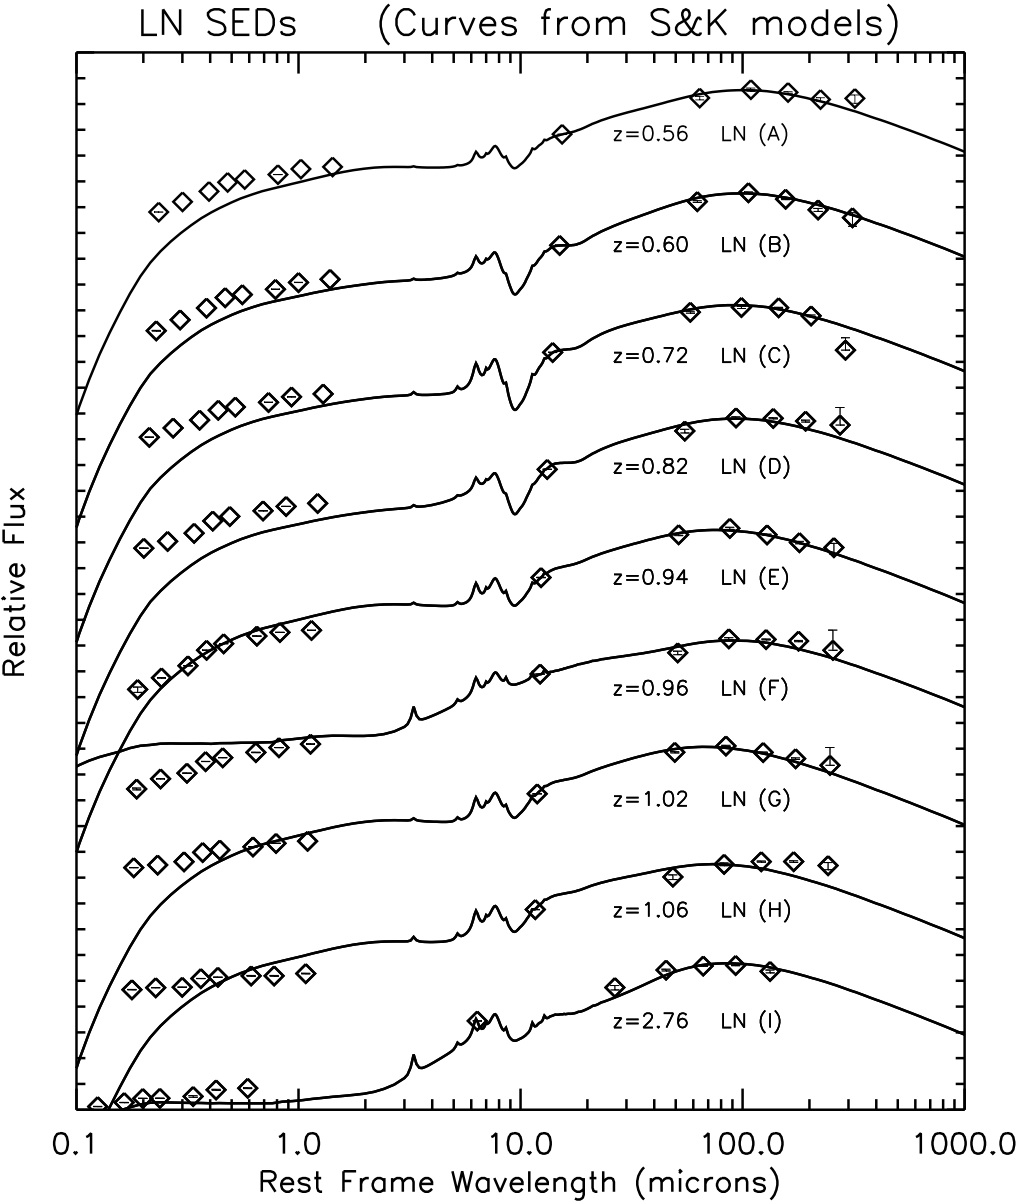
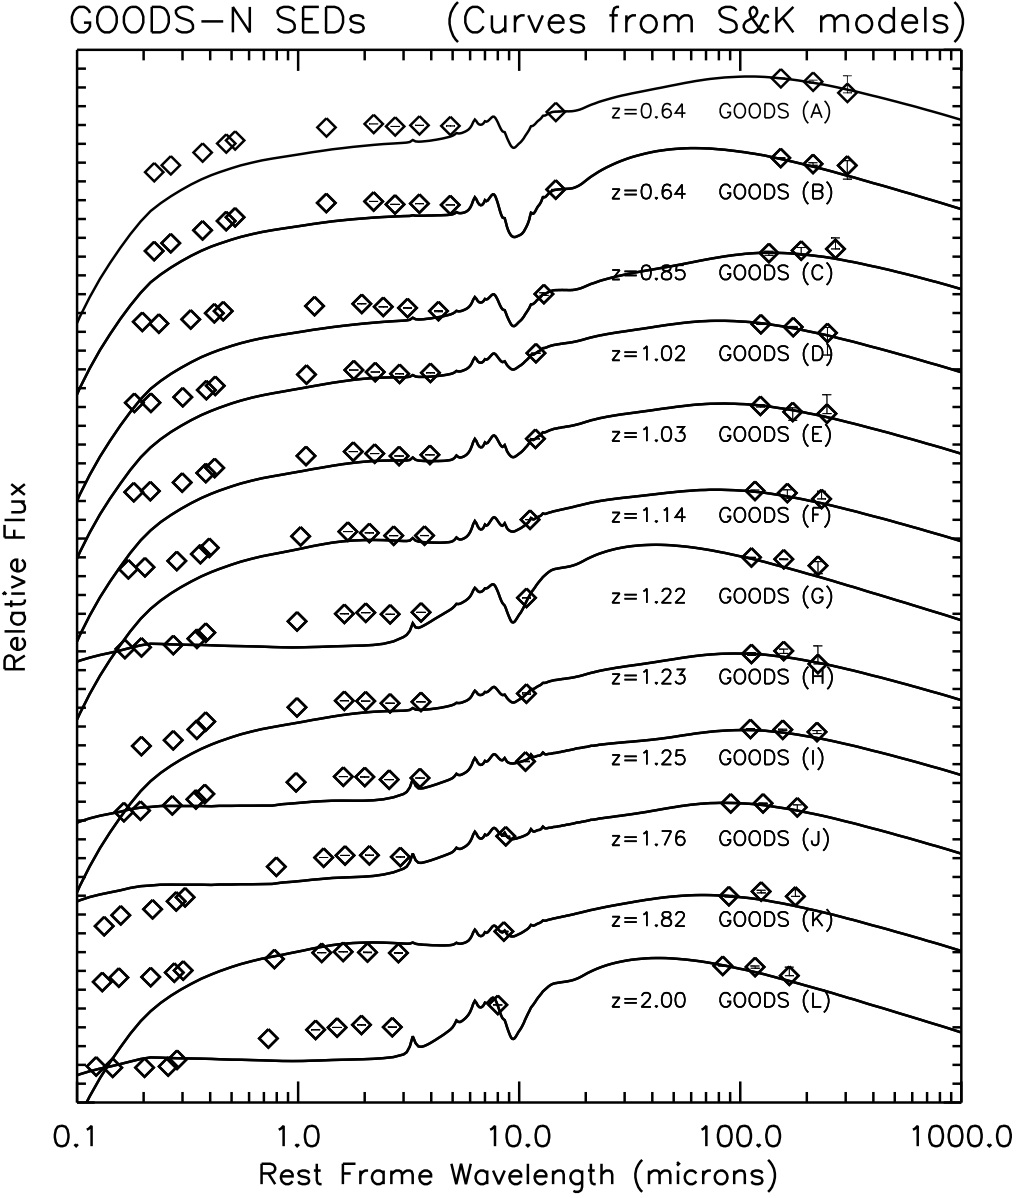
Figures 2 and 3 exhibit SEDs for triply secure sources in LN and GOODS-N. For LN sources, we have set an additional criterion for inclusion, namely that they have observed flux densities also at PACS wavelengths of 100 and 170 m. Along with examining the observed SED, we show a fit using starburst models developed by Siebenmorgen & Krügel (2007) (S&K). These models are based on a nuclear concentration of massive young stars embedded in a matrix of gas and dust referred to as “hot spots”. S&K use a five parameter SED fit which incorporates a variable nuclear bulge size with old and new stellar components as well as the effects of dust. They provide their models in the form of a library of 7000 SEDs available as text files online.444The S&K SED library of models is available at http://www.eso.org/rsiebenm/sb_models/. By using their models, we are able to not only find realistic intrinsic luminosities, but also star formation rates (SFR) for highly luminous sources at high redshift for which the Kennicut infrared - SFR relations apply (Kennicutt, 1998).
The S&K model fits observations quite well, although some of our SEDs exhibit considerable deviations from the data at visible and near infrared wavelengths. This is largely due to variable shielding of starlight by dust, see section 6 below.
In Figures 2 and 3, we have focused on high redshift (z0.5) sources as these are of greatest interest to star formation history. Tables 2 and 3 show the luminosities and star-formation rates of galaxies whose SEDs are shown in Figures 2 and 3. The models appear capable of correctly representing the galaxies we observe, most of which are highly luminous and likely to be starbursts. Like most current models, however, vastly different dust masses and nuclear sizes are able to yield similar SEDs, as witnessed by the large differences in dust masses assigned to some galaxies listed in Tables 2 and 3 that have nearly identical redshifts and luminosities. This is not surprising because the models are only required to provide sufficient dust to convert most of the visible and ultraviolet radiation produced in the starburst into infrared radiation at the observed temperature. If this criterion is satisfied, the models produce roughly correct SEDs.
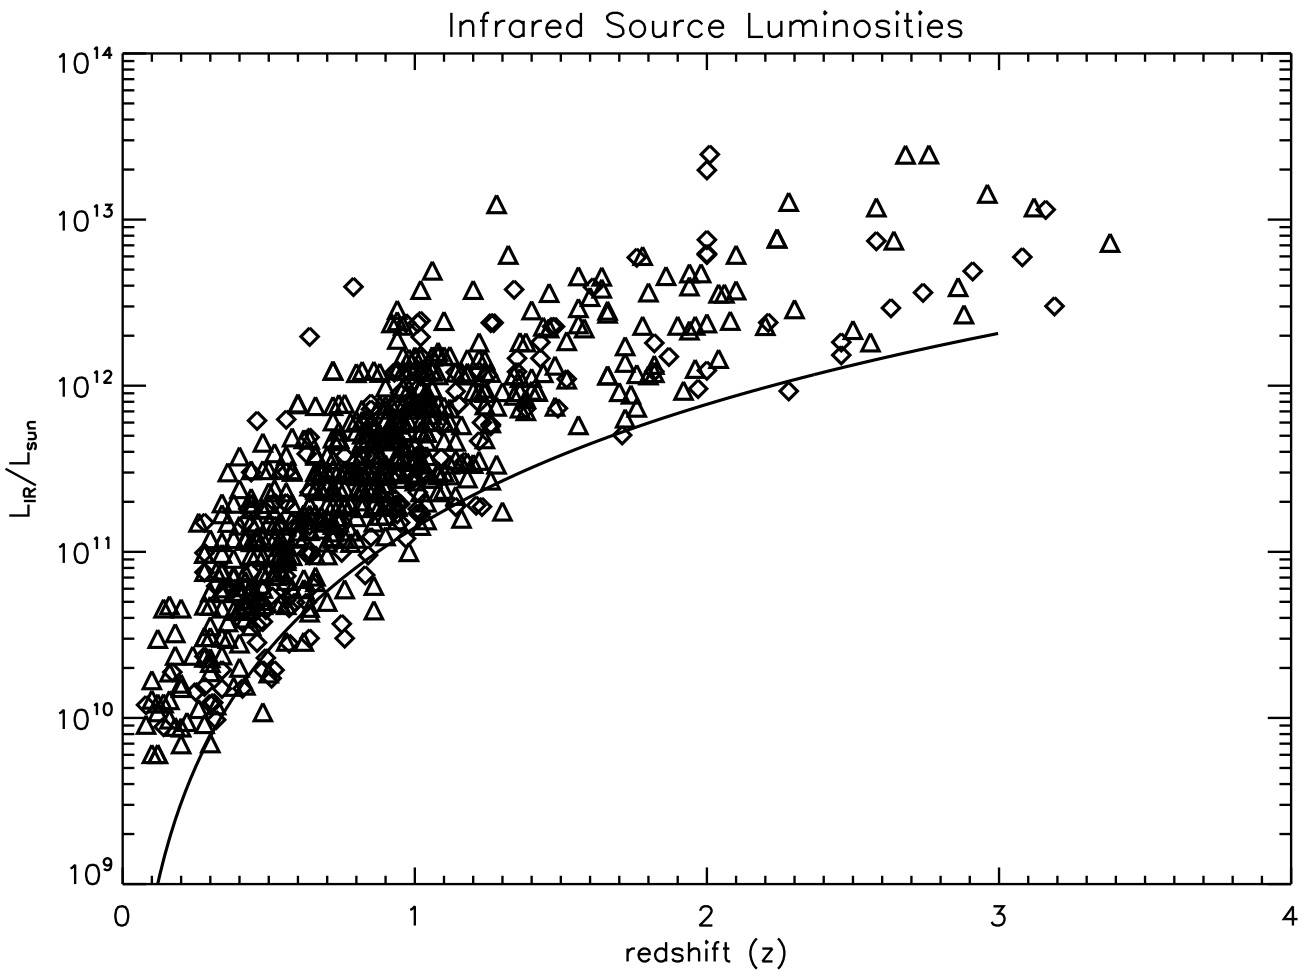
While these figures and tables emphasize the relatively few triply-secure SEDs among high redshift objects, it is important to note that for many statistical trends, triple-security is not necessary. In Figure 4, we show the luminosities we have determined as a function of redshift, based on the S&K models for all sources in GOODS-N and LN that have detections of any kind (secure or not) at all three SPIRE bands. While some of the flux densities, especially at 500 m, are quite uncertain (see Figures 2 and 3), this will not greatly affect the overall luminosity distribution. We estimate the source luminosity uncertainty to be 20%. The minimum detectable luminosities follow the expected trend of increasing with the square of luminosity distance (which we determined based on a , H km s-1 Mpc-1 cosmology).
Throughout this paper we refer to multiple luminosities, namely total bolometric luminosity and infrared luminosity integrated over 8 - 1000 m [as used in star formation estimates by Kennicutt (1998)]. For our purposes, the difference between the two is small as the majority of a luminous star-forming galaxy’s energy is emitted in the infrared. In galaxies with , Buat et al. (2010) find that 95% of the total star formation rate is accounted for by . Nonetheless, we explicitly differentiate between the two when the distinction is significant.
6 The Nature of the Ultraluminous Sources
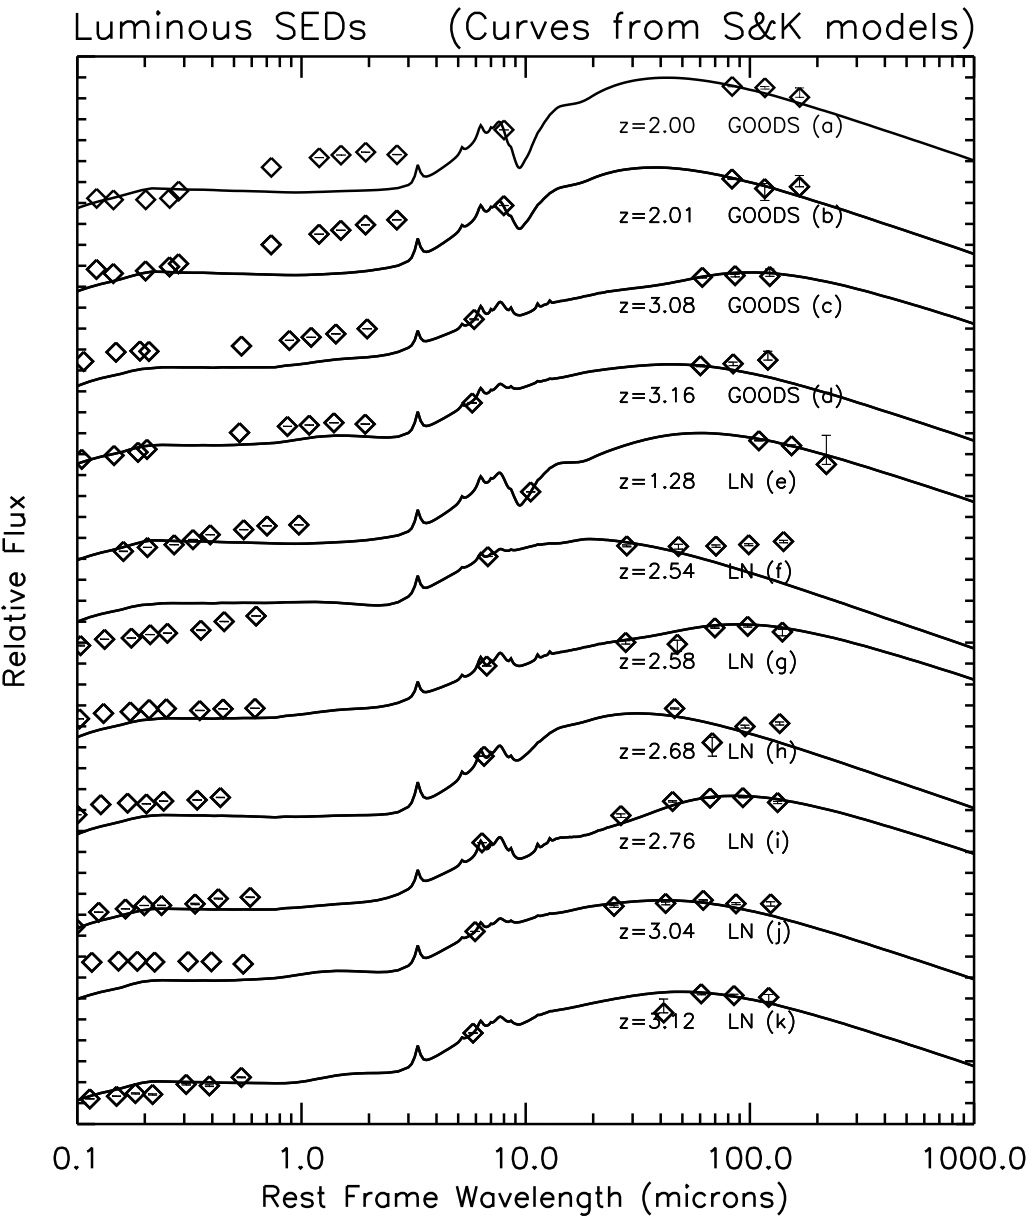
As Figure 4 attests, our surveys reveal a number of highly luminous sources, mainly at redshifts between and 3.2. Discussing all of these in detail is beyond the scope of the present paper, if for no other reason than that information on these sources is still quite modest. Nevertheless, we here discuss four of these sources to show that their luminosities appear to be intrinsic. Neither gravitational lensing nor blending from neighboring sources appear to contribute significantly to the observed luminosities. This may not be true of all of the luminous SPIRE sources, but it appears to be so for at least those about which we have the most information right now. A number of other uncertainties also warrant comment.
(i) For most of the sources observed in LN only photometric redshifts are available. For the more luminous sources shown, estimated redshift errors range from to 17% in the catalogs of Roseboom et al. (2010). Because calculated luminosities are proportional to , a 17% error at can lead to a luminosity error in the range of . For sources with established spectroscopic redshifts, the uncertainty is far smaller and can be neglected.
(ii) A second area of concern is discrimination between intrinsically luminous sources and sources that may be lensed by foreground galaxies to merely appear luminous. For some purposes, e.g. accounting for sources contributing to the diffuse background, this distinction may not be of primary importance; but for charting the luminosities of distant sources their intrinsic luminosities need to be determined.
(iii) Because our deep surveys are highly sensitive, they reveal a large number of faint sources. This leads to potential mis-identification of sources. It can also lead to blending. But seven of the eleven ultraluminous sources in Figure 5 and Table 4 are triply secure; the remaining four are doubly secure within observational uncertainties. Severe blending is thus unlikely.
(iv) For some of the sources, the available data points straddle but do not directly constrain the region where the SED reaches a maximum (see Figure 5), so that our SED-derived luminosities could be over-estimated.
At the present stage of data reduction we are not yet in a position to account for all these uncertainties. However, for the cited sources in GOODS-N and for a few of the sources in LN reliable spectroscopic redshifts are available. Among four of these we were able, below, to search for potential lensing, assess a degree of blending, and justify our confidence in their derived luminosities in some detail. These sources are referred to by letters corresponding to their designations in Table 4. Note that in Table 4 we give bolometric luminosities whereas below we quote infrared luminosities.
The LN source (j) at equatorial position (J2000.0) 161.554052 / 58.788592, is characterized in the Sloan Digital Sky Survey (SDSS) as a well-isolated circular source identified as a quasi-stellar object (QSO). The visible spectrum leaves no doubt about the redshift determined by the strong Ly- line. The visible continuum flux in this spectrum is erg cm-2 s-1 Å-1, equivalent to Jy, stretching down to Å, for a total flux of roughly W m-2, which is comparable to the infrared flux observed from the source. The IPAC extragalactic data base lists the optical source as brighter, by more than a magnitude, than any other source within a radius of an arc minute. Trouille et al. (2008) list a 0.5-2 keV X-ray flux of W m-2, and a 2-8keV flux of W m-2 for the source, jointly about 20 times lower than the visible flux. Owen & Morrison (2008) detected a 20-cm continuum radio flux density of 64 Jy from this source, within an apparent size arcsec FWHM, ruling out obvious ambient emission that might have indicated lensing. The XID catalogs of Roseboom et al. (2010) show a relatively weak neighboring SPIRE source at a distance of 26 arcsec, and a source comparable in infrared brightness to LN 4241 but at a separation of arcsec. Because of their relatively large displacement, these and other ambient galaxies are unlikely to contribute appreciably to the SPIRE flux densities assigned to LN (j) by Roseboom et al. (2010). All this gives confidence that both the visible and the infrared flux come from the same source, that there is no lens magnification, and that we are indeed dealing with an un-lensed ultraluminous source with infrared luminosity . The simplest explanation for these data is that we are viewing a QSO with a surrounding torus along a sightline coinciding with the torus axis. The visible light reaches us directly along this axis; the infrared emission comes from dust heated in part by the QSO and possibly also by massive star formation.
The GOODS-N source (c), with equatorial coordinates (J2000.0) 188.990097 / 62.17342, is cited by Barger et al. (2008) as having specroscopic redshift . The 24 m flux density listed in the Barger catalog is 109 Jy. The rest-frame 2-8keV luminosity assigned to this source by Trouille et al. (2008) is W , but their paper provides no rest-frame 0.5-2keV luminosity. The nearest SPIRE source listed in the XID catalogs lies at a distance of 35 arcsec, where its contribution to our primary galaxy’s flux listed in the XID catalog can at most be minor. Our primary source also displays weak X-ray fluxes, but Morrison et al. (2010) list no 20-cm source within 3.5 arcmin. Integrating the flux densities indicated by the fitted SED in Figure 5, leads to an infrared luminosity of .
One of our ultraluminous sources [LN (f)] has previously been discussed by Polletta et al. (2006). They observed the Lockman SWIRE source at (J2000.0) 161.041521 / 58.87355 with Chandra and detected a flux of erg cm-2 s-1 in the 0.3 - 8 keV range. The Spitzer 24 m flux is 4.0 mJy, strong for a source at spectroscopic redshift 2.54, and much brighter than anything within an arcminute of its location. Because of its initial detection by Spitzer, the authors characterize the source as an infrared selected Compton-thick AGN on the basis of the rest-frame hydrogen column density, which they estimate to be cm-2 with an uncertainty envelope extending a factor of three times lower and arbitrarily higher. The infrared luminosity derived on the basis of our SPIRE and PACS observations (see Figure 5 and Table 4) is . It appears to be fairly well isolated in the infrared, the nearest comparably bright 250 micron source being located half an arcminute away.
Some of these ultraluminous galaxies could be lensed but a first look has not yet revealed these in our sample. The GOODS-N source (d), with coordinates (J2000.0) 189.309509 / 62.20232, is cited by Barger et al. (2008) as having a spectroscopic redshift . Again, ambient nearby sources have relatively weak SPIRE fluxes unlikely to appreciably affect the SPIRE flux attributed to our source of primary interest. Another source only arcsec away is also noted in the NASA/IPAC Extragalactic Database (NED). This appears not to have a measured 24 m flux and is not listed by Barger et al. (2008). However, Law et al. (2007) have included this source in their discussion of distant irregular galaxies. The object designated as BX 150 appears elongated roughly along a north/south direction, is arcsec long with an aspect ratio roughly 2:1, and has a redshift . At optical wavelengths, it is 1.3 magnitudes fainter than the ultraluminous infrared source and, at its rather high displacement of arcsec, it is unlikely to provide significant lensing. With this proviso, the intrinsic infrared luminosity of GOODS (d) appears to be .
Figure 5 provides the SEDs of these ultraluminous sources. Our combined surveys of GOODS-N and LN cover square degrees, or one part in 85,000 of the sky. Given that we observe several high-luminosity sources in the small area covered, it suggests that approximately sources in the infrared luminosity range should be observable in the Universe, at redshifts to 3 at the current epoch. The number of comparably luminous sources observable at lower redshifts appears to sharply decline.
It is unlikely that three selection effects inherent in our observations cast this conclusion into serious doubt:
(i) The first is that Figure 4, on which the conclusion is based, only includes sources detected at all three SPIRE wavelengths. For highly redshifted sources, the 100 m infrared emission peak is redshifted into the 500 m range, favoring the detection of galaxies at all three wavelengths, including 500 m.
(ii) However, compensating for this effect, lower redshift sources are more readily detected by a factor inversely proportional to luminosity distance squared. Although these two effects partially cancel, high-luminosity sources should be more readily detected at low than at high redshifts.
(iii) The XID catalogs search for SPIRE sources solely at locations where Spitzer 24 m sources exhibit flux densities 20 Jy in the GOODS-N field and 50 Jy in LN. We may thus be missing sources at redshifts at which poorly emitting spectral regions are redshifted to m. At redshifts , for example, the 9.7 m silicate absorption dip shown by Spoon et al. (2007) to be prevalent in many ULIRGS is shifted to 24 m. This may account for the striking absence of low-luminosity sources, at , i.e. the lack of sources hugging the luminosity distance curve at this redshift in Figure 4.
7 Discussion
Far-infrared surveys with Herschel need to take source confusion and source blending into account, particularly at the longest wavelengths, 350 and 500 m. GOODS-N and LN are the two deepest surveys undertaken as part of the HerMES project to date. In these deep fields, crowding of sources presents especially serious problems. In establishing a set of criteria that assess source blending, we have taken a preliminary step toward estimating the utility of the survey data for different purposes. This has proven itself useful in our analysis of the ultraluminous galaxies, some of which we described in Section 6 and whose characteristics are exhibited in Figure 5 and Table 4. In view of the high infrared luminosities we find, it is particularly satisfying that seven of the eleven sources cited turn out to be triply secure, i.e. with high purities in all three SPIRE wave-bands, and that five of the sources also are observed by PACS where blending is not severe, particularly in the 100 m waveband. In this context, we have placed no upper limit on acceptable values of , which are especially high for GOODS(c) and LN(f), suggesting especially low ambient source contributions at their locations.
In compiling the SEDs for GOODS-N and LN, we have elected to work with the S&K models because they are based on a limited set of well-defined physical parameters. The models thus make predictions that our SEDs may be able to verify, refute, or extend. S&K do not specifically address the effects of adding an AGN component to a starburst model. However, they do provide a starburst fit for NGC 6240 and propose that addition of a small AGN component could provide an improved fit. Most starbursts generally also exhibit some AGN activity. Perhaps because of this, the S&K models appear to provide reasonable fits. The major weakness of the S&K models, as well as that of all others, tends to be the difficulty in accounting for the seemingly random relationship between the infrared and optical portions of the SEDs that is so apparent in Figures 2, 3, and 5.
We investigated the relationship between flux-density ratios at optical and far-infrared wavelengths in high- and low-luminosity galaxies. Current theory suggests that starbursts involve stellar mass distributions obeying the Salpeter initial mass function (Zinnecker & Yorke, 2007). The drop in luminosities from the most massive O type stars with mass to the early B type stars at 10 , can then be shown to be roughly in a ratio of 500:1, i.e. with a contrast considerably higher than that of the mass ratio, roughly 12:1. The highest mass ranges will thus be depleted most rapidly, ending their lives in supernova explosions in which at least some of the dust will be destroyed or expelled from the galaxy. The most luminous galaxies found using our SEDs and their associated redshifts would thus be expected to be the very youngest as well as those most densely shrouded by dust, i.e. having the lowest fractional optical luminosities. To test this hypothesis we restricted ourselves to galaxies with total bolometric luminosities, , as these have long been considered likely starburst mergers, albeit with potential contributions from AGNs (Sanders & Mirabel, 1996). In Table 5, we compare the flux density ratios for the most and least luminous sources in three redshift bins. It is evident that larger ratios correspond to more luminous sources at all redshifts but that these differences greatly diminish at lower redshifts. This finding is both new and significant. It indicates evolutionary trends that may need to be incorporated into more advanced models of starbursts designed to yield SEDs which not only mirror observed ratios of optical to infrared emission, but also define a galaxy’s place in its evolutionary history.
| z | N | |||
|---|---|---|---|---|
| 18 | 64500 | 72000 | 0.90 | |
| 18 | 62500 | 17600 | 3.6 | |
| 10 | 62300 | 5920 | 11 |
Figure 4 provides a capsule history of galaxy evolution over cosmological epochs for the sample included in our two deep surveys. The shapes of these distributions are nearly identical in LN and GOODS-N, which motivated us to plot both in the same figure. A glance confirms that sources having the highest luminosities are found at highest redshifts, i.e. earliest epochs. Luminosities higher than are generally observed at redshifts , the highest redshifts reached in our surveys.
8 Conclusions
Confusion, which can be troubling at 250 m, becomes increasingly severe at 350 and 500 m. Yet the data at these longer wavelengths are particularly important given how little is known about this spectral domain. We believe that the triply-secure sources listed in Tables 2, 3, and 4 will be in demand for follow-on studies that X-ray astronomers, spectroscopists, and others may wish to undertake on sources known to be especially free of confusion.
With SPIRE photometry data in hand along with cross identifications at several shorter wavelengths, we have constructed SEDs for a handful of trustworthy sources in the GOODS-N and LN regions. Many of these can be fit by starburst SED models, such as those created by Siebenmorgen & Krügel (2007), which yield information on luminosity, dust mass, and size. Figures 4 and 5 show a number of ultraluminous galaxies with . Although these are extreme systems, they do not appear to deviate from the general distribution at high redshift. A major strength of the deep HerMES surveys is their ability to obtain reliable source luminosities and star-formation rates based on flux densities in the infrared and at auxiliary wavelengths as well as redshifts compiled in the XID catalogues.
Acknowledgments
This work is based in part on observations made with Herschel, a European Space Agency Cornerstone Mission with significant participation by NASA. Support for this work was provided by NASA through an award issued by JPL/Caltech.
SPIRE has been developed by a consortium of institutes led by Cardiff University (UK) and including Univ. Lethbridge (Canada); NAOC (China); CEA, OAMP (France); IFSI, Univ. Padua (Italy); IAC (Spain); Stockholm Observatory (Sweden); Imperial College London, RAL, UCL-MSSL, UKATC, Univ. Sussex (UK); and Caltech/JPL, IPAC, Univ. Colorado (USA). This development has been supported by national funding agencies: CSA (Canada); NAOC (China); CEA, CNES, CNRS (France); ASI (Italy); MCINN (Spain); SNSB (Sweden); STFC (UK); and NASA (USA).
We thank the referee of this paper, Stephen J. Messenger, for his incisive comments and helpful recommendations.
References
- Barger et al. (2008) Barger, A.J., et al., 2008, ApJ, 689, 687
- Béthermin et al. (2010) Béthermin, M., et al., 2010, A&A,516, 43
- Buat et al. (2010) Buat V., et al., 2010, MNRAS, this issue
- Fixsen et al. (1998) Fixsen, D. J., et al., 1998, ApJ, 508, 123
- Griffin et al. (2010) Griffin, et al., 2010, A&A 518, L3
- Kennicutt (1998) Kennicutt, R., 1998, Ann. Rev. A&A, 36, 189
- Law et al. (2007) Law, D. R., et al., 2007, ApJ 656, 1
- Marsden et al. (2009) Marsden, G., et al., 2009, ApJ, 707, 1729
- Morrison et al. (2010) Morrison, G. E., et al., 2010, ApJS 188,178
- Oliver et al. (2010) Oliver, et al., 2010, A&A 518, L2
- Oliver et al. (2010a) Oliver, et al., 2010a, in preparation
- Owen & Morrison (2008) Owen, F. N. & Morrison, G. E., 2008, AJ 136,1889
- Pilbratt et al. (2010) Pilbratt, et al., 2010, A&A 518, L1
- Poglitsch et al. (2010) Poglitsch, et al., 2010, A&A 518, L2
- Polletta et al. (2006) Polletta, M., et al., 2006, ESASP 604, 807
- Roseboom et al. (2010) Roseboom I., et al., 2010, MNRAS, this issue
- Sanders & Mirabel (1996) Sanders, D. B. & Mirabel, I. F., 1996, ARA&A 1996, 34, 749
- Bernhard Schulz (private communication) Schulz B., 2010, private communication
- Siebenmorgen & Krügel (2007) Siebenmorgen R., Krügel E., 2007, A&A, 461, 445
- Smith et al. (2010) Smith A. J., et al., 2010, MNRAS, this issue
- Spoon et al. (2007) Spoon, H. W. W., et al., 2007, ApJ 654, L49
- Strazzullo et al. (2010) Strazzullo, V., et al., 2010, ApJ 714, 1305
- Takeuchi, T. T. & Ishii, T. T. (2004) Takeuchi, T. T. &Ishii, T. T., 2004, ApJ 604, 40
- Trouille et al. (2008) Trouille, L., et al., 2008, ApJS 179, 1
- Zinnecker & Yorke (2007) Zinnecker, H., & Yorke, H., 2007 Ann. Rev. A&A, 45, 481
| ID | RA | Dec | z | Lbolometric () | SFR (/yr) | Mdust () | Radius (kpc) | Av | Log10(ncm3) | ||||
|---|---|---|---|---|---|---|---|---|---|---|---|---|---|
| LN (A) | 161.8365 | 59.1211 | 0.56 | 4.0 | 66 | 1.6 | 0.89 | 0.67 | 0.74 | 3.0 | 35.9 | 3 | |
| LN (B) | 161.5001 | 58.8732 | 0.60 | 7.9 | 130 | 3.2 | 0.74 | 0.62 | 0.88 | 3.0 | 72.0 | 4 | |
| LN (C) | 161.1277 | 59.1956 | 0.72 | 1.3 | 210 | 3.2 | 1.10 | 1.00 | 1.07 | 3.0 | 72.0 | 2 | |
| LN (D) | 161.3232 | 59.2086 | 0.82 | 1.3 | 210 | 3.2 | 0.88 | 0.80 | 0.98 | 3.0 | 72.0 | 4 | |
| LN (E) | 161.0530 | 59.0762 | 0.94 | 2.0 | 330 | 1.6 | 0.92 | 0.65 | 0.69 | 3.0 | 35.9 | 3 | |
| LN (F) | 161.3680 | 59.2242 | 0.96 | 2.5 | 400 | 3.6 | 0.96 | 0.97 | 0.56 | 9.0 | 9.0 | 4 | |
| LN (G) | 161.3429 | 59.2269 | 1.02 | 4.0 | 650 | 1.6 | 0.89 | 0.87 | 0.64 | 3.0 | 35.9 | 2 | |
| LN (H) | 161.4871 | 58.8886 | 1.06 | 2.5 | 410 | 1.6 | 0.76 | 0.82 | 0.93 | 3.0 | 35.9 | 2 | |
| LN (I) | 161.8669 | 58.8708 | 2.76 | 2.5 | 4300 | 4.9 | 0.91 | 0.96 | 0.77 | 9.0 | 120.0 | 4 |
| ID | RA | Dec | z | Lbolometric () | SFR (/yr) | Mdust () | Radius (kpc) | Av | Log10(ncm3) | |||
|---|---|---|---|---|---|---|---|---|---|---|---|---|
| GOODS (A) | 189.0274 | 62.1643 | 0.6380 | 5.0 | 84 | 3.2 | 0.83 | 0.84 | 0.44 | 3.0 | 72.0 | 4 |
| GOODS (B) | 189.3938 | 62.2898 | 0.6402 | 2.0 | 340 | 6.0 | 0.98 | 0.64 | 0.90 | 1.0 | 119.0 | 2 |
| GOODS (C) | 189.2979 | 62.1820 | 0.8549 | 1.3 | 21 | 3.2 | 1.00 | 0.81 | 0.74 | 3.0 | 72.0 | 4 |
| GOODS (D) | 189.1403 | 62.1683 | 1.0160 | 1.6 | 260 | 1.6 | 0.99 | 0.75 | 0.54 | 3.0 | 35.9 | 3 |
| GOODS (E) | 189.0633 | 62.1691 | 1.0270 | 1.3 | 210 | 1.6 | 0.92 | 0.52 | 0.45 | 3.0 | 35.9 | 2 |
| GOODS (F) | 189.3171 | 62.3541 | 1.1440 | 1.0 | 160 | 8.1 | 0.73 | 0.68 | 0.68 | 3.0 | 17.9 | 2 |
| GOODS (G) | 189.1438 | 62.2114 | 1.2242 | 2.5 | 4300 | 6.0 | 0.88 | 0.89 | 0.98 | 1.0 | 119.0 | 4 |
| GOODS (H) | 189.2137 | 62.1810 | 1.2258 | 6.3 | 100 | 1.6 | 0.71 | 0.83 | 0.31 | 3.0 | 35.9 | 4 |
| GOODS (I) | 189.2614 | 62.2338 | 1.2480 | 1.3 | 200 | 3.6 | 0.98 | 0.93 | 0.97 | 9.0 | 9.0 | 4 |
| GOODS (J) | 189.2566 | 62.1962 | 1.7600 | 6.3 | 1000 | 7.3 | 1.02 | 1.04 | 1.03 | 9.0 | 18.0 | 4 |
| GOODS (K) | 189.3036 | 62.1955 | 1.8150 | 2.0 | 310 | 8.1 | 1.08 | 0.86 | 0.50 | 3.0 | 17.9 | 3.4 |
| GOODS (L) | 189.0764 | 62.2640 | 2.0000 | 2.0 | 3400 | 6.0 | 0.82 | 0.71 | 0.33 | 1.0 | 119.0 | 2 |
| ID | RA | Dec | z | Lbolometric () | SFR (/yr) | Mdust () | Radius (kpc) | Av | Log10(ncm3) | |||
|---|---|---|---|---|---|---|---|---|---|---|---|---|
| GOODS (a) | 189.0764 | 62.2640 | 2.0000 | 2.0 | 3400 | 6.0 | 0.82 | 0.71 | 0.33 | 1.0 | 119.0 | 2.0 |
| GOODS (b) | 189.1483 | 62.2400 | 2.0050 | 2.5 | 4200 | 3.6 | 0.69 | 0.24 | 0.38 | 1.0 | 71.0 | 2.0 |
| GOODS (c) | 188.9901 | 62.1734 | 3.0750 | 6.3 | 1000 | 2.0 | 1.61 | 1.22 | 0.84 | 15.0 | 18.0 | 4.0 |
| GOODS (d) | 189.3096 | 62.2024 | 3.1569 | 1.3 | 2000 | 4.0 | 0.57 | 0.55 | 0.84 | 3.0 | 9.0 | 2.0 |
| LN (e) | 161.7059 | 59.3247 | 1.28 | 1.3 | 2100 | 3.2 | 0.99 | 0.85 | 0.20 | 3.0 | 72.0 | 2.0 |
| LN (f) | 161.0415 | 58.8735 | 2.28 | 2.5 | 3400 | 4.1 | 0.98 | 1.10 | 1.71 | 0.3 | 6.7 | 2.0 |
| LN (g) | 161.5408 | 58.7950 | 2.58 | 1.3 | 2000 | 2.0 | 0.82 | 0.95 | 0.58 | 15.0 | 18.0 | 4.0 |
| LN (h) | 160.9635 | 58.9555 | 2.68 | 2.5 | 4300 | 8.8 | 0.18 | 0.95 | 0.96 | 0.3 | 144.0 | 2.0 |
| LN (i) | 161.8667 | 58.8704 | 2.76 | 2.5 | 4300 | 4.9 | 0.91 | 0.96 | 0.77 | 9.0 | 120.0 | 4.0 |
| LN (j) | 161.5541 | 58.7886 | 2.96 | 2.0 | 3100 | 4.0 | 0.76 | 0.61 | 0.60 | 3.0 | 9.0 | 3.0 |
| LN (k) | 161.8259 | 59.2771 | 3.12 | 1.3 | 2000 | 8.0 | 0.98 | 0.70 | 0.54 | 3.0 | 17.8 | 2.0 |