Optical Studies of Twenty Longer-Period Cataclysmic Binaries 111Based on observations obtained at the MDM Observatory, operated by Dartmouth College, Columbia University, Ohio State University, Ohio University, and the University of Michigan.
Abstract
We obtained time-series radial velocity spectroscopy of twenty cataclysmic variable stars, with the aim of determining orbital periods . All of the stars reported here prove to have h. For sixteen of the stars, these are the first available period determinations, and for the remaining four (V709 Cas, AF Cam, V1062 Tau, and RX J2133+51) we use new observations to improve the accuracy of previously-published periods. Most of the targets are dwarf novae, without notable idiosyncracies. Of the remainder, three (V709 Cas, V1062 Tau, and RX J2133+51) are intermediate polars (DQ Her stars); one (IPHAS 0345) is a secondary-dominated system without known outbursts, similar to LY UMa; one (V1059 Sgr) is an old nova; and two others (V478 Her and V1082 Sgr) are long-period novalike variables. The stars with new periods are IPHAS 0345 (0.314 d); V344 Ori (0.234 d); VZ Sex (0.149 d); NSVS 1057+09 (0.376 d); V478 Her (0.629 d); V1059 Sgr (0.286 d); V1082 Sgr (0.868 d); FO Aql (0.217 d); V587 Lyr (0.275 d); V792 Cyg (0.297 d); V795 Cyg (0.181 d); V811 Cyg (0.157 d); V542 Cyg (0.182 d); PQ Aql (0.247 d); V516 Cyg (0.171 d); and VZ Aqr(0.161 d). Noteworthy results on individual stars are as follows. We see no indication of the underlying white dwarf star in V709 Cas, as has been previously claimed; based on the non-detection of the secondary star, we argue that the system is farther away that had been thought and the white dwarf contribution is probably negligible. V478 Her had been classified as an SU UMa-type dwarf nova, but this is incompatible with the long orbital period we find. We report the first secondary-star velocity curve for V1062 Tau. In V542 Cyg, we find a late-type contribution that remains stationary in radial velocity, yet the system is unresolved in a direct image, suggesting that it is a hierarchical triple system.
1 Introduction
Cataclysmic variables (CVs) are close binary star systems in which a white dwarf primary star accretes matter from the Roche lobe overflow of a less-compact secondary star. Warner (1995) gives an overview of the field.
The orbital period, , of a CV is its most easily measurable fundamental property. Mass transfer in CVs is thought to be driven by the slow loss of orbital angular momentum. During most of a CV’s life, this leads to gradual shrinkage of the orbit and consequent tightening of secondary’s Roche lobe. The orbital period therefore gives a rough idea of a system’s evolutionary state. Once an orbital period is known, the Roche-filling criterion sets strong constraints on the secondary’s radius, which in favorable circumstances can be exploited to yield a distance estimate.
CVs with high orbital inclinations will eclipse, which makes orbital period determination straightforward and also makes it possible to estimate component masses and the like. Non-eclipsing systems sometimes show periodic photometric modulations, but these do not always appear at ; other phenomena such as superhumps (Patterson et al., 2005) can mimic orbital modulations. Radial velocity spectroscopy is therefore the most reliable way of obtaining for a non-eclipsing CV 222In rare cases, a radial-velocity modulation may not be at ; Araujo-Betancor et al. (2005) discuss a particularly interesting example.. For this reason we have therefore been collecting radial-velocity time series for a large number of CVs, with the aim of determining .
In this paper we collect together observations and analyses of twenty CVs, all of which proved to have periods well longward of the so-called period gap, a range of from roughly 2 to 3 hours in which relatively few CVs are found (Kolb et al., 1998). Table 1 gives basic information about the stars studied here. The periods of most of these stars are published here for the first time; a few others are included because we have improved the accuracy of the period. We did not use any particular astrophysical criterion to select the present sample, but rather observed these stars because period determinations appeared feasible.
Section 2 describes the observations and analysis, and §3 gives results for the individual objects.
2 Techniques
Our spectroscopic observations are from the 2.4 m Hiltner or 1.3 m McGraw-Hill telescopes at MDM Observatory in Kitt Peak, Arizona. At the Hiltner, we used the ‘modular’ spectrograph, a 600 line mm-1 grating, a 1-arcsec slit, and a SITe 20482 CCD detector. Most of the spectra cover from 4210 to 7560 Å (vignetting severely toward the ends), and have typical resolution of 3.5 Å FWHM. On the 1.3m, we used the Mark III spectrograph, a SITe 10242 CCD detector, a 2-arcsecond slit, and achieved typical resolution of 4-5 Å FWHM from 4645 to 6960 Å. On earlier observing runs, we took spectra of comparison lamps whenever the telescope was moved to achieve accurate wavelength calibration, but on later runs we used the night-sky spectrum to shift the zero point of a master wavelength calibration obtained during twilight. When the sky was clear, we observed bright early-type stars to derive corrections for the telluric absorption features, and flux standards to calibrate the instrument response. Our spectrophotometry suffers from uncalibratable errors due to losses at the spectrograph slit, but experience suggests that these typically amount to mag. Thorstensen, Fenton, & Taylor (2004, hereafter TFT04) discuss the observational protocols in more detail.
2.1 Radial Velocity Measurement and Period Determination
We measured centroids for the emission lines using convolution techniques explained by Schneider & Young (1980) and Shafter (1983), in which the line profile is convolved with an antisymmetric function and the zero of the convolution is taken as the line center. For the most part we used a convolution function consisting of a positive Gaussian and a negative Gaussian separated by an adjustable amount. We usually set the separation of the Gaussians to maximize sensitivity to the steep sides of the line profile.
The Roche geometry dictates that longer-period CVs will have larger and generally more massive secondary stars than shorter-period CVs, so their secondary stars often contribute significantly to the total light. When possible, we measured absorption line velocities using the cross-correlation radial velocity package xcsao (Kurtz & Mink, 1998). In most cases the template spectrum was a composite of 76 observations of late-type IAU velocity standard stars, which had been shifted individually to zero velocity before averaging; for later-type secondaries we used a similar template constructed from M dwarfs. The spectral region used in the cross-correlation was either 6000 to 6500 Å, or a window from 5100 to 6500 Å, excluding the complicated region near HeI and NaD. Uncertainties, based on the -statistic of Tonry & Davis (1979), were typically on the order of 20 km s-1. We omitted unphysically large velocities (which result when the ‘wrong’ cross-correlation peak is selected) and velocities with large estimated uncertainties.
We analyzed the velocity time series with a ‘residualgram’ period-search algorithm (Thorstensen et al., 1996) which fits general least-squares sinusoids of the form
to the time series over a densely-spaced grid of trial frequencies . The results are presented as plots of 1/, where ; here is a measured velocity, is the best-fitting sinusoid evaluated at the corresponding time , and is the formal uncertainty of the velocity, obtained by propagating the estimated counting-statistics uncertainties of the individual wavelength channels. Ideally, a graph of as a function of shows a strong spike at the orbital frequency, but the imperfect sampling of the time series inevitably results in aliasing. We used a Monte Carlo algorithm developed by Thorstensen & Freed (1985) to assess the confidence with which the highest peak in the periodogram can be identified with the true orbital frequency. Once we were satisfied that the period was correct, we fit the time-series with sinusoids of the form
using a hybrid linear least-square algorithm333Emission- and absorption-line velocity amplitudes are denoted as and , respectively. This procedure is described in detail in TFT04. For those CVs with absorption-line radial velocity solutions, we shifted the individual spectra into the absorption-line rest frame before averaging them.
2.2 Secondary Stars and Spectroscopic Distances
As noted earlier, the secondary-star spectrum is often detectable in longer-period CVs. The absorption-line radial velocities should track the orbital motion of the secondary, though the radial velocities may be affected by irradiation and other effects (Davey & Smith, 1992). However, a late-type contribution need not arise from the secondary; if the late-type spectrum is nearly fixed in velocity, it may come from an unrelated field star, or the outer member of a hierarchical triple; This appears be the case for V542 Cyg, discussed further below.
Peters & Thorstensen (2005) and TFT04 discuss our spectral decomposition technique and the inferences based on the secondary star, which we summarize briefly here. To estimate the secondary star’s spectral type and its contribution to the light, we scale spectra of cool spectral-type standard stars, subtract them from the target spectrum, and look for the best possible cancellation of the late-type features. This yields estimates of the spectral type of the secondary and its contribution to the total light. The spectral type constrains the secondary’s surface brightness, and the orbital period (together with the condition that the secondary fills its Roche critical lobe) tightly constrains the secondary’s radius . The precise value of does depend weakly on the secondary’s mass, ; to compute a realistic range for , we use the evolutionary calculations of Baraffe & Kolb (2000) to guide the selection of a range for . The estimates of the radius and surface brightness together yield the secondary’s absolute magnitude, which in turn gives the distance, without any assumption that the secondary is a typical main-sequence star. Where applicable, we estimate the visual extinction using the Schlegel, Finkbeiner, & Davis (1998) maps; these give the extinction to the edge of the Galaxy, so we use their tabulated as an upper limit.
2.3 Direct Imaging and Photometry
For most of the stars studied here, we have collected direct images using the Hiltner 2.4m telescope and a SITe 20482 CCD detector. Most of the celestial positions in Table 1 were measured from these images. In a few cases we give magnitudes based on or image sets, which were reduced using observations of standard stars from Landolt (1992).
3 The Individual Stars
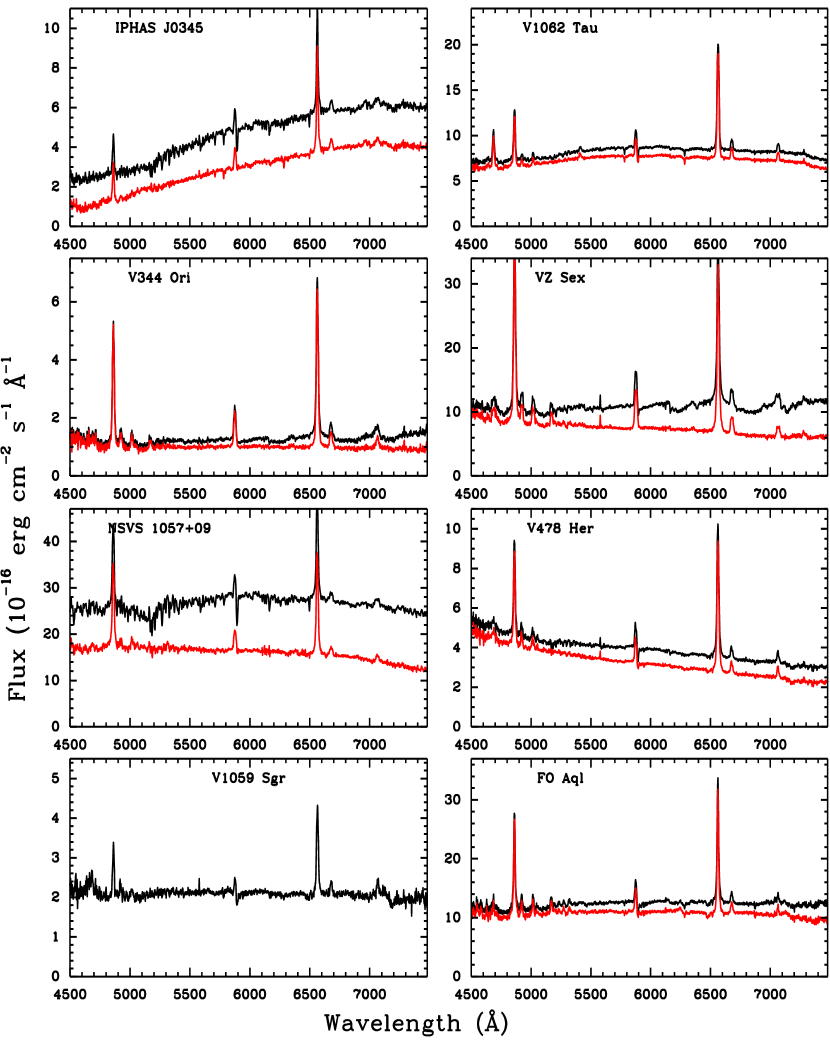
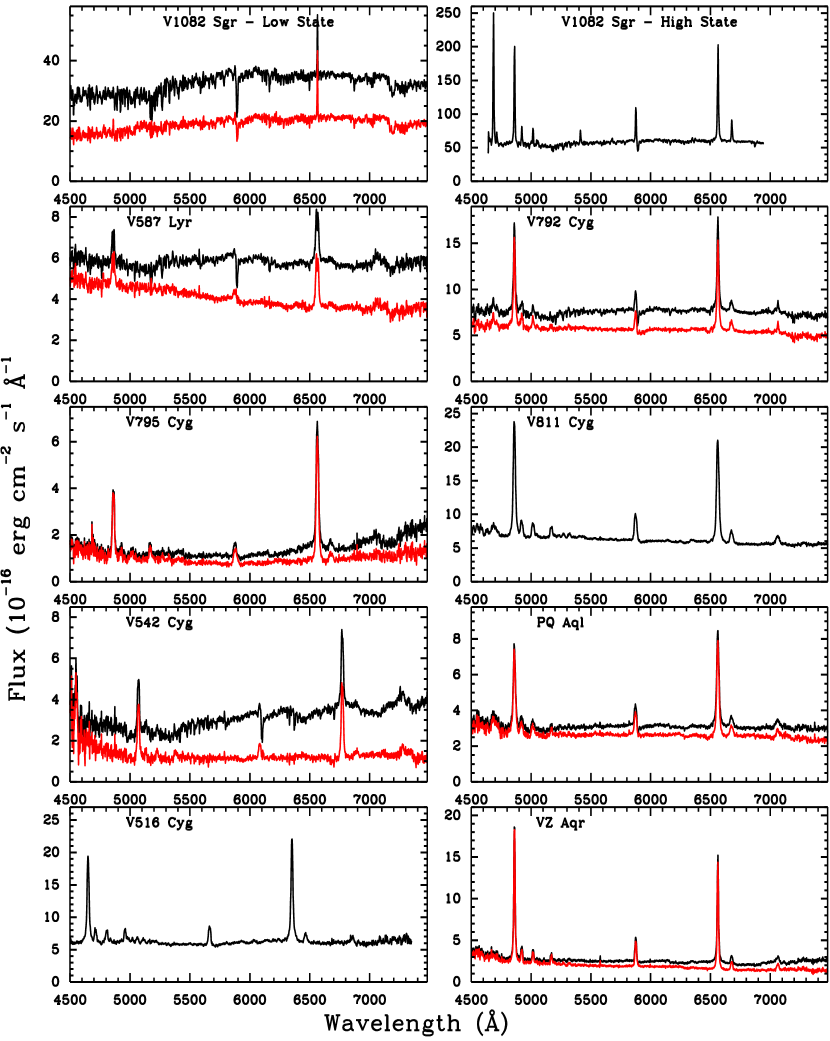
Our results for the individual CVs are summarized in tables and figures. Figs.1 and 2 show the mean spectra of most of the stars (excluding a few spectra of dwarf novae in outburst). A small sample of radial velocity measurements included in the analysis are listed in Table 2444The complete table can be found in the electronic edition.. Figs. 3 and 4 give periodograms of the velocity time series, computed as described above. Table 3 lists parameters of the best-fit sinusoids to the velocity time series. For all parameters, the number in parentheses represents the uncertainty in the last digit. Finally, Figs. 5, 6, and 7 show folded radial velocity curves; when both absorption- and emission-line velocities are available, the radial velocity curves are folded about the weighted mean period.
3.1 V709 Cas
V709 Cas is a DQ Her star, or intermediate polar (IP), with a pulsation period near 313 s. Bonnet-Bidaud et al. (2001) found d from a radial-velocity study. They also detected absorption wings around the higher Balmer lines, which they interpreted as arising from the white dwarf photosphere. Our H emission-line radial velocities were taken in the interval from 1996 to 2005, and define a unique cycle count over the entire time span. The period we find, 0.2222033(7) d, or 5.33288 hr, agrees within the uncertainties with the Bonnet-Bidaud et al. (2001) period, but is more precise because of the longer time base.
Fig. 8 shows the average spectrum from 1999 October; the flux level in this spectrum corresponds to . While the spectrum does not cover the higher Balmer lines well, we do not see absorption wings around H comparable to those found by Bonnet-Bidaud et al. (2001). We examined the summed spectra from other observing runs, and none of these showed Balmer absorption either. We therefore cannot confirm the white dwarf detection claimed by Bonnet-Bidaud et al. (2001).
After some consideration, we are skeptical that the Balmer absorption wings detected by Bonnet-Bidaud et al. (2001) arise from the white dwarf photosphere. They get a good fit to the absorption using a K white dwarf model atmosphere. At (in cgs units), a white dwarf at this should have (Bergeron et al., 1995). If the system’s luminosity is low enough for such a faint white dwarf to be seen, then where is the secondary? Knigge (2006) compiled a semi-empirical ‘donor sequence’ for CVs, and at the 5.3 hr orbital period of V709 Cas, this predicts the spectral class of the secondary to be near M2, and the absolute magnitude to be near 9. For their interpretation to be correct, the flux contributed by the white dwarf puts the system at pc, or ; the secondary should therefore have , and contribute very substantially to the spectrum, but we do not detect the secondary’s contribution in our long cumulative exposures. We do see NaD features, with each of the D lines having an equivalent width of Å, but these are sharp and motionless, indicating an interstellar origin. We feel that the balance of the evidence suggests that the line wings are an intermittent feature of the optically thick disk, and that the system is more luminous and distant than in the Bonnet-Bidaud et al. (2001) interpretation.
3.2 AF Cam
Thorstensen & Taylor (2001) reported spectroscopy of AF Cam. They detected the K-type secondary star, and radial velocity variability in both emission and absorption lines at a weighted mean period of d. We have since observed the star occasionally with the aim of refining and deriving an ephemeris. The period and epoch given in Table 3 is based on an unambiguous cycle count over the interval from 2000 to 2007. Thorstensen & Taylor (2001) show a spectrum and analyze the secondary star’s contribution.
3.3 IPHAS J034511.59+533514.5
Witham et al. (2007) discovered this CV as part of the Isaac Newton Telescope Photometric H Survey of the northern Galactic Plane, The strong K-type contribution evident in their spectrum, and the relatively bright magnitude () made this a tempting target for an absorption-line velocity study, which we undertook starting in 2008 January. The expected modulation did prove to be present in both the H emission velocities and the absorption velocities, with near 7.5 hr. Both time series favor a period near 0.31390 d. An alias period near 0.31609 d, reflecting an alternate choice of cycle count between observing runs, is much less likely.
The secondary spectrum is best matched by a K5.5 1.5 star, but the continuum that remains after the secondary star is removed is unusually red, suggesting that the reddening is substantial. The Galactic latitude is low, , and the Schlegel, Finkbeiner, & Davis (1998) maps give the reddening mag at this location. We experimented with de-reddening by various amounts. With reddenings , the Balmer decrement became implausibly steep (H stronger than H), while at small reddenings the continuum remained too red. The best values appeared to be in the range . The procedure outlined earlier then led to the inferences in Table 4. The distance estimate is very rough, mostly because of the large uncertainty in the reddening.
Sinusoidal fits to the emission and absorption velocities show them to be cycles out of phase. In double-lined spectroscopic binaries, the ratio gives an estimate of the mass ratio, but in order for this to be accurate, the velocities must trace the center-of-mass motion of the two stars. If this is the case, the phase lag between emission and absorption must be 0.5 cycles – this is a necessary, but not sufficient, condition for the estimate to be trustworthy. In the present case, this condition is marginally fulfilled – the discrepancy is formally three standard deviations. If we assume the -velocities do reflect the center-of-mass motion, we find . Combining this with a broadly typical white dwarf mass of 0.7 M⊙ yields a secondary mass near 0.55 M⊙, similar to what the Baraffe & Kolb (2000) models would suggest at this period and spectral type.
While these mass calculations are somewhat fanciful, the modest value of does firmly constrain the orbital inclination to be fairly low. Even we take to be a very low M⊙ and to be 0.6 – pushing both quantities to values that increase – the inclination is only 25 degrees. The apparent lack of eclipses is therefore not unexpected.
The Baraffe & Kolb (2000) evolutionary models that best match this system are those in which mass transfer begins after hydrogen has been substantially depleted in the core. The spectral type of the secondary is similar to that in other CVs with similar orbital periods (Knigge, 2006).
No dwarf nova outbursts have been reported from this system. In many respects it resembles LY UMa (= CW 1045+525), a 0.271-d emission-line binary with a strong late-K contribution and no reported outbursts (Tappert et al., 2001).
3.4 V1062 Tau
V1062 Tau is the optical counterpart of the X-ray source 1H0459+246, which was discovered in the HEAO-2 Large Area Sky Survey (Wood et al., 1984). Remillard et al. (1994) found an X-ray modulation near 62 minutes, and classified the object as an intermediate polar, or DQ Her star. The 62-minute X-ray modulation was confirmed and refined by Hellier et al. (2002). Remillard et al. (1994) also published an optical spectrum, and noted the features of a CV and a K star. They obtained and time series photometry that showed ellipsoidal variation at a period of h. Lipkin et al. (2004) monitored V1062 Tau photometrically, and refined the orbital period to h555 Their paper quotes this figure as 9.9082 h, but Y. Lipkin (private communication) confirms that two digits were mistakenly transposed. . They also detected the 62-minute period, and the beat between this and the orbit. Their data showed two short, low-amplitude outbursts, with mag.
For the most part, our spectra of V1062 Tau appeared similar to the average shown in Fig. 1, which in turn is generally similar to that shown by Remillard et al. (1994) (their Figure 3). The excitation is high; HeII emission is similar in strength to H, and our long cumulative exposure also shows emission at HeII . The Schlegel, Finkbeiner, & Davis (1998) map indicates a reddening at this position (), and the continuum does suggest substantial reddening. The presence of diffuse interstellar bands near and (Jenniskens & Desert, 1994) gives further evidence for reddening, and the rather strong Na D absorption lines near are almost motionless in the spectrum, indicating that they are mostly interstellar. In computing the secondary-based distance, we assume that V1062 Tau is beyond most of the reddening in the Schlegel, Finkbeiner, & Davis (1998) map, which yields a distance of pc, which would put it over 200 pc from the midplane of the Galaxy, where it would indeed be expected to be outside most of the dust layer.
Our spectrum has a synthetic magnitude near 16.7. However, we also obtained two spectra 2002 Feb 20.53 UT that show the star much brighter, with synthetic magnitudes near ; another pair of spectra taken at Feb 20.78 UT, a few hours later, have and 15.3. By a remarkable coincidence, Lipkin et al. (2004) observed the same outburst earlier in the same night (from a different longitude); our first pair of spectra was taken some 4.5 hours after their last point. If the decline between our spectra was the decline from outburst, the flare’s duration was considerably less than one day. Only a few magnetic CVs have been observed to undergo such short-lived flares (Lipkin et al., 2004).
In our spectra the velocity of the late-type feature is modulated at d, or 9.9812(3) h, consistent with the Lipkin et al. (2004) period. The emission-line velocities include some points from earlier observing seasons; the signal-to-noise of these spectra was not adequate for measuring absorption-line velocities, but the increased time base does result in a more precise period. The emission-line velocities do not determine the period on their own – the single best fit to the emission is near 0.4187 d (10.05 h). However, when the absorption line velocities are fitted at the 10.05 h period, the fit is very poor, while the fit to the emission-line velocities at 9.9812 h (the best absorption-line period) is reasonably good. Because the absorption lines arise in a relatively uncomplicated stellar photosphere, their velocities should be much less vulnerable to state changes (and the like) than those of the emission lines; because of this, and the good agreement with the independent period determination by Lipkin et al. (2004), we are confident that the absorption-line period is essentially correct. In Table 3 and Fig. 5 we adopt the weighted average of the emission- and absorption-line periods. The two periods do disagree by 3.6 standard deviations, so some caution is in order extending the ephemeris into the future, but the actual difference of the periods is only 4.3 s.
The spectral decomposition shows the secondary to be of type K5 subclasses. At this orbital period and spectral type, modeling suggests that CV secondaries depleted much of their core hydrogen before the beginning of mass transfer (Baraffe & Kolb, 2000; Knigge, 2006; Podsiadlowski et al., 2003).
The emission-line velocity modulation is far from antiphased with the absorption (see Fig. 5), so it is evidently not a faithful tracer of the white dwarf motion. In contrast, the absorption lines should follow the secondary star. Without a reliable we cannot make firm mass estimates. However, the absorption velocity amplitude , km s-1, is fairly large for this , and suggests that the white dwarf is relatively massive and that the inclination is not too far from edge-on. As an illustration, a system = 1 M⊙ and = 0.5 M⊙ at degree would produce the observed . Note that Lipkin et al. (2004) do not detect eclipses despite intensive coverage.
3.5 V344 Ori
Our spectrum appears similar to that published by Munari et al. (1997). We clearly detect an M-dwarf secondary. The gross period (Table 3) is based on emission-line velocities. It is unambiguous, but the fine period is aliased on a scale of one cycle per 47 d due to uncertain cycle count between observing runs; the allowed precise periods satisfy
where the denominator is an integer. The cross-correlation technique was sensitive enough to measure M-dwarf velocities for some of our spectra, but these were not extensive or accurate enough to shed light on the period; however, they did confirm that the M-dwarf light is from the binary companion and not from an interloper. Combining our spectra into a single-trailed greyscale representation confirmed the presence of secondary features; in particular, the CaI 6122 absorption line appeared faintly, with a velocity semiamplitude of km s-1.
V344 Ori is at , for which Schlegel, Finkbeiner, & Davis (1998) give to the edge of the Galaxy. However, its spectrum shows neither diffuse interstellar bands nor interstellar NaD absorption, which would be expected if the reddening were this large. Standardized observations taken 2008 Jan. 16.0 UT give , , , and . At minimum light, dwarf novae typically have and (see, e.g., Vogt 1983); the very blue suggests near-zero reddening, while the redder suggests . The poorly-constrained reddening contributes substantially to the distance uncertainty (Table 4).
3.6 VZ Sex = RX J0944.5+0357
Jiang et al. (2000) obtained a spectrum of this ROSAT all-sky survey source that showed the broad emission lines of a CV. Mennickent et al. (2002) obtained more extensive spectrophotometry from which they deduced a spectral type of M2 for the secondary. They also found a radial-velocity periodicity that corroborated an early version of the period reported here.
Nearly all our observations are from 2001 March, but we also have two velocities from 2000 April. The period measured in 2001 March is not precise enough to extrapolate the cycle count to the previous year, but the extra data do constrain the precise period to a group of aliases which can be expressed as
where the denominator is an integer.
The M-dwarf contribution to the spectrum was strong enough that we could measure absorption velocities for the majority of our spectra by cross-correlating the M-dwarf radial velocity template over the 6000 to 6500 Å region. The absorption velocities were not precise enough to yield an accurate , but they did move approximately in antiphase to the emission, confirming that the M dwarf contribution arises from the binary companion.
We also estimated the secondary star’s spectral type, and found the best match around M1 1 subtype, slightly earlier than the type found by Mennickent et al. (2002). This is just a little warmer than is typical at this (3.57 hr); the Baraffe & Kolb (2000) models that predict this early spectral type begin with relatively massive secondaries and have depleted nearly all the core hydrogen at the start of mass transfer.
3.7 NSVS 1057564+092315
Greaves (2006) identified this object as a CV, most likely a dwarf nova of the UGSS subclass, after Patrick Wils first called attention to the nature of its light curve from the Northern Sky Variability Survey. It appears in the Sloan Digital Sky Survey, but was not selected for a spectrum, probably because its colors (, , , , and ) place it near the ‘stellar locus’ used to exclude spectroscopic targets (Richards et al., 2002; Szkody et al., 2002). This illustrates that while the SDSS has been extraordinarily effective at finding new CVs and illuminating their properties (Gänsicke et al., 2009), it does not find all the CVs within its footprint (and indeed, Szkody et al. 2009 warn that SDSS does not claim completeness for CVs).
Our spectra show modulation of both the emission and absorption at essentially the same period, with a secure cycle count on all timescales over the 1456 d span of our data set. The weighted average is 0.376308(1) d (9.03 hr). If we define orbital phase at the blue-to-red crossing of the absorption velocities through their mean velocity , then the emission velocities cross blue-to-red at , which is close to the antiphased behavior expected if the emission lines trace the white-dwarf velocity. If the emission lines do in fact trace the white-dwarf velocity (which is far from proven), , yielding . From Baraffe & Kolb (2000), we find for a K4 or K5 secondary star with a of roughly 9 h; this gives from . These values of , and would imply an inclination near 45 degrees, so eclipses are not expected.
At , , and pc (Table 4), this object is at least several hundred pc away from the Galactic plane, so it may belong to the thick disk. The secondary’s spectrum does not appear unusual, so it is probably not a low-metallicity halo object. It does not have a significant proper motion listed in the USNOB1.0 (Monet et al., 2003) or UCAC3 (Zacharias et al., 2010) catalogs.
3.8 V478 Her
The General Catalog of Variable Stars (Kholopov et al., 1998) lists this star as having variability type IS, that is, showing rapid irregular variability. Ritter & Kolb (2003) assign a superhump period of 0.12 d (2.88 hr), which would imply that is slightly shorter than that, which would put V478 Her in the (roughly) 2- to 3-hour ‘period gap’. The source for the 2.88-hr period is a photometric time series, 3.7 hours in duration, taken by T. Vanmunster on 2001 June 7 UT, during an outburst666The observation is described at http://www.cbabelgium.com/. This observation showed a variation that Vanmunster interpreted as a probable superhump; on this basis, the star is listed in the final edition of the Downes et al. (2005) CV catalog as an SU-UMa type dwarf nova. We were therefore puzzled when our initial observations showed no sign of a short-period radial velocity modulation, despite sufficient signal-to-noise in the H emission lines to make such a modulation apparent if it were present.
More extensive observations extending over several seasons indicate that is much longer than had been thought, over 15 h. The secondary spectrum is just detectable, and the radial velocities of both the the H emission line and the absorption spectrum show the long period. The short period appears to be mistaken, and the star has therefore been misclassified. Because of its short duration, the light curve on Vanmunster’s site shows only a single minimum, and we note that he characterized his detection of superhumps as “likely”, rather than definitive. We do not have time series photometry, and so cannot comment further on the cause of the variation he detected.
The emission-line velocities we measure do not fit a sine curve accurately, and are not in antiphase to the absorption velocities. The slightly double-peaked structure visible in Fig. 5 may be real, or might result from limited sampling. The secondary-star radial velocity amplitude, km s-1, does not suggest that the masses are out of the ordinary; for example, a 0.8 M⊙ white dwarf and a 0.7 M⊙ secondary would produce the observed at .
The orbital period of V478 Her is unusually long for a CV – it lies well outside the range tabulated by Baraffe & Kolb (2000), so the secondary-star mass range given in Table 4 is even more of a guess than usual. Even so, the long orbital period (hence large Roche lobe), warm secondary, and faint apparent magnitude indicate that V478 Her very distant for a CV; at and , it is also at least 1 kpc from the Galactic plane.
3.9 V1059 Sgr
This is an old nova, having outburst in 1898. Duerbeck & Seitter (1987) describe the spectrum as having a noisy flat continuum, with Balmer and HeII emission. The continuum in our spectrum is indeed fairly flat, but also shows weak broad undulations that superficially suggest a companion’s contribution. However, we could not generate a convincing spectral decomposition with our library spectra, so these might not indicate a companion. In part because of the unfavorable declination, we had to observe this target on several observing runs before we were certain about the gross period. This led to an uncertain cycle count between runs, which in turn created a complex structure of fine-scale aliases. The 6.87 h period given in Table 3 is based on the velocities from our most extensive single observing run.
3.10 V1082 Sgr
Cieslinski et al. (1998) found that the V1082 Sgr shows high and low states; when it is in a high photometric state ( 14.0 - 14.5), it shows emission lines, with HeII comparable in strength to H, while in its low state ( 15.0 - 15.5), the emission lines disappear. A K-type absorption spectrum is present as well, so they suggested that V1082 Sgr may be a symbiotic star. The orbital period we find, near 0.868 d, would be very short for a symbiotic, and is consistent with a long-period novalike variable. The Swift satellite detected V1082 Sgr in hard X-rays (14 – 195 keV; Tueller et al. 2009); it is one of 29 CVs found in the Swift BAT 22-month survey catalog, most of which have proven to be magnetic CVs of the DQ Her (or Intermediate Polar) subtype (Mukai & BAT Survey Team, 2009).
Our spectra confirm the state behavior noted by Cieslinski et al. (1998), but we never did see the emission lines disappear entirely. Strong He II is often seen in magnetic CVs; this, combined with the hard X-ray detection, suggests that this is indeed a magnetic system. Time-series measurements in the optical and X-ray might reveal a white-dwarf spin period.
It proved difficult to get a good match to the secondary spectrum, so the spectral type in Table 4 is fairly uncertain. The unusually long period puts it outside the realm of the Baraffe & Kolb (2000) models, so a wide range of is assumed in the distance calculation; fortunately, this has little effect on . The Schlegel, Finkbeiner, & Davis (1998) map gives at this location (); this is small enough so that it does not contribute significantly to the distance uncertainty, which is dominated by the crude spectral decomposition.
3.11 FO Aql
This dwarf nova is among the few studied by Urban & Sion (2006) that does not have a known orbital period.
The velocities from 2007 June and July define a period of 0.21777(4) d, or 5.23 h. We also have a few velocities in 2005 and 2006. The cycle count from year to year is ambiguous, but the two most likely choices give periods of 0.217735(3) d and 0.217856(4) d, which differ in frequency by one cycle per 393 d. Some of our spectra were taken above minimum light.
While an early M-type secondary star spectrum is evident, it did not yield usable radial velocities. The spectral type and contribution were fairly uncertain, so the inferences in Table 4 are fairly crude. The interstellar extinction at this position ( ) is fairly sizeable – Schlegel, Finkbeiner, & Davis (1998) estimate to the edge of the dust layer – and the summed spectrum does show weak diffuse interstellar bands. As a result of all these factors, the final distance estimate is uncertain by a factor of around 2.
3.12 V587 Lyr
V587 Lyr, also designated TK 5, was discovered by Kryachko (2001), who classified it as a dwarf nova based on the observation of two outbursts on astrograph plates. The 6.6-hour orbital period found here is within the normal range for dwarf novae. The spectrum shows a clear contribution from a K-type secondary, and broad emission lines that appear rather weaker than those in otherwise similar stars.
All of our usable spectra are from a single observing run in 2006 June. Because the absorption velocities quickly yielded , we took a comparatively small number of spectra. We also obtained standardized photometry on 2003 June 19.34 and 2006 August 29.20; the 2003 June observation gave , , , and , and the 2006 August observation was very similar. As is typical, the uncertainty in the distance estimate (Table 4) is dominated by the uncertainty in the secondary’s spectral type.
3.13 V792 Cyg
V792 Cyg was discovered by Miller & Wachmann (1959), who found several typical U Gem-type outbursts on photographic plates. Bruch & Schimpke (1992) published a spectrum taken with the source well above minimum light, and noted a possible secondary-star contribution.
We have observations from runs in 2007 July and 2007 August, which were separated by about 35 days. The cycle count between those two runs is ambiguous. Both the absorption and emission velocities slightly favor a period of 0.2972(1) d, but periods of 0.2996(1) and 0.2948(1) d are also possible. These alternate periods differ by about 3 minutes from the most likely choice, so the rough period is well-determined. The period quoted in Table 3 is computed assuming the most likely choice of cycle count is correct, but the Monte Carlo simulation gives a discriminatory power of only for the alias choice.
The K5 spectral type of the secondary is about as expected given the 7.1 h period (Knigge, 2006). The mass ratio indicated by the ratio of the absorption and emission velocity amplitudes is , but the emission line radial velocity modulation differs from antiphase with the absorption by cycles, so this calculation is somewhat suspect. For component masses broadly typical of CVs ( M⊙, M⊙), the -velocities indicate an orbital inclination of . The system is therefore unlikely to eclipse.
3.14 V795 Cyg
This star was mis-identified in earlier editions of the Downes catalog, but we were able to contribute a correction based on our imaging, and the correct object is indicated in Downes et al. (2005). The identification images show the star at , , , and .
The radial velocities are from two observing runs only d apart, followed by another several months later. The choice of cycle count between these runs is fairly secure, so the 4.35 h period (Table 3) is nearly unambiguous, but it is marginally possible that the true orbital frequency is higher by cycle d (corresponding to a period min shorter).
The Schlegel, Finkbeiner, & Davis (1998) maps give a total in this direction (, ). We found that the secondary spectrum fit was easiest when we de-reddened the spectrum by this amount. This is somewhat puzzling, since our measured colors (especially ) are typical for an unreddened dwarf nova. In view of this we assume a generous uncertainty in the reddening when computing the secondary-based distance (Table 4).
3.15 V811 Cyg
Our averaged spectrum resembles that obtained by Munari et al. (1997), who described it as a “text-book example of a CV spectrum”. The 3.76-hour period is short compared to most of the objects studied here, and we do not detect the secondary star’s contribution. Most of our data are from observing runs in 2007 June and 2007 July, only d apart, and the cycle count between these runs is secure; we also have a few observations from 2005. The cycle count between 2005 and 2007 is unknown, but the precise periods allowed by the data are well-fitted by
where the denominator is an integer.
3.16 V542 Cyg
Bruch & Schimpke (1992) present a spectrum of this star, which they describe as ‘extremely faint’ at the time of their observations; they did not convincingly detect emission lines, and pronounced the dwarf-nova classification as ‘doubtful’ on the basis of the spectrum. Our spectrum appears much more robust, with strong, broad Balmer lines and the 4.36-hour orbital period is typical of dwarf novae, so we confirm that V542 Cyg is indeed a CV. We have one set of direct images taken 2005 Sep. 15.20 UT with the Hiltner 2.4 m telescope, and calibrated with observations of Landolt (1992) standard stars; these gave , , and . For comparison, the flux-calibrated spectrum published by Bruch & Schimpke (1992) implies , so it seems possible that they did not have the star in the slit (they found some of their fainter targets by blind offset).
There is an obvious late-type contribution in our spectrum. The late-type contribution appears to explain the coexistence of the blue color with the relatively red and colors. However, the late-type component does not show a significant radial-velocity modulation at the period derived from the emission lines (see Fig. 6), so the late-type spectrum clearly is not from the secondary. The late-type spectrum could be from an interloper elsewhere along the line of sight, but in our best direct image (in the -band), the point-spread function has a FWHM of 1.0 arcsec (at 0.275 arcsec pixel-1), yet V542 Cyg shows no sign of incipient resolution. In addition, the position of the blended image does not shift between the images in different filters, with an upper limit of arcsec. The -filter image should be dominated by the CV, while the -filter light is dominated by the late-type contribution, so the lack of a shift means that the two objects are co-located in the sky to good accuracy. This suggests that the late-type contributor is physically associated with the CV, even if it is not the Roche-filling companion. V542 Cyg would seem to be a triple system.
3.17 PQ Aql
V. Goranskij 777VSNET-alert number 2140, 1998; http://www.kusastro.kyoto-u.ac.jp/vsnet/Mail/alert2000/msg00140.html clarified the identification of this star; he noted its blue color and that it appears to be in outburst on the first Palomar Observatory Sky Survey, and suggested that it may be a cataclysmic binary. Our spectra show the typical dwarf nova emission lines, confirming his suggestion. Nearly all of our spectra were taken in quiesence; they are from two closely-spaced observing runs runs in 2007 June and July. The H emission-line radial velocities give a best period of 0.24675 d; a much less likely choice of cycle count between the observing runs yields 0.2436 d. In some of the spectra we were able to measure the velocity of the secondary star. The absorption velocities were less accurate than the emission velocities, but they independently gave the same orbital period. The secondary’s spectral type, M1.5 1.0, is approximately as expected for the 5.9-h orbital period (Knigge, 2006).
3.18 V516 Cyg
Bruch & Schimpke (1992) reviewed the discovery history of this star and published a spectrum that shows it somewhat brighter and bluer than our mean spectrum. They described their spectrum as resembling that of a dwarf nova on the decline from outburst, while ours appears to represent a more nearly quiescent state. The continuum shows weak, broad features that resemble the absorption bands of a secondary star, but we were unable to match these convincingly to our spectral-type standards, so they may not arise from a secondary. Our data come from two short runs separated by two years; the 4.1 h period is present in both data sets, and is definitive in the combined data, but the cycle count between runs is not determined.
3.19 VZ Aqr
Our spectrum resembles the one obtained by Szkody & Howell (1992), except that the flux level in our spectrum is somewhat lower and the emission equivalent width appears to be greater. Like them, we detect an M-type companion; they estimated the spectral type to be in the range M0 to M5, and from that estimated the distance to be pc, for their latest possible spectral type. They did not have a with which to constrain the size of the Roche lobe. Our 3.85 h period is based on H radial velocities from a single observing run in 2005 September.
We obtained photometry in 2005 September that showed the star near on two separate nights; the synthesized magnitude from our mean spectrum is also near 18.0. Using the secondary star spectrum (Table 4) we find VZ Aqr to be considerably greater than the minimum distance found by Szkody & Howell (1992). Warner (1987) found an empirical relationship between the absolute visual magnitudes of dwarf novae at maximum light and their orbital periods. This predicts at VZ Aqr’s period. VZ Aqr reaches , which would imply a distance near 320 pc. Given this, our estimate of pc is probably somewhat greater than the true distance. As noted above, the normalization of the spectrum used for the distance calculation is corroborated by the photometry derived from direct imaging. The largest uncertainty in the distance calculation is the spectral classification of the secondary star. A closer distance would suggest a spectral type somewhat cooler than our estimate.
3.20 RXJ2133.7+5107
The X-ray source RXJ2133.7+5107 was discovered by the Galactic Plane Survey as an X-ray source, and subsequently identified as a DQ Her-type CV by Motch et al. (1998). Bonnet-Bidaud et al. (2006) presented photometry which revealed a 570 s modulation, related to the white-dwarf spin period, and spectroscopy showing a radial-velocity period of 7.193(16) h, or 0.2998(7) d, which is evidently . Our H radial velocities show modulation at 0.297432(3) d; while this close to Bonnet-Bidaud et al. (2006) period, it differs by 3.4 standard deviations. The interval between our first and last observations is 624 days, and there is no ambiguity in the cycle count over that time. Bonnet-Bidaud et al. (2006) observed the star on two brief runs some six years apart, and were naturally unable to determine the cycle count between their two epochs, so our period should supersede theirs. Our average spectrum (not shown) is very similar in appearance to that that that published by Bonnet-Bidaud et al. (2006). The only new information we present for this star is the improved period.
4 Conclusions
Our main goal in observing these stars was to determine their orbital periods, or, if the periods were already known, to refine them. The objects discussed here were selected to be those with longer orbital periods. At longer periods the secondary star tends to be more conspicuous than at shorter periods; in accordance with expectation, we detect the secondary star’s spectrum in most of these objects. The secondaries’ spectral types are approximately as expected (Knigge, 2006) for the orbital periods we find.
Most of the present sample appear to be typical long-period dwarf novae, without obvious abnormalities. Other types in the CV zoo are also represented.
Some of our more noteworthy (or at least unanticipated) findings are as follows.
-
1.
We do not confirm the presence of a white-dwarf contribution in V709 Cas (Bonnet-Bidaud et al., 2001) and argue that it is probably not detectable.
-
2.
IPHAS 0345 resembles a long-period dwarf nova, strongly dominated by its secondary-star contribution, but it has never been observed to outburst. In this respect it resembles LY UMa.
-
3.
We find that V478 Her is a long-period novalike variable, rather than a short-period SU UMa-type dwarf nova.
-
4.
We report the first secondary-star radial velocity curve for the DQ Her star V1062 Tau, and confirm reports of flaring activity in the literature.
-
5.
In V542 Cyg, we find a contribution from a late-type star that is evidently not the secondary star, and argue that it is likely to be a triple system.
5 Acknowledgements
We gratefully acknowledge support from NSF grants AST-9987334 and AST-0307413. We thank the MDM staff for observing assistance, and Dartmouth undergraduate Jimmy Chiang for taking some of the data on V1082 Sgr. John Southworth provided a timely and helpful referee report. As always, we thank the Tohono O’odham Nation for letting us use their mountain for a while.
References
- Araujo-Betancor et al. (2005) Araujo-Betancor, S., et al. 2005, A&A, 430, 629
- Baraffe & Kolb (2000) Baraffe, I., Kolb, U. 2000, MNRAS, 318, 354
- Bergeron et al. (1995) Bergeron, P., Wesemael, F., & Beauchamp, A. 1995, PASP, 107, 1047
- Bonnet-Bidaud et al. (2001) Bonnet-Bidaud, J. M., Mouchet, M., de Martino, D., Matt, G., & Motch, C. 2001, A&A, 374, 1003
- Bonnet-Bidaud et al. (2006) Bonnet-Bidaud, J. M., Mouchet, M., de Martino, D., Silvotti, R., & Motch, C. 2006, A&A, 445, 1037
- Bruch & Schimpke (1992) Bruch, A., & Schimpke, T. 1992, A&AS, 93, 419
- Cieslinski et al. (1998) Cieslinski, D., Steiner, J. E., & Jablonski, F. J. 1998, A&AS, 131, 119
- Davey & Smith (1992) Davey, S., & Smith, R. C. 1992, MNRAS, 257, 476
- Downes et al. (2005) Downes, R. A., Webbink, R. F., Shara, M. M., Ritter, H., Kolb, U., & Duerbeck, H. W. 2005, Journal of Astronomical Data, 11, 2
- Duerbeck & Seitter (1987) Duerbeck, H. W., & Seitter, W. C. 1987, Ap&SS, 131, 467
- Gänsicke et al. (2009) Gänsicke, B. T., et al. 2009, MNRAS, 397, 2170
- Greaves (2006) Greaves, J. 2006, Open European Journal on Variable Stars, 37, 1
- Hellier et al. (2002) Hellier, C., Beardmore, A. P., & Mukai, K. 2002, A&A, 389, 904
- Jenniskens & Desert (1994) Jenniskens, P., & Desert, F.-X. 1994, A&AS, 106, 39
- Jiang et al. (2000) Jiang, X. J., Engels, D., Wei, J. Y., Tesch, F., & Hu, J. Y. 2000, A&A, 362, 263
- Kholopov et al. (1998) Kholopov, P. N., et al. 1998, Combined General Catalogue of Variable Stars, 4.1 Ed (II/214A). (1998)
- Knigge (2006) Knigge, C. 2006, MNRAS, 373, 484
- Kolb et al. (1998) Kolb, U., King, A. R., & Ritter, H. 1998, MNRAS, 298, L29
- Kryachko (2001) Kryachko, T. V. 2001, Information Bulletin on Variable Stars, 5058, 1
- Kurtz & Mink (1998) Kurtz, M. J. & Mink, D. J. 1998, PASP, 110, 934
- Landolt (1992) Landolt, A. U. 1992, AJ, 104, 340
- Lipkin et al. (2004) Lipkin, Y. M., Leibowitz, E. M., & Orio, M. 2004, MNRAS, 349, 1323
- Mennickent et al. (2002) Mennickent, R. E., Tovmassian, G., Zharikov, S. V., Tappert, C., Greiner, J., Gänsicke, B. T., & Fried, R. E. 2002, A&A, 383, 933
- Miller & Wachmann (1959) Miller, W. J., & Wachmann, A. A. 1959, Ricerche Astronomiche, 6, 229
- Monet et al. (1996) Monet, D. et al. 1996, USNO-A2.0, (U. S. Naval Observatory, Washington, DC)
- Monet et al. (2003) Monet, D. G., et al. 2003, AJ, 125, 984
- Motch et al. (1998) Motch, C., et al. 1998, A&AS, 132, 341
- Mukai & BAT Survey Team (2009) Mukai, K., & BAT Survey Team 2009, Bulletin of the American Astronomical Society, 41, 469
- Munari et al. (1997) Munari, U., Zwitter, T., & Bragaglia, A. 1997, A&AS, 122, 495
- Patterson et al. (2005) Patterson, J., et al. 2005, PASP, 117, 1204
- Peters & Thorstensen (2005) Peters, C. & Thorstensen, J. R. 2005, PASP, 117, 1386
- Podsiadlowski et al. (2003) Podsiadlowski, P., Han, Z., & Rappaport, S. 2003, MNRAS, 340, 1214
- Remillard et al. (1994) Remillard, R. A., Bradt, H. V., Brissenden, R. J. V., Buckley, D. A. H., Schwartz, D. A., Silber, A., Stroozas, B. A., & Tuohy, I. R. 1994, ApJ, 428, 785
- Richards et al. (2002) Richards, G. T., et al. 2002, AJ, 123, 2945
- Ritter & Kolb (2003) Ritter H., Kolb U. 2003, A&A, 404, 301 (update RKcat7.10)
- Schlegel, Finkbeiner, & Davis (1998) Schlegel, D. J., Finkbeiner, D. P., & Davis, M. 1998, ApJ, 500, 525
- Schneider & Young (1980) Schneider, D. and Young, P. 1980, ApJ, 238, 946
- Shafter (1983) Shafter, A. W. 1983, ApJ, 267, 222
- Szkody & Howell (1992) Szkody, P., & Howell, S. B. 1992, ApJS, 78, 537
- Szkody et al. (2002) Szkody, P., et al. 2002, AJ, 123, 430
- Szkody et al. (2009) Szkody, P., et al. 2009, AJ, 137, 4011
- Tappert et al. (2001) Tappert, C., Thorstensen, J. R., Fenton, W. H., Bennert, N., Schmidtobreick, L., & Bianchini, A. 2001, A&A, 380, 533
- Thorstensen & Taylor (2001) Thorstensen, J. R., & Taylor, C. J. 2001, MNRAS, 326, 1235
- Thorstensen, Fenton, & Taylor (2004) Thorstensen, J. R., Fenton, W. H. and Taylor, C. J. 2004, PASP, 116, 300
- Thorstensen & Freed (1985) Thorstensen, J. R., Freed, I. W. 1985, AJ, 90, 2082
- Thorstensen et al. (1996) Thorstensen, J. R., Patterson, J. O., Shambrook, A., & Thomas, G. 1996, PASP, 108, 73
- Tonry & Davis (1979) Tonry, J. & Davis, M. 1979, AJ, 84, 1511
- Tueller et al. (2009) Tueller, J., et al. 2009, ApJS, submitted; arXiv:0903.3037
- Urban & Sion (2006) Urban, J. A., & Sion, E. M. 2006, ApJ, 642, 1029
- Vogt (1983) Vogt, N. 1983, A&AS, 53, 21
- Warner (1987) Warner, B. 1987, MNRAS, 227, 23
- Warner (1995) Warner, B., in Cataclysmic Variable Stars, 1995, Cambridge University Press, New York
- Witham et al. (2007) Witham, A. R., et al. 2007, MNRAS, 382, 1158
- Wood et al. (1984) Wood, K. S., et al. 1984, ApJS, 56, 507
- Zacharias et al. (2004) Zacharias, N., Urban, S. E., Zacharias, M. I., Wycoff, G. L., Hall, D. M., Monet, D. G., & Rafferty, T. J. 2004, AJ, 127, 3043
- Zacharias et al. (2010) Zacharias, N., et al. 2010, AJ, 139, 2184
| Name | Epoch | Type | Maximum | Minimum | References | ||
|---|---|---|---|---|---|---|---|
| [h m s] | [∘ ′ ′′] | [mag] | [mag] | ||||
| V709 Cas | 0 28 48.81 | 59 17 22.1 | 2007.7 | DQ | 14.75 B | 15.35 B | 1,2 |
| AF Cam | 3 32 15.51 | 58 47 22.4 | 2002.8 | UG | 13.4 p | 17.6 p | 1,2 |
| IPHAS J0345 | 3 45 11.59 | 53 35 14.5 | CV | 16.0 r′ | 3 | ||
| V1062 Tau | 5 02 27.48 | 24 45 23.2 | 2007.7 | DQ | 15.9 V | 16.2 V | 1,6 |
| V344 Ori | 6 15 18.95 | 15 30 59.3 | 2008.0 | UGZ | 14.2 p | 18.8 V | 1,2,9 |
| VZ Sex | 9 44 31.72 | 3 58 06.1 | 2000.3 | UG: | 12.8 V | 16.8 V | 1,2,9 |
| NSVS 1057+09 | 10 57 56.30 | 9 23 15.0 | UG | 13.0 | 15.5 | 4,8 | |
| V478 Her | 17 21 05.62 | 23 39 36.8 | 2006.2 | 15.5 p | 17.1 p | 1,2 | |
| V1059 Sgr | 19 01 50.56 | 13 09 41.9 | 2003.5 | NA | 4.5 | 17.7 V | 1,2,9 |
| V1082 Sgr | 19 07 21.87 | 20 46 50.5 | 2007.7 | 14.2 p | 15.9 p | 1,2 | |
| FO Aql | 19 16 38.17 | 0 07 37.0 | 2006.4 | UGSS | 13.6 p | 17.5 p | 1,2 |
| V587 Lyr | 19 17 26.47 | 37 10 40.8 | 2006.7 | UG | 14.9 | 17.1 | 1,2,9 |
| V792 Cyg | 19 31 01.03 | 33 47 04.0 | 1992.7 | UGSS | 14.1 | 17.0 | 5,2 |
| V795 Cyg | 19 34 34.09 | 31 32 11.9 | 2003.5 | UGSS | 13.4 | 18.4 V | 1,2,9 |
| V811 Cyg | 19 48 23.31 | 36 26 23.3 | 2004.5 | UGSS | 12.7 | 1,2 | |
| V542 Cyg | 19 49 10.51 | 58 31 59.6 | 2005.7 | UGSS | 13.1 | 18.3 | 1,2 |
| PQ Aql | 19 53 06.67 | 12 59 00.8 | 2002.8 | UG: | 13.0 | 15.0 | 1,2 |
| V516 Cyg | 20 47 09.81 | 41 55 26.3 | 1992.7 | UGSS | 13.8 p | 16.8p | 5,2 |
| VZ Aqr | 21 30 24.62 | 2 59 17.5 | 2005.7 | UGSS | 11.3 | 18.0 V | 1,2,9 |
| RX J2133+51 | 21 33 43.63 | 51 07 25.0 | 2002.8 | DQ | 16 B | 1,7 |
Note. — Positions, variable star types, and magnitudes for the stars studied in this paper. The three numbers given in the References column are respectively the sources for the celestial position, the variability type, and the magnitude range. Most of the positions are measured from direct CCD images taken at MDM, with coordinate solutions derived from fits to the UCAC2 (Zacharias et al., 2004) or USNO A2.0 (Monet et al., 1996). Positions should be accurate to . Note that the epoch listed in column 4 is the date the image was taken, not the coordinate equinox, which is always J2000. References: (1) positions from MDM CCD images; (2) magnitudes from General Catalog of Variable Stars (Kholopov et al., 1998); (3) Witham et al. (2007); (4) position transcribed from UCAC-2 (Zacharias et al., 2004); (5) position measured from the Digitized Sky Survey served at Space Telescope Science Institute. These are based on scans of the Second Palomar Sky Survey, copyright 1993-1995 by the California Institute of Technology; (6) Remillard et al. (1994); (7) Bonnet-Bidaud et al. (2006); (8) Greaves (2006); (9) minimum light magnitude from our imaging (see text);
| TimeaaHeliocentric JD of mid integration minus 2,400,000. | ||||
|---|---|---|---|---|
| AF Cam: | ||||
| 51549.8366 | ||||
| 51549.8407 | ||||
| 51549.8447 | ||||
| 51550.8136 | ||||
| 51550.8197 | ||||
Note. — Full table of radial velocities available in the electronic version of this paper.
| Data set | aaHeliocentric Julian Date minus 2400000. The epoch is chosen to be near the center of the time interval covered by the data, and within one cycle of an actual observation. | bbRMS residual of the fit. | ||||
|---|---|---|---|---|---|---|
| (d) | (km s-1) | (km s-1) | (km s-1) | |||
| V709 Cas | 50801.6342(16) | 0.2222041(3) | 77(4) | 166 | 19 | |
| AF Cam (abs) | 53073.570(4) | 0.3240785(14) | 105(7) | 36 | 22 | |
| AF Cam (emn) | 52233.700(4) | 0.3240780(12) | 63(3) | 45 | 12 | |
| AF Cam (avg) | 0.3240782(9) | |||||
| IPHAS J0345 (abs) | 54528.802(3) | 0.313902(8) | 77(5) | 41 | 15 | |
| IPHAS J0345 (emn) | 54528.663(4) | 0.313901(11) | 99(7) | 38 | 24 | |
| IPHAS J0345 | 0.313902(7) | |||||
| V1062 Tau (abs) | 53617.988(6) | 0.415883(13) | 202(13) | 21 | 30 | |
| V1062 Tau (emn) | 53450.716(9) | 0.415933(5) | 143(19) | 27 | 46 | |
| V1062 Tau | 0.415926(4) | |||||
| V344 Ori | 54525.633(2) | 0.2338(17) | 86(4) | 41 | 15 | |
| VZ Sex (emn) | 51994.6631(12) | 0.1487(3) | 85(5) | 42 | 16 | |
| VZ Sex (abs) | 51994.727(5) | 0.1489(15) | 42(10) | 33 | 22 | |
| NSVS 1057 (abs) | 54277.7603(16) | 0.3763076(11) | 127(4) | 46 | 12 | |
| NSVS 1057 (emn) | 54297.509(3) | 0.376312(4) | 107(4) | 54 | 15 | |
| NSVS 1057 | 0.3763079(11) | |||||
| V478 Her (abs) | 53182.904(7) | 0.629049(5) | 138(10) | 51 | 41 | |
| V478 Her (emn) | 53182.688(12) | 0.629048(14) | 146(16) | 135 | 70 | |
| V1059 Sgr (emn) | 54648.932(3) | 0.2861(7) | 138(11) | 53 | 36 | |
| V1082 Sgr (abs) | 53562.065(12) | 0.867547(19) | 55(5) | 101 | 17 | |
| FO Aql | 54277.9139(16) | 0.217735(3) | 96(6) | 31 | 12 | |
| V587 Lyr (abs) | 53907.941(4) | 0.2750(10) | 81(7) | 15 | 16 | |
| V587 Lyr (emn) | 53907.813(5) | 0.2731(10) | 144(15) | 15 | 32 | |
| V587 Lyr | 0.2740(7) | |||||
| V792 Cyg (emn) | 54302.618(4) | 0.29715(12) | 118(9) | 28 | 24 | |
| V792 Cyg (abs) | 54300.083(2) | 0.29722(19) | 132(8) | 19 | 18 | |
| V792 Cyg | 0.29717(10)ccThis period reflects a particular choice of long-term cycle count, which remains somewhat ambiguous. See the text discussion for this star. | |||||
| V795 Cyg (emn) | 54296.736(2) | 0.181299(17) | 90(6) | 71 | 21 | |
| V811 Cyg (emn) | 54282.715(2) | 0.15656(4) | 115(13) | 45 | 31 | |
| V542 Cyg (emn) | 53907.738(3) | 0.1815(5) | 88(8) | 20 | 17 | |
| PQ Aql (emn) | 54282.002(3) | 0.24675(4) | 147(9) | 50 | 35 | |
| PQ Aql (abs) | 54281.885(7) | 0.2470(3) | 155(23) | 25 | 62 | |
| PQ Aql | 0.24675(4) | |||||
| V516 Cyg (emn) | 54337.0034(13) | 0.1712(4) | 88(5) | 51 | 15 | |
| VZ Aqr (emn) | 53625.867(2) | 0.1606(3) | 44(5) | 63 | 13 | |
| RX 2133 (emn) | 53074.033(3) | 0.297431(5) | 69(5) | 49 | 10 |
Note. — Parameters of least-squares sinusoid fits to the radial velocities, of the form . Where both emission and absorption velocities are available, the period quoted is the weighted average of the periods derived from separate fits to the two data sets, and the period is only given on the first line.
| Star | Type | Synthetic | Assumed aaNote carefully that these masses are not measured, but are estimates guided by the models of Baraffe & Kolb (2000). They are used only to constrain , which depends only on the cube root of , so this does not contribute substantially to the error budget. | Deduced | bbAbsolute visual magnitude inferred for the secondary alone, on the basis of surface brightness and Roche lobe size (see text.) | Distance | |
|---|---|---|---|---|---|---|---|
| (mag) | () | () | (mag) | (mag) | (pc) | ||
| IPHAS J0345 | K5.5 1.5 | ||||||
| V1062 Tau | K5 2 | ||||||
| V344 Ori | M3 0.75 | ||||||
| VZ Sex | M1 0.75 | ||||||
| NSVS 1057+09 | K4.5 2 | ||||||
| V478 Her | K5 2 | ||||||
| V1082 Sgr | K4 0.2 | ||||||
| FO Aql | M2 1.5 | ||||||
| V587 Lyr | K7 1.5 | ||||||
| V792 Cyg | K5 2 | ||||||
| V795 Cyg | M3.5 1.3 | ||||||
| PQ Aql | M1.5 1.0 | ||||||
| VZ Aqr | M2.0 1.5 |