Evolution of Dust Temperature of Galaxies through Cosmic Time as seen by Herschel ††thanks: Herschel is an ESA space observatory with science instruments provided by European-led Principal Investigator consortia and with important participation from NASA.
Abstract
We study the dust properties of galaxies in the redshift range observed by the Herschel Space Observatory in the field of the Great Observatories Origins Deep Survey-North as part of PEP and HerMES key programmes. Infrared (IR) luminosity () and dust temperature () of galaxies are derived from the spectral energy distribution (SED) fit of the far-infrared (FIR) flux densities obtained with PACS and SPIRE instruments onboard Herschel. As a reference sample, we also obtain IR luminosities and dust temperatures of local galaxies at using AKARI and IRAS data in the field of the Sloan Digital Sky Survey. We compare the relation between the two samples and find that: the median of Herschel-selected galaxies at 0.5 with 5, appears to be 2–5 K colder than that of AKARI-selected local galaxies with similar luminosities; and the dispersion in for high- galaxies increases with due to the existence of cold galaxies that are not seen among local galaxies. We show that this large dispersion of the relation can bridge the gap between local star-forming galaxies and high- submillimeter galaxies (SMGs). We also find that three SMGs with very low ( K) covered in this study have close neighbouring sources with similar 24-m brightness, which could lead to an overestimation of FIR/(sub)millimeter fluxes of the SMGs.
keywords:
galaxies: evolution – galaxies: formation – galaxies: general – galaxies: high-redshift – galaxies: starburst – infrared: galaxies1 Introduction
Understanding star formation (SF) mechanisms in galaxies and how star formation rate (SFR) of galaxies evolves through cosmic time are key issues in the study of galaxy formation and evolution. The SFR is closely related to dust properties such as temperature (), mass, opacity, emissivity, and spatial extent. In order to investigate dust properties of galaxies, it is important to obtain data covering the complete infrared (IR) wavelength range that includes both the “Wien” and “Rayleigh-Jeans” sides of the peak of the IR spectral energy distribution (SED). Thanks to the advent of the Herschel Space Observatory (Pilbratt et al., 2010) with its very wide wavelength coverage (m), we are now able to study complete IR SEDs of high- galaxies at .
The “Rayleigh-Jeans” side of the IR SED of a galaxy is crucial for the study of dust properties, but up to now available photometric data for high- galaxies have been limited to a small number of wavelength windows and to small regions in the sky. Despite the modest wavelength coverage of IR SEDs for high- galaxies, it was suggested that luminous infrared galaxies (LIRGs; ) and ultraluminous infrared galaxies (ULIRGs; ) at high redshifts may be colder than their local counterparts (e.g., Rowan-Robinson et al. 2004, 2005; Sajina et al. 2006; Symeonidis et al. 2009; Seymour et al. 2010; see also Muzzin et al. 2010). For example, Symeonidis et al. (2009) found that the IR SEDs of high- galaxies, on average, are peaked at longer wavelengths than those of local galaxies by comparing Spitzer 70-m-selected galaxies at with IRAS 60-m-selected galaxies at . They also found that the peak of IR SEDs for local galaxies is shifted to the shorter wavelengths as IR luminosity () increases, while the peak of IR SEDs for high- galaxies is located at a wider wavelength range compared to local galaxies and varies little with . However, Magnelli et al. (2009), using the Spitzer data in the fields of Great Observatories Origins Deep Survey (GOODS; Dickinson et al. 2003) and Far Infrared Deep Extragalactic Legacy survey (FIDEL), suggested that IR SEDs of high- galaxies at are not significantly different from those of local galaxies. Several studies have also been carried out which suggest that the apparent change with redshift is mainly a selection effect (e.g., Pope et al. 2006; Chapin et al. 2010).
It certainly seems that at high redshifts there are much colder populations of galaxies than local galaxies with similar IR luminosities [e.g., (sub)millimeter galaxies (SMGs), Blain et al. 2002; Chapman et al. 2005; Pope et al. 2006; Kovács et al. 2006; Huynh et al. 2007; Coppin et al. 2008; Clements et al. 2008]. The relation between IR luminosity and dust temperature has been used as a useful tool in order to understand the connection between galaxy populations such as (U)LIRGs and SMGs (Dunne et al., 2000; Chapman et al., 2003, 2005; Kovács et al., 2006; Chanial et al., 2007; Yang et al., 2007; Younger et al., 2009; Dye et al., 2009; Chapin et al., 2009, 2010; Clements et al., 2010; Magdis et al., 2010a). Interestingly, in the plane, SMGs form a separate locus from the (U)LIRGs, which can suggest a different origin between the two.
In this paper, we investigate the IR SEDs and the dust properties of high- galaxies by taking advantage of the wide wavelength coverage (m) of the Photodetector Array Camera (PACS; Poglitsch et al. 2010) and Spectral and Photometric Imaging Receiver (SPIRE; Griffin et al. 2010) instruments onboard Herschel. In order to study how dust properties of high- galaxies are different from those of their local counterparts, we construct a sample of galaxies at that were observed by the AKARI telescope (Murakami et al., 2007). The AKARI all-sky survey data contain flux density measurements up to 160 m, which can probe the long-wavelength side of the peak of IR SEDs of local galaxies in a way similar to that of Herschel for high- galaxies. Throughout, we adopt and a flat CDM cosmology with density parameters and .
2 Observations and Data
GOODS-North (hereafter GOODS-N) was observed by Herschel as part of the Guaranteed Time Key Programmes PACS Extragalactic Probe (PEP111http://www.mpe.mpg.de/ir/Research/PEP) and Herschel Multi-tiered Extragalactic Survey (HerMES222http://hermes.sussex.ac.uk; Oliver et al. 2010, in prep.). Source extraction on these PACS and SPIRE images was performed at the prior positions of Spitzer 24-m-selected sources, and details are described in Berta et al. (2010), Magnelli et al. (2010) and Roseboom et al. (2010). PACS measurements are above the confusion limit, and we used flux densities in PACS bands down to 3 limits of 3 and 5.7 mJy at 100 and 160 m, respectively (Berta et al., 2010). SPIRE measurements are used down to 5 limits of 4.4, 4.8 and 7.6 mJy at 250, 350 and 500 m, respectively. It is noted that these measurements lie below the 1- SPIRE confusion limit of 5.8, 6.3, 6.8 mJy (Nguyen et al., 2010). However, this limit is a spatially averaged statistical limit which considers that galaxies are homogeneously distributed in the field and all affected in the same way by close neighbours. In this study, we flag galaxies more “isolated” than others for which SPIRE flux densities can potentially be more robust by using the higher spatial resolution 24 m images (to be explained in §3).
By combining these catalogues with the existing multi-wavelength data, we made a band-merged catalogue of IR sources having flux density measurements at Spitzer MIPS 24 and 70 m, Herschel PACS 100 and 160 m, and Herschel SPIRE 250, 350 and 500 m (see Elbaz et al. 2010 for details). For 493 galaxies detected in at least one out of the five PACS/SPIRE bands, we computed the IR luminosity using the SED models of Chary & Elbaz (2001, CE01) by allowing renormalization of the templates. The SED fit was applied to the flux densities at m, and for all 493 galaxies was calculated.
In order to determine the dust temperatures, we fit the observational data with a modified black body (MBB) model by fixing the emissivity parameter to (Hildebrand, 1983; Gordon et al., 2010). We used only the galaxies that satisfy the following conditions:
-
1.
there should be at least one flux measurement shortwards to the FIR peak (i.e. where is the rest-frame, peak wavelength of the best-fit CE01 SED model and is the rest-frame wavelength of the observed data);
-
2.
there should be at least one flux measurement longwards to the FIR peak (i.e. ); and
-
3.
the FIR SED should be physical (convex, not concave), i.e. we reject galaxies with ( or ) and ( or ), or ( or ) and .
The above criteria ensure a well-sampled SED around the peak of the FIR emission, and the wavelength cut of is introduced to reduce the contribution of warm dust (i.e. emission from very small grains). For these galaxies, we fit the flux densities at using the MBB model. We then select galaxies having flux measurements on both sides of the peak for the best-fit MBB model, and secure a final sample of 140 galaxies. Uncertainties of and were computed by randomly selecting flux densities at each band within the associated error distribution (assumed to be Gaussian) and then re-fitting. It is noted that we checked how measurements of galaxies are affected if we remove some data points for the fit. We found that becomes systematically lower/higher if you use only data points shortwards/longwards to the FIR peak. However, does not change systematically even if you remove some data points at for the fit as long as you have measurements on both sides of the peak wavelength.
For local galaxies, we construct an IR catalogue by cross-correlating our IR sources with the galaxies in the redshift catalogue as follows. We use the IRAS Faint Sources Catalog – Version 2 (Moshir et al. 1992), which contains 173,044 sources with flux density measurements at 12, 25, 60 and 100 m. We also use the AKARI/Far-Infrared Surveyor (FIS; Kawada et al. 2007) all-sky survey Bright Source Catalogue (BSC333http://www.ir.isas.jaxa.jp/AKARI/Observation/PSC/ Public/RN/AKARI-FISBSCV1RN.pdf) ver. 1.0 that contains 427,071 sources over the whole sky, with measured flux densities at 65, 90, 140 and 160m. Among the measurements at IRAS and AKARI bands, we consider only the reliable444Flux quality flags are either ‘high’ or ‘moderate’ for IRAS sources and ‘high’ for AKARI sources. flux densities. For the redshift catalogue, we use a spectroscopic sample of galaxies in the Sloan Digital Sky Survey Data Release 7 (Abazajian et al., 2009, SDSS DR7) complemented by a photometric sample of galaxies whose redshift information is available in the literature (Hwang et al., 2010).

By adopting the same method applied to high- galaxies, we compute for the local galaxies by fitting the CE01 templates to the flux densities at m. For estimates, in addition to the conditions (i) and (ii) used for high- galaxies, we use only sources detected at 140 or 160 m. This condition ensures a fair comparison with the high- samples as in both samples have flux density measurements longwards to the FIR peak. Since IRAS 60 m and AKARI 65 m (or IRAS 100 m and AKARI 90 m) partially overlap, we use only IRAS data ( and ) for the fit to avoid over-weighting when both IRAS and AKARI flux densities are measured. Finally, we use only the galaxies having flux density measurements on both sides of the peak of the best-fit MBB model.
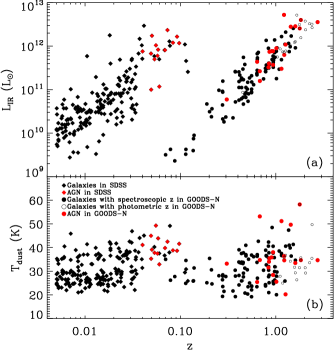
Fig. 1 represents example SEDs for a high- galaxy in GOODS-N and a local galaxy in SDSS with the best-fits CE01 and MBB models. In Fig. 2, we plot and for 140 high- and 190 local galaxies as a function of redshift, which shows that the two samples are distributed over similar ranges of and . The high- galaxies in GOODS-N are found at with and (K) (K), while the local galaxies in SDSS are in the range with and (K) (K).
3 Results
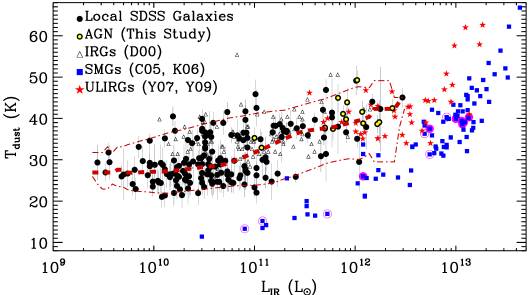
We show the relation between and for local and high- samples in Figs. 3 and 4, respectively. Fig. 3 shows the distribution of local galaxies in comparison with known ULIRGs and SMGs in the literature. We determine a smoothed median trend of as a function of for our local galaxies. Since the contribution of active galactic nuclei (AGN) to determining the median trend of for local and high- galaxies could be different, we exclude them when determining the median. We call AGN those sources whose optical spectral types are found to be Seyferts, low-ionization nuclear emission-line regions (LINERs) or composite galaxies in the emission line ratio diagram (Baldwin et al., 1981; Kewley et al., 2006). We classify only the galaxies at as AGN due to the problem of the small (3″) fixed-size aperture for SDSS spectroscopy (Kewley et al., 2006). It is seen that remains constant in the lower end of the luminosity range () and increases as increases. This trend has been indicated in the previous studies by a shift of the peak in the IR SED with increasing (Soifer et al. 1987, 1989; Chapman et al. 2003; Chapin et al. 2009; Symeonidis et al. 2009; see also Amblard et al. 2010). At (L⊙), our samples are smoothly connected to the locus of known ULIRGs at intermediate/high redshifts. We also note that changing AGN selection criteria has a small effect on our results.
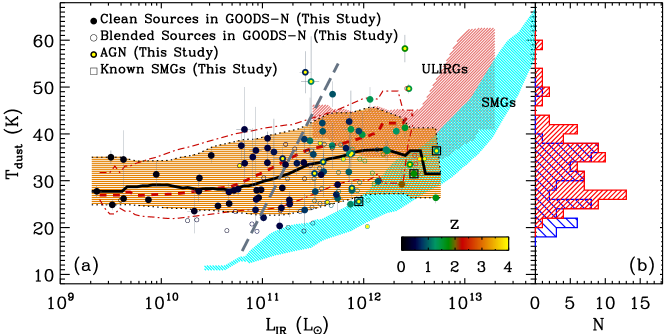
In Fig. 4(a), we plot high- galaxies along with the loci of ULIRGs, SMGs and local SDSS galaxies. The median trend of for high- galaxies is also determined by excluding those galaxies hosting X-ray selected AGN as well as possibly blended sources. AGN have either LX[0.5–8.0 keV] 31042 ergs s-1, a hardness ratio (ratio of the counts in the 2–8 keV to 0.5–2 keV passbands) greater than 0.8, N1022 cm-2, or broad/high-ionization AGN emission lines (Bauer et al., 2004). We regard a galaxy as ‘blended’ if it has at least one neighbouring source within one beam FWHM of the galaxy position at 24 m and SPIRE images ( for 24m and 250 m, for 350 m, and for 500 m). For the 24-m image, the criterion is at least two neighbouring sources instead of one. In addition, we require that the flux density of a neighbouring source should be larger than 50 of that of the galaxy. Among 140 high- galaxies, we have 84 ‘clean’ and 56 ‘blended’ galaxies (see also Brisbin et al. 2010 for a purity index that is a measure of blending of a galaxy). Fig. 4(b) represents the distribution of for ‘clean’ and ‘blended’ galaxies including AGN. This shows that only ‘blended’ galaxies have several cold galaxies with K, while ‘clean’ galaxies do not (to be discussed in detail in §4.2).
In Fig. 4(a), the median trend of for high- galaxies also appears fairly constant at low luminosities, but increases as increases at higher luminosities. By comparing with local galaxies, we see that the median trend of for Herschel-selected high- galaxies at becomes smaller than that for AKARI-selected low- galaxies by K at high luminosities (). Note that this does not necessarily mean that high- galaxies are systematically colder than local galaxies with similar luminosities (to be discussed in §4.1). It is also seen that scatter increases by about 5 K in the sense that the upper envelope for high- galaxies is similar to that of local galaxies, while the lower envelope for high- galaxies stretches below. These results are consistent with the results based on the peak position of the IR SEDs (Symeonidis et al., 2009). Interestingly, the high- galaxies with low fill the gap between local star-forming galaxies and high- SMGs in the plane. It is also interesting that for AGN follows a similar trend as for star-forming galaxies, which indicates that the star formation of galaxies having AGN does not significantly differ from that of normal star-forming galaxies seen in the FIR regime, where SF dominates the IR emission of AGN (Elbaz et al., 2010; Shao et al., 2010; Hatziminaoglou et al., 2010).
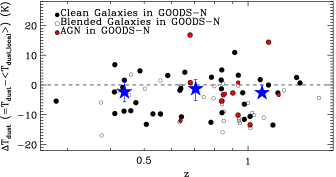
To investigate how for high- galaxies evolves with redshift compared to local galaxies with similar , in Fig. 5, we plot the deviation of for high- LIRGs from the median trend (, thick dashed line in Fig. 4a) of for local LIRGs () as a function of redshift. This shows that is negative, on average, which indicates that Herschel-selected high- LIRGs at appear to be colder than AKARI-selected local LIRGs. changes little with redshift, but it is difficult to draw any strong conclusions due the small sample size. Since the deeper observation of GOODS fields will be conducted in PEP and in the GOODS-Herschel key programme (PI: D. Elbaz), the future Herschel data will help us to address this issue with a larger number of galaxies up to higher redshift.
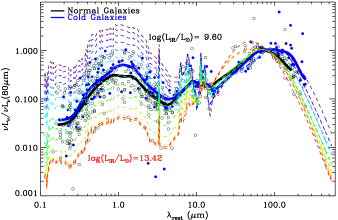
To investigate how the SEDs of high- galaxies are different from the local SED templates of CE01, we plot the average SEDs (from UV to FIR) of cold and normal LIRGs at high redshifts in comparison with the local SED templates of CE01 in Fig. 6. The high- galaxies are classified into three groups by comparing their values with the median trend of for local galaxies (thick dashed line in Fig. 4a) : cold (those with values less than the lower envelope of local galaxies); normal (those with values within the envelopes of local galaxies); and warm (those with values larger than the upper envelope of local galaxies). Fig. 6 shows that the peak wavelength of the FIR SED for cold galaxies is larger than that for normal galaxies as expected. The average FIR SED of normal galaxies appears to match well with the CE01 template of similar luminosity, but that of cold galaxies is matched with roughly 80 times less luminous template, even if the median of normal and cold galaxies are similar ( and for normal and cold galaxies, respectively).
We wish to emphasize that the longer-wavelength side of the peak of the FIR SED for cold galaxies could be affected by blending at long wavelengths. Since the beam FWHM gets larger as wavelength increases, the flux densities at longer wavelength can be systematically overestimated if there is more than one source within the resolution limit. In addition, galaxies having neighbouring sources seem to have low compared to ‘clean’ galaxies, as seen in Fig. 4(b), which suggests that we should be cautious when we measure using multi-wavelength data with different resolutions. We have calculated the fraction of blended galaxies among normal and cold galaxies, and find values of 34 and 58, respectively. We have tried to eliminate such problem in our samples by identifying blended galaxies, and by using the FIR source catalogue based on prior extraction (Berta et al., 2010; Roseboom et al., 2010). However, since we may not have completely deblend all sources and do not account for galaxies whose neighbours are less bright than 50 of the target galaxy, there could be a remaining contribution to the FIR flux of cold galaxies due to this effect.
Interestingly, the cold galaxies are brighter than the normal galaxies in the optical bands. This could imply that there is a correlation between and the optical properties such as galaxy morphology, colour, or size. Thus, the study of the relation between optical properties and may provide us useful hints for the origin of the cold galaxies (Le Floc’h et al. 2010, in prep.).
4 Discussion
4.1 Selection Effects
The AKARI data contain flux density measurements up to 160 m ( 157 m with a median redshift of for local samples), while Herschel data have measurements up to 500 m ( 330 m with a median redshift of for high- samples). Therefore, the difference between the two samples seen in Fig. 4(a) could be affected by the difference in selection effects. For example, Chapin et al. (2010) found results similar to this study, in the sense that the dust temperatures of BLAST-selected (250500 m) high- galaxies at are systematically cooler than IRAS 60-m-selected local galaxies. When they account the difference in selection effects between the two samples, they find no evidence for evolution of . On the other hand, if we consider Herschel-selected local galaxies () observed in the Herschel-ATLAS key programme (Eales et al., 2010), we can find cold galaxies with K that are not seen in our local sample (see Fig. 2 in Amblard et al. 2010). This seems to support the idea that the different selection effects between local and high- galaxies can explain the difference. However, note that there are few local galaxies with () in the sample of Amblard et al. (2010, see their Fig. 3), which are crucial for understanding the difference between local and high- galaxies (see Fig. 4a). Since a wider area will eventually be covered by the Herschel-ATLAS program, the upcoming data will help us to address this issue.
To investigate the effect of the different selection effect (i.e. observed wavelength and detection limit) on the difference of between local and high- galaxies, and on the existence of cold galaxies ( K and ) that are not seen in the local sample but seen in the high- sample, we made a following experiment: we move the best-fit SEDs of high- galaxies to local universe, and check whether they can be observed with AKARI detection limit used for local galaxies in this study. If we move all 140 high- galaxies in Fig. 4 to that is a median redshift of local galaxies, the expected flux densities at 140 and 160 m for more than 99% galaxies are above the minimum values of flux densities for our local samples ( and Jy), which means that no galaxies would be missed with the AKARI detection limit. This confirms that the existence of cold galaxies at high redshifts that are not seen in the local sample, is not simply because of the different selection effect.
For the extreme case, if we move high- galaxies to that is a maximum redshift of local galaxies, 67% of the galaxies would be observed. The effect of the AKARI detection limits in the plane is shown as a thick long-dashed line in Fig. 4. Galaxies lying on the right of this line would be detected. The steep slope of the line, indicates that the AKARI detection limit does not affect distribution significantly. Moreover, cold galaxies with K and are free from this selection effect. This again confirms that the existence of cold galaxies at high redshifts is not because of the difference in selection effects.
To check how measurements for our local galaxies become different if we had flux measurements at longer wavelengths (m) like for high- galaxies, we have re-estimated for 44 galaxies found in common between this study and Dunne et al. (2000, D00) by combining our flux densities with 850 m observations from D00. We found that the two estimates agree very well with a median difference of 0.2 K (rms scatter of 1.8 K). In addition, when we compare the observed 850 m flux density in D00 with the expected flux density from our best-fit MBB model without 850 m data, two flux densities agree well within the errors. These also indicate that estimates with AKARI bands are not biased toward high .
4.2 Cold Galaxies at high redshifts
for galaxies is a function of total SFR per unit dust mass, the dust emissivity, and the geometry, which are closely related to the global star formation efficiency (SFE). This SFE is known to be controlled by the gas density (Schmidt, 1959; Kennicutt, 1998), which is connected to the spatial extent of star-forming regions. Therefore, the existence of cold galaxies at high redshifts may imply that the spatial distribution of dust in these galaxies is more extended than that in local galaxies with similar . This is consistent with CO observational results for some high- galaxies (Tacconi et al. 2006; Iono et al. 2009; Daddi et al. 2010; Tacconi et al. 2010; Genzel et al. 2010; see also Kaviani et al. 2003). On the other hand, the existence of cold galaxies at high redshifts may indicate large dust masses for these galaxies compared to local galaxies. If we assume similar gas-to-dust ratios for local and high- galaxies at a given , the detection of a large gas content in high- galaxies compared to local galaxies could support our results (Tacconi et al., 2006, 2010; Daddi et al., 2010).
Interestingly, the cold galaxies at high redshifts () in Fig. 4(a), fill the gap between local star-forming galaxies and high- SMGs, connecting the two populations (see also Magdis et al. 2010b). It is noted that previous studies on measurement of SMGs were based on only a few photometric data points that cover only long-wavelength side of the thermal SEDs. Therefore, it is necessary to re-estimate for SMGs using Herschel data to check how the locus of SMGs in the plane changes (Magnelli et al. 2010; Chanial et al. 2010, in prep.; Chapman et al. 2010, in prep.). There are 13 SMGs in common between this study and Chapman et al. (2005). Among them, we have three SMGs with measured in this study ( for the other ten galaxies are not measured because they did not fulfil the selection criteria in §2 due to the low signal-to-noise ratios in some bands), and show them as squares in Fig. 4(a). They are found to be in the locus of known SMGs, indicating that our measurements are consistent with those with ground-based submillimeter studies. However, we can not determine for SMGs at , which is important for understanding the connection between local galaxies and SMGs (discussed in Magnelli et al. 2010).
For these 13 SMGs, we have checked the ‘clean’ flag defined in this study, and show them in Fig. 3: there are seven ‘clean’ and six ‘blended’ galaxies. The three SMGs with values measured in this study, are found to be ‘clean’ galaxies. However, other three SMGs with K in Fig. 3 are found to be ‘blended’ galaxies. We have checked whether or not the redshifts of neighbouring sources are different from these SMGs, and found that the redshifts of close neighbours for two SMGs (J and J) are not similar to their companion SMGs. This indicates that the low of SMGs could be caused by an overestimation of the FIR/(sub)millimeter fluxes due to blending problems. One SMG (J at ) has a close neighbour at that is separated by ( kpc), which suggests that galaxies in an interacting pair could be colder than isolated galaxies (e.g., Tacconi et al. 2006). This issue – the relation between the galaxy merging stage and – needs to be investigated with a large number of galaxies.
Acknowledgments
PACS has been developed by a consortium of institutes led by MPE (Germany) and including UVIE (Austria); KU Leuven, CSL, IMEC (Belgium); CEA, LAM (France); MPIA (Germany); INAFIFSI/OAA/OAP/OAT, LENS, SISSA (Italy); IAC (Spain). This development has been supported by the funding agencies BMVIT (Austria), ESA-PRODEX (Belgium), CEA/CNES (France), DLR (Germany), ASI/INAF (Italy), and CICYT/MCYT (Spain). SPIRE has been developed by a consortium of institutes led by Cardiff University (UK) and including Univ. Lethbridge (Canada); NAOC (China); CEA, LAM (France); IFSI, Univ. Padua (Italy); IAC (Spain); SNSB (Sweden); Imperial College London, RAL, UCL-MSSL, UKATC, Univ. Sussex (UK); and Caltech, JPL, NHSC, Univ. Colorado (USA). This development has been supported by national funding agencies: CSA (Canada); NAOC (China); CEA, CNES, CNRS (France); ASI (Italy); MCINN (Spain); Stockholm Observatory (Sweden); STFC (UK); and NASA (USA). The HerMES data was accessed through the HeDaM database (http://hedam.oamp.fr) operated by CeSAM and hosted by the Laboratoire d’Astrophysique de Marseille. This research is based on observations with AKARI, a JAXA project with the participation of ESA. MGL was supported by the a National Research Foundation of Korea (NRF) grant funded by the Korea Government (MEST) (grant no. R01-2007-000-20336-0).
References
- Abazajian et al. (2009) Abazajian K. N., et al., 2009, ApJS, 182, 543
- Amblard et al. (2010) Amblard A., et al., 2010, A&A, in press (arXiv:1005.2412)
- Baldwin et al. (1981) Baldwin J. A., Phillips M. M., Terlevich R., 1981, PASP, 93, 5
- Bauer et al. (2004) Bauer F. E., Alexander D. M., Brandt W. N., Schneider D. P., Treister E., Hornschemeier A. E., Garmire G. P., 2004, AJ, 128, 2048
- Berta et al. (2010) Berta S., et al., 2010, A&A, in press (arXiv:1005.1073)
- Blain et al. (2002) Blain A. W., Smail I., Ivison R. J., Kneib J., Frayer D. T., 2002, Phys. Rep., 369, 111
- Brisbin et al. (2010) Brisbin D., et al., 2010, MNRAS, submitted
- Chanial et al. (2007) Chanial P., Flores H., Guiderdoni B., Elbaz D., Hammer F., Vigroux L., 2007, A&A, 462, 81
- Chapin et al. (2010) Chapin E. L., et al., 2010, MNRAS, submitted (arXiv:1003.2647)
- Chapin et al. (2009) Chapin E. L., Hughes D. H., Aretxaga I., 2009, MNRAS, 393, 653
- Chapman et al. (2005) Chapman S. C., Blain A. W., Smail I., Ivison R. J., 2005, ApJ, 622, 772
- Chapman et al. (2003) Chapman S. C., Helou G., Lewis G. F., Dale D. A., 2003, ApJ, 588, 186
- Chary & Elbaz (2001) Chary R., Elbaz D., 2001, ApJ, 556, 562
- Clements et al. (2010) Clements D. L., Dunne L., Eales S., 2010, MNRAS, 403, 274
- Clements et al. (2008) Clements D. L., et al., 2008, MNRAS, 387, 247
- Coppin et al. (2008) Coppin K., et al., 2008, MNRAS, 384, 1597
- Daddi et al. (2010) Daddi E., et al., 2010, ApJ, 713, 686
- Dickinson et al. (2003) Dickinson M., Giavalisco M., GOODS Team 2003, in R. Bender & A. Renzini ed., The Mass of Galaxies at Low and High Redshift The Great Observatories Origins Deep Survey. pp 324–+
- Dunne et al. (2000) Dunne L., Eales S., Edmunds M., Ivison R., Alexander P., Clements D. L., 2000, MNRAS, 315, 115
- Dye et al. (2009) Dye S., et al., 2009, ApJ, 703, 285
- Eales et al. (2010) Eales S., et al., 2010, PASP, in press (arXiv:0910.4279)
- Elbaz et al. (2010) Elbaz D., et al., 2010, A&A, in press (arXiv:1005.2859)
- Genzel et al. (2010) Genzel R., et al., 2010, MNRAS, in press (arXiv:1003.5180)
- Gordon et al. (2010) Gordon K. D., et al., 2010, A&A, in press (arXiv:1005.3123)
- Griffin et al. (2010) Griffin M., et al., 2010, A&A, in press
- Hatziminaoglou et al. (2010) Hatziminaoglou E., et al., 2010, A&A, in press (arXiv:1005.2192)
- Hildebrand (1983) Hildebrand R. H., 1983, QJRAS, 24, 267
- Huynh et al. (2007) Huynh M. T., Pope A., Frayer D. T., Scott D., 2007, ApJ, 659, 305
- Hwang et al. (2010) Hwang H. S., David E., Lee J. C., Jeong W.-S., Park C., Lee M. G., Lee H. M., 2010, A&A, in press (arXiv:1006.2166)
- Iono et al. (2009) Iono D., et al., 2009, ApJ, 695, 1537
- Kaviani et al. (2003) Kaviani A., Haehnelt M. G., Kauffmann G., 2003, MNRAS, 340, 739
- Kawada et al. (2007) Kawada M., et al., 2007, PASJ, 59, 389
- Kennicutt (1998) Kennicutt Jr. R. C., 1998, ApJ, 498, 541
- Kewley et al. (2006) Kewley L. J., Groves B., Kauffmann G., Heckman T., 2006, MNRAS, 372, 961
- Kovács et al. (2006) Kovács A., Chapman S. C., Dowell C. D., Blain A. W., Ivison R. J., Smail I., Phillips T. G., 2006, ApJ, 650, 592
- Magdis et al. (2010a) Magdis G. E., et al., 2010a, ApJ, in press (arXiv:1007.3846)
- Magdis et al. (2010b) Magdis G. E., et al., 2010b, MNRAS, in press (arXiv:1007.4900)
- Magnelli et al. (2009) Magnelli B., Elbaz D., Chary R. R., Dickinson M., Le Borgne D., Frayer D. T., Willmer C. N. A., 2009, A&A, 496, 57
- Magnelli et al. (2010) Magnelli B., et al., 2010, A&A, in press (arXiv:1005.1154)
- Moshir et al. (1992) Moshir M., Kopman G., Conrow T. A. O., 1992, IRAS Faint Source Survey, Explanatory supplement version 2
- Murakami et al. (2007) Murakami H., et al., 2007, PASJ, 59, 369
- Muzzin et al. (2010) Muzzin A., van Dokkum P., Kriek M., Labbe I., Cury I., Marchesini D., Franx M., 2010, ApJ, submitted (arXiv:1003.3479)
- Nguyen et al. (2010) Nguyen H. T., et al., 2010, A&A, in press (arXiv:1005.2207)
- Pilbratt et al. (2010) Pilbratt G. L., et al., 2010, A&A, in press
- Poglitsch et al. (2010) Poglitsch A., et al., 2010, A&A, in press (arXiv:1005.1487)
- Pope et al. (2006) Pope A., et al., 2006, MNRAS, 370, 1185
- Roseboom et al. (2010) Roseboom I. G., et al., 2010, MNRAS, submitted
- Rowan-Robinson et al. (2004) Rowan-Robinson M., et al., 2004, MNRAS, 351, 1290
- Rowan-Robinson et al. (2005) Rowan-Robinson M., et al., 2005, AJ, 129, 1183
- Sajina et al. (2006) Sajina A., Scott D., Dennefeld M., Dole H., Lacy M., Lagache G., 2006, MNRAS, 369, 939
- Schmidt (1959) Schmidt M., 1959, ApJ, 129, 243
- Seymour et al. (2010) Seymour N., Symeonidis M., Page M. J., Huynh M., Dwelly T., McHardy I. M., Rieke G., 2010, MNRAS, 402, 2666
- Shao et al. (2010) Shao L., et al., 2010, A&A, in press (arXiv:1005.2562)
- Soifer et al. (1989) Soifer B. T., Boehmer L., Neugebauer G., Sanders D. B., 1989, AJ, 98, 766
- Soifer et al. (1987) Soifer B. T., Sanders D. B., Madore B. F., Neugebauer G., Danielson G. E., Elias J. H., Lonsdale C. J., Rice W. L., 1987, ApJ, 320, 238
- Symeonidis et al. (2009) Symeonidis M., Page M. J., Seymour N., Dwelly T., Coppin K., McHardy I., Rieke G. H., Huynh M., 2009, MNRAS, 397, 1728
- Tacconi et al. (2006) Tacconi L. J., et al., 2006, ApJ, 640, 228
- Tacconi et al. (2010) Tacconi L. J., et al., 2010, Nat, 463, 781
- Yang et al. (2007) Yang M., Greve T. R., Dowell C. D., Borys C., 2007, ApJ, 660, 1198
- Younger et al. (2009) Younger J. D., et al., 2009, ApJ, 704, 803