The Necklace: equatorial and polar outflows from the binary central star of the new planetary nebula IPHASXJ194359.5+170901
Abstract
IPHASXJ194359.5+170901 is a new high-excitation planetary nebula with remarkable characteristics. It consists of a knotty ring expanding at a speed of 28 km s-1, and a fast collimated outflow in the form of faint lobes and caps along the direction perpendicular to the ring. The expansion speed of the polar caps is 100 km s-1, and their kinematical age is twice as large as the age of the ring.
Time-resolved photometry of the central star of IPHASXJ194359.5+170901 reveals a sinusoidal modulation with a period of 1.16 days. This is interpreted as evidence for binarity of the central star, the brightness variations being related to the orbital motion of an irradiated companion. This is supported by the spectrum of the central star in the visible range, which appears to be dominated by emission from the irradiated zone, consisting of a warm (6000-7000 K) continuum, narrow C III, C IV, and N III emission lines, and broader lines from a flat H I Balmer sequence in emission.
IPHASXJ194359.5+170901 helps to clarify the role of (close) binaries in the formation and shaping of planetary nebulae. The output of the common-envelope evolution of the system is a strongly flattened circumstellar mass deposition, a feature that seems to be distinctive of this kind of binary system. Also, IPHASXJ194359.5+170901 is among the first post-CE PNe for which the existence of a high-velocity polar outflow has been demonstrated. Its kinematical age might indicate that the polar outflow is formed before the common-envelope phase. This points to mass transfer onto the secondary as the origin, but alternative explanations are also considered.
keywords:
planetary nebulae: individual: IPHASXJ194359.5+170901– binaries: close – stars: winds, outflows – ISM: jets and outflows – ISM: abundances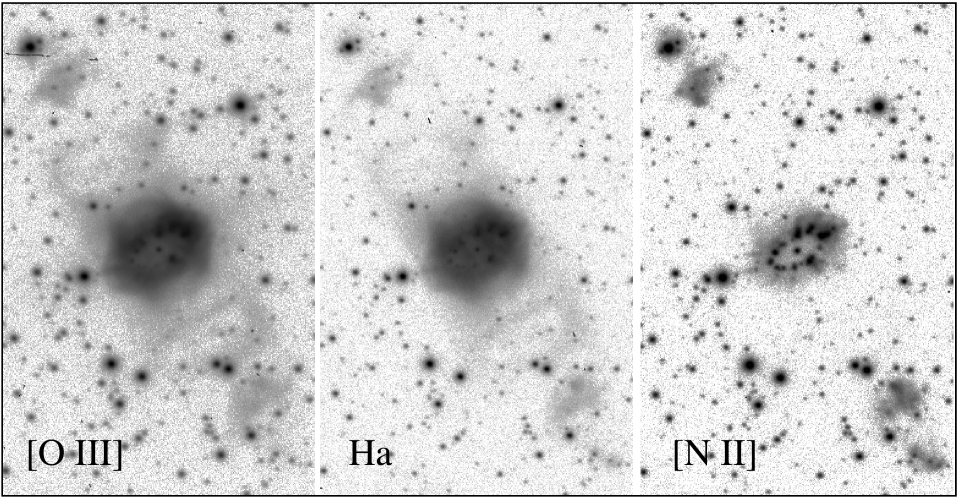
1 Introduction
The IPHAS H survey of the Northern Galactic plane (Drew et al., 2005) provides a wealth of new information about emission-line sources. Among them, a large number of planetary nebulae (PNe) are being discovered (Viironen et al., 2009; Sabin et al., 2010). Two main objectives can be generally pursued using the IPHAS data on PNe. The first is to determine the global properties of PNe, such as their population size in the Galactic Plane and related issues (stellar death rate, global yields, relative contribution of the different morphological classes and their distribution in the disc, etc.). The second objective is to find and study new objects belonging to rare morphological or chemical sub-classes, or that have other outstanding characteristics. IPHASXJ194359.5+170901 is one of these distinctive new PNe. It is among the brightest new IPHAS PNe in the list of Sabin et al. (2010), and its characteristic morphology made it a prime candidate in our ongoing programme looking for binary central stars based on the emerging morphological trends identified with nebulae around close binaries (Miszalski et al., 2009b). In the following, we present imaging, spectroscopy, and time-resolved photometry which allow us to determine geometrical, kinematical, physical and chemical properties of the nebula, and to reveal the existence of a close binary central star. This provides a new clarifying example of the relevance of interactions in close binaries for the shaping of PNe – an important and long standing problem in the field (see De Marco, 2009).
2 Observations
IPHASXJ194359.5+170901 was discovered as a new candidate PN from images of the IPHAS survey obtained on 2005 (Sabin et al. 2010). Deeper and higher resolution images were secured at the 2.6m Nordic Optical Telescope (NOT) and the ALFOSC spectro-imager on la Palma on 3 September 2007. The filter central wavelengths and full width at half maximum (FWHM), and the corresponding selected nebular emission lines, were: 6589/9 Å ([N II] 6583), 6568/8 Å ( 6563) and 5007/30 Å ([O III] 5007). Note that the red filters are narrow enough that no contamination of the [N II] lines occurs in the filter and vice versa. In each filter, the exposure time was 20 min. The spatial scale of the ALFOSC instrument is pix-1, and seeing was FWHM for the and [N II] images, and for [O III]. The NOT images are shown in Fig. 1.
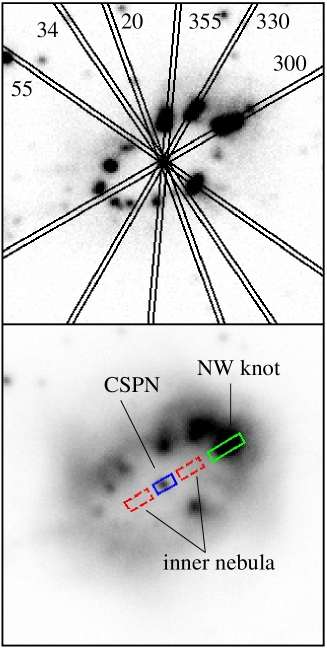
With the same instrumentation, medium-resolution long-slit spectra centred on were obtained on the same night and in the following one. Grism #17 was used, which provides a spectral dispersion of 0.25 Å pix-1, a resolution of 0.7 Å (FWHM) with the adopted slit width of , and a coverage from 6375 Å to 6745 Å. The slit was positioned through the central star of the nebula at several position angles, namely at P.A.=20∘, 34∘, 55∘, 300∘, 330∘, and 355∘, in order to map the knotty inner ring-like structure (Fig. 2, upper panel). Exposure times were 10 min, except for the spectrum through P.A.=+34∘, where it was 1 hour.
A lower resolution spectrum of the nebula and its central star was obtained on the 17 July 2007 with the 4.2m WHT telescope and the double-arm ISIS spectrograph. The long slit of ISIS was opened to 1 arcsec width and positioned at P.A.=121∘, roughly along the major axis of the ring, passing through the central star and the brightest knot on its NW side (Fig. 2, lower panel). In the blue arm of ISIS, grating R300B was used, providing a dispersion of 0.86 Å pix-1, a resolution of 3 Å, and a spectral coverage from 3200 to 5400 Å. In the red arm, grating R158R gave a dispersion of 1.82 Å pix-1, a resolution of 6 Å, and a spectral coverage from 5400 to 10000 Å. Note however that due to the dichroic used to split the blue and red light, and to vignetting inside the spectrograph, flux calibration is uncertain in the range from 5300 to 5600 Å, and above 9200 Å. Total exposure times were 40 and 60 minutes in the blue and red arms, respectively. Seeing was 0′′.8. Several spectrophotometric standards from Oke (1990) were observed during the night, while arcs were only obtained during daytime, a fact that limits the precision of the wavelength calibration.
Time-resolved photometry in the SDSS band of IPHASXJ194359.5+170901 was performed during 2009 with the 1.2m Mercator telescope and its MEROPE camera, the 2.5m Isaac Newton Telescope (INT) and its Wide Field Camera (WFC), and the 0.8m IAC80 and its CAMELOT camera. The time coverage of each set of images was different, while the individual exposure times were chosen to ensure a S/N120 on the integrated emission from the central star. In the case of the MERCATOR/MEROPE observations, the time coverage was split into two blocks separated by several hours to better sample variability. The log of the photometric observations can be found in Tab. 1. Magnitudes obtained with different telescope/filter combinations were matched to the INT SDSS photometric system using field stars. The data are listed in Tab. 2.
| Date | Instrum. | Filter | Exp. time | Coverage |
|---|---|---|---|---|
| (2009) | [sec] | [min] | ||
| Aug 25 | MEROPE | Cousins I | 200 | 225 |
| Aug 28 | MEROPE | Cousins I | 200 | 220 |
| Aug 31 | MEROPE | Cousins I | 200 | 260 |
| Sep 1 | MEROPE | Cousins I | 200 | 60+15 |
| Sep 2 | MEROPE | Cousins I | 200 | 75 |
| Sep 10 | CAMELOT | Johnson I | 600 | 90 |
| Oct 25 | WFC | SDSS i | 60 | 180 |
All data were reduced using standard routines in iraf.
| HJD | -mag | err |
|---|---|---|
| 2455069.452360 | 17.90 | 0.02 |
| 2455069.455140 | 17.91 | 0.02 |
| 2455069.457900 | 17.89 | 0.02 |
| 2455069.460670 | 17.87 | 0.02 |
| 2455069.463420 | 17.87 | 0.02 |
| 2455069.466190 | 17.86 | 0.02 |
| 2455069.468930 | 17.89 | 0.02 |
| 2455069.471730 | 17.87 | 0.02 |
| 2455069.535730 | 17.69 | 0.02 |
| 2455069.538470 | 17.69 | 0.02 |
| 2455069.541210 | 17.68 | 0.02 |
| 2455069.543990 | 17.70 | 0.02 |
| 2455069.546760 | 17.71 | 0.02 |
| …. |


3 Morphology, kinematics, geometry and orientation
The morphology of the nebula (Fig. 1) is similar in the H and [O III] emission: it consists of a diffuse, elliptical or perhaps spindle-like inner body, whose brightest regions are in the form of a knotty elliptical ring with a long axis of about 13 arcsec. Along the orthogonal direction, faint emission traces a roughly-cylindrical structure ending in two slightly brighter, irregular “polar” caps at about 1 arcmin from the central star. As typical of this kind of structure (Gonçalves et al., 2001), the ring’s knots and their faint outward tails, as well as the polar caps are most evident in the low-ionization [NII] emission. This striking [NII] morphology led to the object’s nickname, “the Necklace Nebula” (Sabin et al., 2010).
The kinematics and 3D structure of the nebula were studied by means of the Doppler shift of the [N II] 6583 line (which has a smaller thermal broadening than H) in the NOT spectra. The [N II] line-of-sight velocities at the position of the ring’s knots are well fit (Fig. 3) by a circular expanding ring with the following parameters: ring radius =6′′.50′′.5, inclination to the plane of the sky =59∘3∘ (where =0∘ is the ring in the plane of the sky and =90∘ is in the line of sight), major axis of the ring projected on the sky at P.A.=122∘3∘, expansion velocity =283 km s-1, and systemic velocity =452 km s-1, corrected to the Local Standard of Rest. The distance-dependent age of the ring, assuming no acceleration, is ring=1100 yr kpc-1.
The [N II] velocities of the polar caps are shown in Fig. 4. Assuming that they are located along the polar axis of the ring, their deprojected mean velocities are 115 km s-1 for the southern cap, and 95 km s-1 for the northern one.
Their age/distance parameter caps is between 1900 (part of the southern cap closer to the star) and 2800 yr kpc-1 (outermost region of the southern cap). This is roughly twice as large as for the ring. Thus, in the simple hypothesis of ballistic motions the caps must have been ejected before the ring. The lack of a clear increase of speed with distance from the central star along each cap might also suggest a continuous ejection process that lasted for a significant length of time, during a now extinct jet phase perhaps.
The limited resolution and depth of the NOT spectra do not allow us to perform a kinematical study of the faint emission extending from the ring to the caps.
We conclude that the morphology of the IPHASXJ194359.5+170901 nebula is that of an “equatorial” ring, where most of the emission (ionized mass) is concentrated, from which faint lobes depart, ending in low-ionization “polar” caps.
| Identification | Inner nebula | NW knot | |||||||
|---|---|---|---|---|---|---|---|---|---|
| Å | Fobs | err% | Fder | err% | Fobs | err% | Fder | err% | |
| HeII 3203.1 | 3201.1 | 25.6 | 7 | 46.8 | 9 | 18.1 | 8 | 33.0 | 10 |
| [Ne V] 3345.4 | 3344.3 | 59.9 | 4 | 102.0 | 7 | 7.7 | 10 | 13.1 | 12 |
| [Ne V] 3425.5 | 3424.6 | 173.8 | 3 | 286.4 | 6 | 19.6 | 4 | 32.2 | 7 |
| O III 3444.1? | 3442.5 | 3.0 | 15 | 5.0 | 16 | ||||
| [O II] 3726+3729 | 3726.8 | 6.0 | 20 | 8.9 | 21 | 84.4 | 3 | 125.0 | 5 |
| HI 3750.1 | 3749.6 | 1.8 | 24 | 2.6 | 24 | ||||
| HeI 3756.1blend | 3755.8 | 2.9 | 18 | 4.3 | 19 | ||||
| HI 3770.6 | 3770.6 | 2.8 | 11 | 4.1 | 12 | ||||
| HI 3797.9 | 3797.3 | 3.7 | 14 | 5.3 | 15 | 3.5 | 9 | 5.1 | 10 |
| HI 3835.3 | 3835.0 | 4.9 | 9 | 7.0 | 10 | 4.4 | 7 | 6.2 | 8 |
| [Ne III] 3869.0 | 3868.5 | 25.0 | 4 | 35.4 | 5 | 78.3 | 3 | 110.7 | 5 |
| HI 3889.0 | 3888.8 | 7.8 | 7 | 10.9 | 8 | 10.3 | 5 | 14.4 | 6 |
| [Ne III]+HeII | 3968.0 | 18.8 | 5 | 25.7 | 6 | 36.0 | 3 | 49.1 | 5 |
| HeII 4025.6 | 4025.8 | 1.3 | 24 | 1.7 | 24 | ||||
| [S II] 4068.6 | 4068.7 | 4.0 | 8 | 5.3 | 8 | ||||
| [SII] 4076.3 | 4076.6 | 1.0 | 20 | 1.3 | 20 | ||||
| HI 4101.7 | 4101.7 | 20.1 | 4 | 26.2 | 5 | 19.9 | 4 | 25.9 | 5 |
| HeII 4199.8 | 4200.5 | 1.9 | 25 | 2.4 | 25 | 1.1 | 25 | 1.4 | 25 |
| HI 4340.5 | 4340.5 | 39.7 | 3 | 47.5 | 4 | 38.5 | 3 | 46.0 | 4 |
| [O III] 4363.2 | 4363.3 | 7.9 | 7 | 9.4 | 7 | 13.9 | 4 | 16.5 | 4 |
| HeI 4471 | 4471.8 | 2.3 | 11 | 2.6 | 11 | ||||
| HeII 4541.6 | 4541.5 | 3.6 | 12 | 4.0 | 12 | 2.6 | 10 | 2.9 | 10 |
| HeII 4685.7 | 4685.7 | 105.2 | 3 | 111.6 | 3 | 79.6 | 3 | 84.4 | 3 |
| [Ar IV] 4711.4 | 4711.6 | 17.1 | 4 | 18.0 | 4 | 9.3 | 4 | 9.8 | 4 |
| [Ar IV] 4740.2 | 4740.1 | 12.6 | 5 | 13.1 | 5 | 6.9 | 5 | 7.1 | 5 |
| HI 4861.4 | 4861.2 | 100.0 | 3 | 100.0 | 3 | 100.0 | 3 | 100.0 | 3 |
| [O III] 4958.9 | 4958.8 | 179.3 | 3 | 173.7 | 3 | 436.8 | 3 | 423.1 | 3 |
| [O III] 5006.8 | 5006.7 | 534.6 | 3 | 510.0 | 3 | 1280.7 | 3 | 1221.6 | 3 |
| [N I] 5199 | 5198.6 | 3.7 | 9 | 3.4 | 9 | ||||
| HeII 5411.5 | 5411.9 | 9.4 | 30 | 7.9 | 30 | 7.5 | 30 | 6.3 | 30 |
| [Cl III] 5517.7 | 5518.0 | 1.2 | 33 | 1.0 | 33 | 2.2 | 15 | 1.8 | 15 |
| [Cl III] 5537.9 | 5538.5 | 0.7 | 47 | 0.6 | 47 | 1.8 | 19 | 1.5 | 19 |
| [N II] 5754.64 | 5754.8 | 4.2 | 6 | 3.2 | 6 | ||||
| HeI 5875.6 | 5875.7 | 1.8 | 29 | 1.3 | 29 | 8.2 | 6 | 6.2 | 6 |
| [O I] 6300.3 | 6300.1 | 19.8 | 3 | 13.4 | 5 | ||||
| [S III] 6312.1 | 6312.1 | 4.8 | 7 | 3.3 | 8 | 9.8 | 4 | 6.6 | 6 |
| [O I] 6363.8 | 6363.7 | 6.7 | 4 | 4.4 | 6 | ||||
| [Ar V] 6434.7 | 6435.2 | 7.2 | 5 | 4.7 | 7 | 1.1 | 18 | 0.7 | 18 |
| HeII 6527.1 | 6526.6 | 1.9 | 20 | 1.2 | 20 | ||||
| [N II] 6548.1 | 6547.9 | 5.3 | 8 | 3.4 | 9 | 93.7 | 3 | 60.2 | 6 |
| HI 6562.8 | 6562.7 | 416.8 | 3 | 267.1 | 6 | 460.0 | 3 | 294.8 | 6 |
| [N II] 6583.4 | 6583.2 | 12.7 | 4 | 8.1 | 7 | 298.1 | 3 | 190.2 | 6 |
| HeI+HeII | 6679.3 | 3.8 | 7 | 2.4 | 8 | ||||
| HeII 6683.2 | 6682.3 | 2.1 | 18 | 1.3 | 18 | ||||
| [S II] 6716.4 | 6716.3 | 3.9 | 8 | 2.4 | 10 | 48.2 | 3 | 29.9 | 6 |
| [S II] 6730.8 | 6730.6 | 3.3 | 11 | 2.1 | 12 | 51.7 | 3 | 32.0 | 6 |
| HeII 6890.9 | 6890.9 | 1.5 | 25 | 0.9 | 25 | 1.4 | 17 | 0.9 | 18 |
| [Ar V] 7005.4 | 7005.9 | 17.1 | 4 | 10.1 | 7 | 2.6 | 10 | 1.5 | 11 |
| HeI 7065 | 7064.9 | 2.6 | 9 | 1.5 | 11 | ||||
| [Ar III] 7135.8 | 7135.7 | 23.9 | 3 | 13.8 | 7 | 57.3 | 3 | 33.0 | 7 |
| [Ar IV]+HeII | 7175.6 | 2.1 | 13 | 1.2 | 14 | ||||
| [O II] 7319 | 7319.1 | 7.1 | 5 | 4.0 | 8 | ||||
| [O II] 7330 | 7329.6 | 5.7 | 5 | 3.2 | 8 | ||||
| [Cl IV] 7530 | 7529.8 | 1.6 | 24 | 0.9 | 25 | 1.7 | 18 | 0.9 | 19 |
| HeII 7592.7 | 7592.3 | 3.1 | 24 | 1.7 | 25 | 1.9 | 36 | 1.0 | 37 |
| [Ar III] 7751.1 | 7750.9 | 5.6 | 7 | 2.9 | 10 | 15.0 | 4 | 7.9 | 8 |
| [Cl IV] 8046.3 | 8045.9 | 4.9 | 8 | 2.5 | 11 | 3.2 | 9 | 1.6 | 12 |
| HeII 8236.8 | 8236.9 | 5.3 | 7 | 2.6 | 10 | 4.5 | 7 | 2.2 | 11 |
| HI 8545.4 | 8545.2 | 1.1 | 28 | 0.5 | 29 | ||||
| HI 8598.4 | 8598.5 | 1.6 | 28 | 0.8 | 29 | 2.1 | 12 | 1.0 | 15 |
| HI 8665.0 | 8664.6 | 1.2 | 21 | 0.6 | 23 | 2.4 | 10 | 1.1 | 13 |
| HI 8750.5 | 8750.2 | 2.3 | 22 | 1.1 | 24 | 2.4 | 13 | 1.1 | 15 |
| HI 8862.8 | 8862.1 | 3.4 | 13 | 1.6 | 15 | ||||
| HI 9014.9 | 9014.3 | 3.6 | 15 | 1.6 | 17 | 4.0 | 9 | 1.8 | 12 |
| [S III] 9068.6 | 9068.8 | 46.3 | 3 | 20.9 | 9 | 109.4 | 3 | 49.4 | 9 |
4 Chemical abundances
The WHT spectrum was used to compute the physical and chemical properties of the nebula. Three regions were considered (see Fig.2, bottom panel): the central star (CSPN), discussed in the next section; the inner nebula contained within a distance of 1.6 arcsec to 4.0 arcsec on both sides of the CSPN; and the bright NW knot extending from 5.0 to 8.4 arcsec on the NW side of the CSPN. The emission-line fluxes for the nebular regions are listed in Tab. 3: the errors quoted include both the uncertainty in the flux of each line (Poissonian, detector and background noise) and the determination of the instrumental sensitivity function for flux calibration.
The logarithmic extinction at , , was computed from the hydrogen Balmer decrement by averaging the results from the observed , , and ratios (weighted by their errors) in the two nebular regions. Owing to the high excitation of the nebula, the hydrogen Balmer lines are contaminated by unresolved HeII Pickering lines at a level of 6% for the inner nebula, and 4% for the knot. This contribution does not significantly affect the calculation of , but must be subtracted when the elemental abundances are computed (see below)111Note that fluxes in Tab. 3 are the observed ones, and include the contribution of the HeII lines to the HI emission.. The extinction law by Fitzpatrick (2004) with R=3.1 was adopted. The theoretical Balmer line ratios were derived from Blocklehurst (1971) for electron temperatures as determined below. We obtained , corresponding to . Line fluxes dereddened using this and the Fitzpatrick’s extinction law are also listed in Tab. 3.
The nebula of IPHASXJ194359.5+170901 is of high excitation. In the inner nebula, after dereddening [O III] 5007 is the strongest line followed by [Ne V] 3426. HeII 4686 is stronger than H, indicating the highest excitation class (10) according to the scheme set out by Dopita & Meatheringham (1990). In the NW knot, excitation is slightly lower as HeII and [Ne V] are relatively weaker, albeit the [O III]/H ratio is larger than in the inner nebula. This suggests, as confirmed by the chemical analysis below, that most of the oxygen in the inner nebula is in higher ionization stages which are not observed in the optical. This also holds for other elements including nitrogen and sulphur. In the knot, neutral species like [O I] and [N I] are also present. The mixture of high and low ionization atoms is only partly caused by the superposition along the line of sight of the high excitation gas belonging to the main body of the nebula with the relatively lower ionization of the ring’s knots.
The electron densities were computed from the [S II] 6731/6717 line ratio and, in the inner nebula, also from the [Ar IV] 4711/4740 ratio. The electron temperature was computed from the [O III] (5007+4959)/4363 ratio and, in the NW knot, also the [N II] (6583+6548)/5755 ratio. The nebular package in IRAF (Shaw & Dufour, 1995) was used, and results are listed in Tab. 4. Other indicators of density ([Cl III] 5518/5538) and temperature ([O II] (3726+3729)/(7320+7330), [S II] (6717+6731)/4072, [S III] (9069+9532)/6312) are available in the spectra, but the associated errors (from both the line measurements and the uncertainty on temperature/density) are much larger than for the adopted diagnostic ratios, and were therefore not used. The [N II] in the knot is 2000 K lower than the [O III] : this is typical of high excitation PNe (Kingsburg & Barlow, 1994; Perinotto & Corradi, 1998), as is the quite large value of in the inner nebula. Densities in IPHASXJ194359.5+170901 are conversely relatively low.
| Inner nebula | NW knot | |
| [SII] | 360 cm-3 | 820 cm-3 |
| [ArIV] | 370 cm-3 | |
| [OIII] | 14800 K | 12960 K |
| [NII] | [11000 K]∗ | 10920 K |
| He+/H+ | 0.0110.003 | 0.0520.005 |
| He2+/H+ | 0.1050.016 | 0.0770.009 |
| He/H | 0.1160.016 | 0.1290.010 |
| (11.06)♮ | (11.11)♮ | |
| O+/H+ | 0.025 | 0.430.13 |
| O2+/H+ | 0.590.06 | 2.000.20 |
| icf(O) | 1.830.15 | |
| O/H | 4.450.57 | |
| (8.64)♮ | ||
| N+/H+ | 0.015 | 0.300.03 |
| icf(N) | 10.363.40 | |
| N/H | 3.111.07 | |
| (8.49)♮ | ||
| (N+/O+) | -0.230.60 | -0.150.20 |
| Ne2+/H+ | 0.0980.015 | 0.450.08 |
| Ne4+/H+ | 0.710.10 | 0.130.02 |
| icf(Ne)† | 2.230.36 | |
| Ne/H † | 1.000.24 | |
| (8.00)♮ | ||
| Ne/H ‡ | 1.210.15 | 0.870.12 |
| (8.08)♮ | (7.94)♮ | |
| Ar2+/H+ | 0.570.06 | 1.810.19 |
| Ar3+/H+ | 1.100.10 | 0.790.07 |
| Ar4+/H+ | 0.940.10 | 0.180.03 |
| icf(Ar) | 1.110.04 | |
| Ar/H | 3.080.26 | |
| (6.49)♮ | ||
| S+/H+ | 0.0930.036 | 1.290.21 |
| S2+/H+ | 2.330.45 | 7.021.40 |
| icf(S) | 1.560.46 | |
| S/H | 13.984.43 | |
| (7.15)♮ | ||
| Cl2+/H+ | 0.370.12 | 1.070.19 |
| Cl3+/H+ | 1.010.20 | 0.800.49 |
| icf(Cl) | 2.480.31 | |
| Cl/H | 4.64 1.42 | |
| (5.67)♮ |
Given the temperatures and densities, the ionic abundances relative to hydrogen for all elements but helium were computed from the line fluxes relative to H using the ionic task in IRAF. Before the ionic abundances are computed, the contribution of the HeII 8-4 Pickering line has been subtracted from the H line.
For the knot’s spectrum, we have adopted the observed [OIII] for medium and high excitation species (doubly-ionized metals or in higher ionization stages), and the [NII] for the lower ionization species. For the inner nebula, the [NII] is not determined directly, and a value of 110002000 K was adopted. This is similar to the electron temperature in the knot’s spectrum, fits the empirical relationship between ([NII]) and ([OIII]) and the HeII4686 line intensity of equation 2 in Kingsburg & Barlow (1994), and is slightly larger than predicted by equation 3 of Kingsburg & Barlow (1994) and by Magrini et al. (2003). The concentration of helium ions relative to hydrogen was derived from the usual recombination lines assuming case B with the effective recombination coefficients from Hummer & Storey (1987) for the HeII and H lines, and from Benjamin et al. (1999) for the HeI lines.
Errors were derived by propagating both the errors in the line measurement and those on the adopted temperature and density. When the ionic abundance of an element is estimated from several independent emission lines, the weighted mean and its standard deviation were computed. To obtain the total abundances, we used the ionization correction factors (icfs) listed in Alexander & Balick (1997), whose primary source is Kingsburg & Barlow (1994). For chlorine, we adopt the icf formulation by Kwitter & Henry (2001). Errors on the total abundances are obtained by propagating the errors on the mean ionic abundances as well as on the icfs. Ionic and total abundances, and their errors, are listed in Tab. 4. Note that the total abundances in the inner nebula are not quoted for any element except helium. This is because most of the gas is in high ionization stages which are not measured, making the icfs (120 for nitrogen!) and their errors, and thus the computed abundances, very large. The problem is less severe in the lower ionization NW knot.
According to the chemical abundances computed in the ring’s knot, IPHASXJ194359.5+170901 is located just on the side of type I PNe in the He/H vs. N/O diagram, within the range covered by bipolar PNe (Perinotto & Corradi, 1998). However, the N/O and He/H overabundances are mild and their errors are non negligible. Abundances for the other elements are typical of the majority of PNe (cf. Tab. 3 in Perinotto & Corradi 1998, and Tab. 14 in Kingsburg & Barlow 1994).


5 The binary central star
5.1 Light curve
The central star’s coordinates are R.A.19 43 59.51 and Dec17 09 00.9 (J2000). Its light curve in the band from data in Tab. 2, folded on the period determined below, is shown in Fig. 5.
The photometric data set was subjected to a period analysis using Schwarzenberg-Czerny’s (Schwarzenberg-Czerny, 1996) analysis-of-variance (AOV) method implemented in MIDAS. The AOV periodogram shows the strongest peak at cycle d-1, which corresponds to a period of days. A sine fit to the whole data set results in d, an -band amplitude (defined as half the peak-to-peak variation) of mag (among the largest known in this class of objects), and an average magnitude of mag. The fit is shown as a dotted line in Fig. 5. Uncertainties quoted above are the formal errors of the fit: a better sampling of the curve at all phases is needed to refine the period and fix the error. In any case, we take the observed CSPN variability as a clear indication of binarity, the brightness modulation being the result of observing the irradiated side of a companion, heated by the hot core that ejected the PN, at different angles during the orbital motion. This is supported by the spectrum presented in next section. Within this hypothesis, maximum brightness occurs at (HJD), at orbital phase i.e. at inferior conjunction of the hot component.
The amplitude of reflection effect seen here is at the high end, but compatible with those seen in a range of young post common envelope binaries (Aungwerojwit et al., 2007).
5.2 The irradiated spectrum
The spectrum of the CSPN is shown in Fig. 6. It consists of a continuum slowly declining with increasing wavelength, and a rich set of emission-lines. In the figure, the contribution from the extended nebula was subtracted by interpolating nebular regions on the opposite sides of the CSPN and as close to it as possible. The subtraction is generally accurate, except at the wavelengths of the brightest nebular lines (mainly HeII4686, H and H). At the resolution (3 Å) and S/R ratio (25) of the blue side of our spectrum, no absorption lines from the hot ionizing CSPN are detected (the feature at HeII 4686 is likely a nebula subtraction residual). The phase of the orbital period for this spectrum is not known, as the period parameters are not precise enough to trace it back to 2007.
As in similar close binary CSPNs (e.g. BE UMa, P=2.3 days, Ferguson & James 1994), the high order lines of the HI Balmer and (fainter) Paschen sequences are observed in emission. The Balmer decrement, which has a better S/N ratio and resolution, is remarkably flat from H to the highest order transitions. Information for H and H is limited by the uncertainty in the subtraction of the overlapping nebula, as mentioned above, but the two lines are definitely weaker than H. In BE UMa, this flat Balmer decrement is explained as an optical depth effect in the dense irradiated atmosphere of the secondary (Ferguson & James, 1994). The high-order Balmer lines are resolved (FWHM5 Å after correcting for the instrumental width) which can be explained by Stark broadening. As in BE UMa the Balmer jump is seen in emission.
The spectrum shows a number of narrow (unresolved) emission lines, which are also assumed to come from the irradiated side of the secondary. The most prominent group is the blend around 4650 Å (bottom panel of Fig. 6). Given the presence of strong OIII lines at 3131 and 3444 Å, the origin of some lines of this blend may be explained by the Bowen fluorescence mechanism (Bowen, 1934), which would result in the formation of the N III lines observed at 4635 and 4641 Å. The peak of the blend is resolved in two components which are identified as the 3S-3Po C III transitions at 4649 and 4652 Å. This is preferred to the alternative identification of lower excitation O II lines (but a contribution of both is not excluded), because of a better wavelength match, and because the C III 5696, C IV 4658, C IV 5801 and C IV 5812 lines are also observed, showing a quite high degree of excitation in the irradiated spectrum of IPHASXJ194359.5+170901. This is higher than in e.g. BE UMa, where no C IV lines are detected, but similar to e.g. V477 Lyrae (Pollacco & Bell, 1994) and ETHOS1, another new PN with a close binary nucleus (Miszalski et al., 2010). Other C III and C II lines, as well as low and high-excitation narrow lines of other elements, are tentatively identified in the WHT spectrum of IPHASXJ194359.5+170901. Given the limited spectral resolution, and the uncertainty in the Doppler shift (and hence of the line identification) introduced by the unknown contribution of the orbital motion, we defer a more detailed analysis of the emission line spectrum when higher quality data and a radial velocity curve are obtained.
The continuum, dereddened using (Sect. 4), cannot be fit by a single black body over the whole observed spectral range (3200 to 9200 Å). A single black body with T=8000 K provides a reasonably good fit only for 5000 Å, while a good fit to the whole spectral range is obtained with a black body temperature between 6000 and 7000 K (typical of an F-type star) plus an additional much hotter component – presumably the ionizing/irradiating primary – whose contribution would dominate the emission at wavelengths shorter than 4000-5000 Å. The temperature estimated for the reprocessed component of the secondary atmosphere is similar to that determined for the companion in BE UMa.
6 Distance, mass, size and age
The distance to IPHASXJ194359.5+170901 can be estimated using the relation between the H surface brightness and radius of the nebula (Frew & Parker, 2006). This can be seen as a variant of the mass–radius relationship (e.g. Daub, 1982), but it has been carefully calibrated over a large range of sizes and surface brightnesses and for different classes of PNe. The radius of IPHASXJ194359.5+170901, computed as the geometric mean of the major and minor semi-axes of the inner elliptical body of the nebula defined at 10% peak brightness, is 10′′.5. The dereddened mean surface brightness of the nebula within this ellipse is (H) 6.11.3 10-15 erg cm-2 s-1 arcsec-2. It was computed by combining the flux-calibrated H+[NII] IPHAS images, the narrow band NOT images which separate the [NII]6583 and H emission, and the flux-calibrated WHT spectra. These figures, included in the updated log-log correlation between radius and surface brightness for the subsample of high-excitation, optically-thin PNe222Note that this subsample includes a number of PNe with close binary CSPNs (Frew & Parker, 2007). like IPHASXJ194359.5+170901 result in a distance =4.61.1 kpc. The quoted error includes the measured uncertainties on (H), combined in quadrature with the dispersion in the correlation (Frew, 2008).
IPHASXJ194359.5+170901 is located close to the Galactic plane (=3.37∘) at longitude =54.16∘. The systemic velocity of the nebular ring (+45 km s-1, see Sect. 3), assuming that the nebula participates in the general circular rotation around the Galactic centre, would imply a lower limit of 1.6 kpc for the distance, at 1 of the estimated error which is mainly due to the velocity dispersion ellipsoids of stars in the Galaxy (Nordström et al., 2004).
For a distance of 4.6 kpc, the ionized mass of its nebula computed from the total H flux and for a standard choice of the filling factor (0.4, with a 100% uncertainty due to the highly aspherical geometry of the nebula) is 0.060.03 M⊙, within the range of masses determined for other PNe (Frew & Parker, 2010). The total size of the nebula, including the faint polar extensions, is considerable, 2.7 pc. The kinematical age of the ring would be 5000 years, and the maximum age of the polar caps would be 13000 years.
7 Discussion
IPHASXJ194359.5+170901 is a new Galactic PN with remarkable properties. Its IAU-approved name is PN G054.2-03.4. Analysis of the images and the [N II] line Doppler shifts indicate that its symmetry axis is inclined to the line of sight by 59∘, that most of the gas was ejected in an “equatorial” direction corresponding to the observed knotty ring, and that faint “polar” extensions culminate in low-ionization caps travelling at a speed of roughly 100 km s-1. The kinematical data would suggest a sequence of ejection from the progenitor consisting of a (continuous?) polar outflow during several 103 yr, followed, a few 103 years later, by the ejection of the envelope along the equatorial direction. A similar age difference between the high-velocity polar outflow and the inner nebula is computed for Abell 63 (Mitchell et al., 2007) and Hb 12 (Vaytet et al., 2009) which have a confirmed or suspected binary CSPN, respectively. This picture is however based on the simplistic assumption of ballistic motion, and does not take into account acceleration/deceleration due to the hydrodynamical evolution of the structures, as well as possible slowing down of gas with time by interaction with the environment, which would reduce the age difference with respect to the main equatorial outflow. Note also that this result apparently contradicts the finding that in proto-PNe jets are produced slightly later than equatorial torii (Huggins, 2007). These molecular tori expand at a lower speed than the ionized ring of IPHASXJ194359.5+170901, which might indicate different ejection processes or a significant acceleration of the gas after photoionization and the fast wind from the central star arise. However, the two samples do not seem to be evolutionary linked as no evidence for close binary central stars are found in the proto-PN objects (Hrivnak, 2010).
The main result of this study is the discovery that the central star of IPHASXJ194359.5+170901is a close binary. Its orbital period is 1.16 days. This lies at the longer tail of the binary CSPN period distribution (Miszalski et al., 2009a), and implies that the system went through common–envelope (CE) evolution before the ejection of the PN, which made the orbit shrink to the present value. The recent discovery of a significant number of PN binary central stars (Miszalski et al., 2009a), provides the base for a better understanding of the effects of binarity on the mass loss processes at the end of stellar evolution. IPHASXJ194359.5+170901 supports the increasing evidence in PNe (but not in proto-PNe, see above) of a correlation between the appearance of morphological features like rings and collimated high-velocity outflows with the presence of a close binary central star (Miszalski et al., 2009b). Strictly speaking, Abell 63 (Mitchell et al., 2007) and IPHASXJ194359.5+170901 are the only PNe with a close binary central star for which the presence of a high-velocity collimated outflow along the symmetry axis of the main nebula (i.e. the polar directions) has been demonstrated. In NGC 6337, a supersonic collimated outflow is also detected, but its orientation with respect to the main nebular ring is not completely clear (Corradi et al., 2000; García-Díaz et al., 2009). Other close binary PNe with similar polar outflows are likely to be Sab 41 (Miszalski et al., 2009b) and ETHOS1 (Miszalski et al., 2010), but kinematical data are needed to confirm this. Most of the other cases quoted in the literature (see De Marco, 2009), like the well studied object, K 1–2, are instead dubious identifications (Corradi et al., 1999; Miszalski et al., 2009b), mainly because of the lack of convincing evidence for large expansion speeds.
Another notable characteristic of IPHASXJ194359.5+170901 is its prominent equatorial ring, a morphological feature that appears to be distinctive of PNe with close binary central stars (Miszalski et al., 2009b). Clear examples are the already cited NGC 6337 and Sab 41, as well as Hen 2–428 (Santander–García et al. in preparation). SuWt 2 also falls in this morphological class, but the nature of the central system (binary or triple?) is less clear (Jones et al., 2010). Note that these marked equatorial outflows are also observed in much wider binaries like the symbiotic Miras (e.g. Hen 2-147, Santander–García et al., 2007), as well as in massive stars (Smith, Bally, & Walawender, 2007) including SN1987A (Plait et al., 1995).
Models predict that a sudden envelope ejection results from CE evolution and that it is strongly concentrated toward the orbital plane (Sandquist et al., 1998). This would correspond to the “equatorial” rings/tori observed in a number of these PNe. As discussed for NGC 6337 (Corradi et al., 2000), the clumpy appearance of the ring of IPHASXJ194359.5+170901, in the form of low-ionization knots with outward-facing radial tails, can be explained as density fluctuations created during the envelope ejection and later exacerbated by the action of the expanding ionization front or the post–AGB fast wind. Alternatively, the ring’s knots would be created by radiative shocks leading to the fragmentation of the shell without involving previous density inhomogeneities. The polar outflow could then be the result of inertial confinement of the gas, forced by the flattened deposition of the envelope, when further shaping of the PN takes place under the action of a fast wind from the post–AGB primary (Icke et al., 1992). Additionally/alternatively, a strong magnetic field in the AGB envelope, especially if spun up by the gain of orbital angular momentum during the CE phase, might play a role in the shaping outflow both in the equatorial plane and in the polar directions (Blackman et al., 2000; but see Soker & Harpaz, 1992). In such cases, the polar outflow would be produced together with the ring (or later), and therefore the apparent difference in their kinematical ages in IPHASXJ194359.5+170901 (and Abell 63 and Hb 12) would not reflect a real age difference.
Another possibility is that the high-velocity polar outflow is produced before the CE phase from an accretion disc around the secondary, which can accrete matter from the wind of the primary or via Roche-lobe overflow (Soker, 1998; Soker & Rappaport, 2000). This would explain why the polar outflow has a kinematical age larger than that of the ring.
In all models above, the inclination of the orbit of the IPHASXJ194359.5+170901 CSPN would be the same as of the nebular ring, namely 59∘.
The radiation from the hot CSPN causes strong irradiation effects in the illuminated side of the secondary. They dominate the spectrum presented in this paper, and consist of narrow lines of metals with ionization potential as high as 64.5eV (C IV), relatively broad HI emission in a flat Balmer sequence, and a continuum in the visible range that is fit by a black body with temperature around 6000-7000 K plus a much hotter component. It is clear that these remarkable characteristics invite a more detailed study of the central source, aimed at detecting the spectral signature of the hot ionizing star, determining the radial velocity curve for both components, and modelling the irradiation spectrum to derive the main parameters of the two stars. This is considered the first priority for the future.
With the data presently available, a robust upper limit of 1.0 M⊙ for the mass of the secondary can be estimated by converting the apparent magnitude in the band of the CSPN at minimum (corrected for the adopted interstellar reddening and adopting a distance of 4.6 kpc), to an upper limit to the absolute magnitude of the non-irradiated side of the secondary. Assuming a mass between 0.5 to 1.0 M⊙ for the hot post-AGB star, the observed photometric period of 1.16 days implies the separation of the two stars to be between 4 and 6 solar radii. In no case the secondary fills its Roche lobe if it is a main-sequence star, and no mass transfer to the post-AGB star presently occurs in the system.
Acknowledgments
Based on observations obtained with: the 4.2m WHT and the 2.5m INT telescopes of the Isaac Newton Group of Telescopes, the 2.6m Nordic Optical Telescope operated by NOTSA, the 1.2m Mercator Telescope operated by the Flemish Community, and the 0.8m IAC80 telescope, operating on the islands of La Palma and Tenerife at the Spanish Observatories of the Roque de Los Muchachos and Teide of the Instituto de Astrofísica de Canarias. The WHT data were obtained as part of the International Time Programme awarded to the IPHAS collaboration.
The work of RLMC, LS, MSG, AMR, and KV has been supported by the Spanish Ministry of Science and Innovation (MICINN) under the grant AYA2007-66804. We are grateful to Orsola De Marco and Noam Soker for fruitful discussion.
References
- Alexander & Balick (1997) Alexander, J., Balick, B. 1997, AJ, 114, 713
- Aungwerojwit et al. (2007) Aungwerojwit, A., G nsicke, B. T., Rodr guez-Gil, P., Hagen, H.-J., Giannakis, O., Papadimitriou, C., Allende Prieto, C., Engels, D. 2007, A&A, 469, 207
- Benjamin et al. (1999) Benjamin, R.A., Skillman, E.D., Smits, D.P. 1999, ApJ, 514, 307
- Blackman et al. (2000) Blackman, E.G., Frank, A., Markiel, J.A., Thomas, J.H., Van Horn, H.M. 2000, Nature, 409, 485
- Blocklehurst (1971) Brocklehurst, M., 1971, MNRAS, 153, 471
- Bowen (1934) Bowen, I.S. 1934, PASP, 46, 146
- Condon et al. (1998) Condon, J.J., Cotton, W.D., Greisen, E.W., Yin, Q.F., Perley, R.A., Taylor, G.B., Broderick, J.J. 1998, AJ, 115, 1693
- Corradi et al. (1999) Corradi, R.L.M., Perinotto, M., Villaver, E. Mampaso, A. Gonçalves, D.R. 1999, ApH, 523, 821
- Corradi et al. (2000) Corradi, R.L.M., Gonçalves, D.R., Villaver, E., Mampaso, A., Perinotto, M., Schwarz, H.E., Zanin, C. 2000, ApJ, 535, 823
- e.g. Daub (1982) Daub, C.T., 1982, ApJ, 260, 612
- see De Marco (2009) De Marco, O. 2009, PASP, 121, 316
- Dopita & Meatheringham (1990) Dopita, M.A., Meatheringham, S.J. 1990, ApJ, 357, 140
- Drew et al. (2005) Drew, J., Greimel, R., Irwin, M.J., et al. 2005, MNRAS, 362, 753
- Ferguson & James (1994) Ferguson, D.H., James, T.A. 1994, ApJS, 94, 723
- Frew (2008) Frew, D.J., 2008, hD thesis, Macquarie University, Sydney, Australia
- Frew & Parker (2006) Frew, D.J., Parker, Q.A. 2006, in IAU Symp. 234, Planetary Nebulae in our Galaxy and Beyond, M.J. Barlow & R.H. Mendez eds., p. 49
- Frew & Parker (2007) Frew, D.J., Parker, Q.A. 2007, in Asymmetrical Planetary Nebulae IV, IAC Electronic Pub., Eds, Corradi, R.L.M., Manchado, A. & Soker, N., p. 475
- Frew & Parker (2010) Frew, D.J., Parker, Q.A. 2010, PASA, 27, 129
- Fitzpatrick (2004) Fitzpatrick E.L., 2004, in “Astrophysics of Dust”, Witt A.N., Clayton G.C. & Draine B.T. eds., ASP Conf. Ser., Vol. 309, p. 33
- García-Díaz et al. (2009) García-Díaz, Ma.T., Clark, D.M., López, J.A., Steffen, W., Richer, M.G. 2009, ApJ, 699, 1633
- Giammanco et al. (2010) Giammanco, C., Sale, S.E., Corradi, R.L.M., et al. 2010, A&A, submitted
- Gonçalves et al. (2001) Gonçalves, D.R., Corradi, R.L.M., Mampaso, A. 2001, ApJ, 547, 302
- Huggins (2007) Huggins, P.J. 2007, ApJ, 663, 342
- Hrivnak (2010) Hrivnak, B., 2010, Proceedings of the conference “Asymmetrical planetary nebulae V. The shaping of stellar ejecta”, in preparation
- Hummer & Storey (1987) Hummer, D.G., Storey, P.J. 1987, MNRAS 224, 801
- Jones et al. (2010) Jones, D., Lloyd, M., Mitchell, D.L., Pollacco, D.L., O’Brien, T.J., Vaytet, N.M.H. 2010, MNRAS, 401, 405
- Kingsburg & Barlow (1994) Kingsburgh, R.L., Barlow, M.J. 1994 MNRAS, 271, 257
- Kwitter & Henry (2001) Kwitter, K.B., Henry, R.B.C. 2001, ApJ, 562, 804
- Icke et al. (1992) Icke, V., Mellema, G., Balick, B., Eulderink, F., Frank, A. 1992, Nature, 355, 524
- e.g. Livio (2000) Livio, M. 2000, in Asymmetrical Planetary Nebulae II: From Origins to Microstructures, ASP Conf. Ser., Vol. 199, p. 243
- Magrini et al. (2003) Magrini, L., Perinotto, M., Corradi, R.L.M., Mampaso, A. 2003, A&A, 400, 511
- Miszalski et al. (2009a) Miszalski, B., Acker, A., Moffat, A.F.J., Parker, Q.A., Udalski, A. 2009a, A&A, 496, 813
- Miszalski et al. (2009b) Miszalski, B., Acker, A., Parker, Q.A., Moffat, A.F.J. 2009b, A&A, 505, 249
- Miszalski et al. (2010) Miszalski, B. et al. 2010, MNRAS, submitted
- Mitchell et al. (2007) Mitchell, D.L., Pollacco, D., O’Brien, T.J., et al. 2007, MNRAS, 374, 1404
- Nordström et al. (2004) Nordström, B., Mayor, M., Andersen, et al. 2004, A&A, 418, 989
- Oke (1990) Oke, T.R. 1990, AJ, 99, 1621
- Perinotto & Corradi (1998) Perinotto, M., Corradi R.L.M., 1998, A&A, 332, 721
- Plait et al. (1995) Plait, P.C., Lundqvist, P., Chevalier, R.A., Kirshner, R.P. 1995, ApJ, 439, 370
- Pollacco & Bell (1994) Pollacco, D.L., Bell, S.A. 1994, MNRAS, 267, 452
- Sabin et al. (2010) Sabin L., et al. 2010, MNRAS, in preparation
- Santander–García et al. (2007) Santander–García, M., Corradi, R.L.M., Whitelock, P.A., Munari, U., Mampaso, A., Marang, F., Boffi, F., Livio, M. 2007, A&A, 465, 481
- Sandquist et al. (1998) Sandquist, E.L., Taam, R.E., Chen, X., Bodenheimer, P., Burkert, A. 1998, ApJ, 500, 909
- Schwarzenberg-Czerny (1996) Schwarzenberg-Czerny, A. 1996, ApJ, 460, L107
- Shaw & Dufour (1995) Shaw, R.A., Dufour, R.J 1995, PASP, 107, 896
- Smith, Bally, & Walawender (2007) Smith, N., Bally, J., Walawender, J. 2007, ApJ, 134, 846
- Soker (1998) Soker, N. 1998, ApJ 496, 833
- but see Soker & Harpaz (1992) Soker, N., Harpaz, A. 1992, PASP, 104, 923
- Soker & Rappaport (2000) Soker, N., Rappaport, S. 2000, ApJ 538, 241
- Vaytet et al. (2009) Vaytet, N.M.H., Rushton, A.P., LLoyd, M., et al. 2009, MNRAS, 398, 385
- Viironen et al. (2009) Viironen, K., Greimel, R., Corradi, R.L.M. et al. 2009, A&A, 504, 291